. 2021 Mar 25;11(1):6921.
doi: 10.1038/s41598-021-86427-4.

Deep viral blood metagenomics reveals extensive anellovirus diversity in healthy humans

Affiliations

Deep viral blood metagenomics reveals extensive anellovirus diversity in healthy humans

María Cebriá-Mendoza et al. Sci Rep. .

Abstract

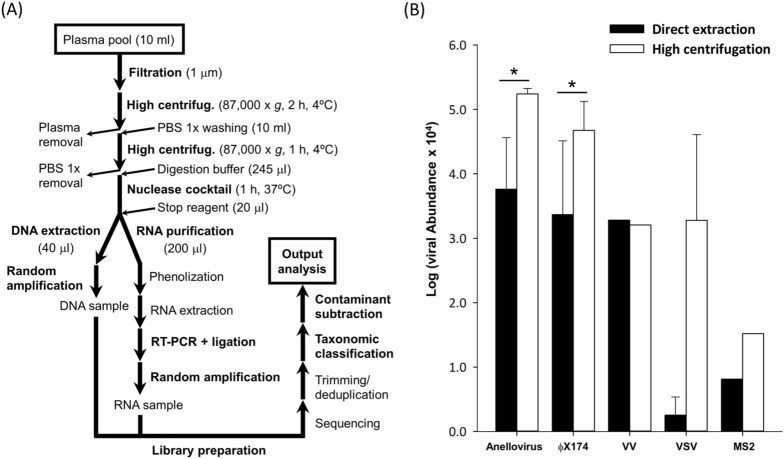
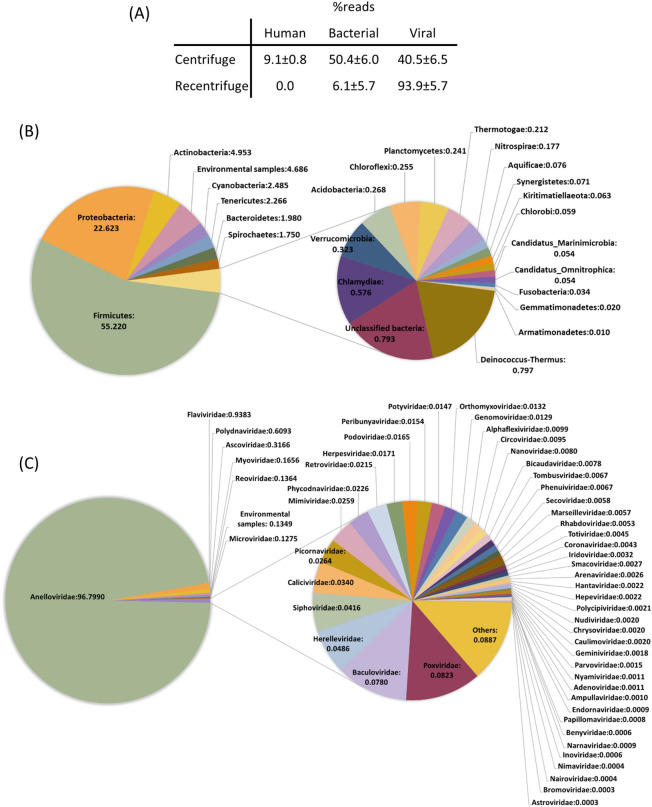
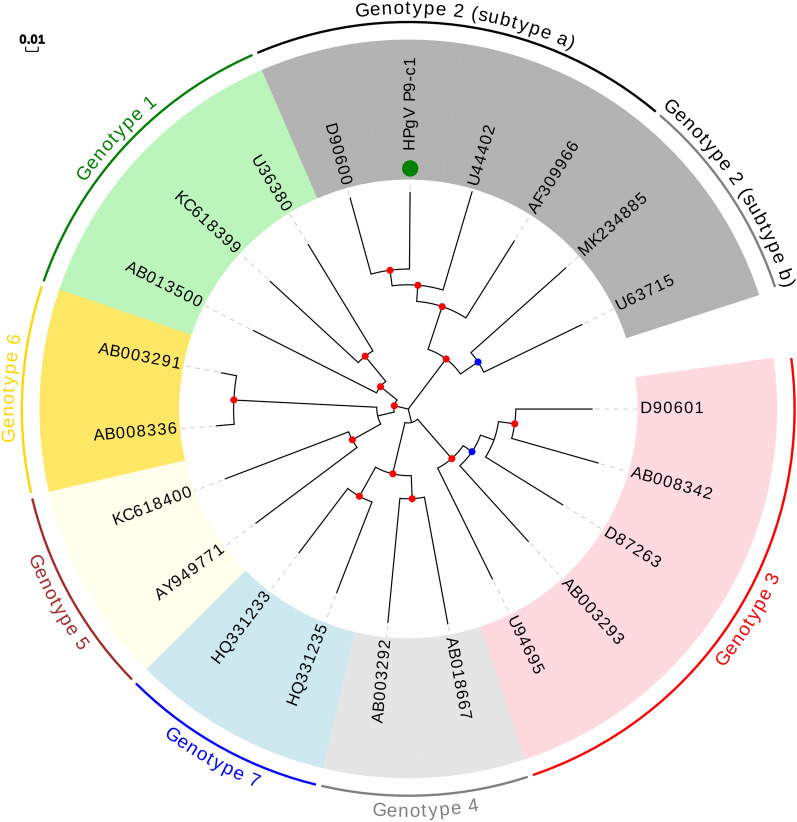
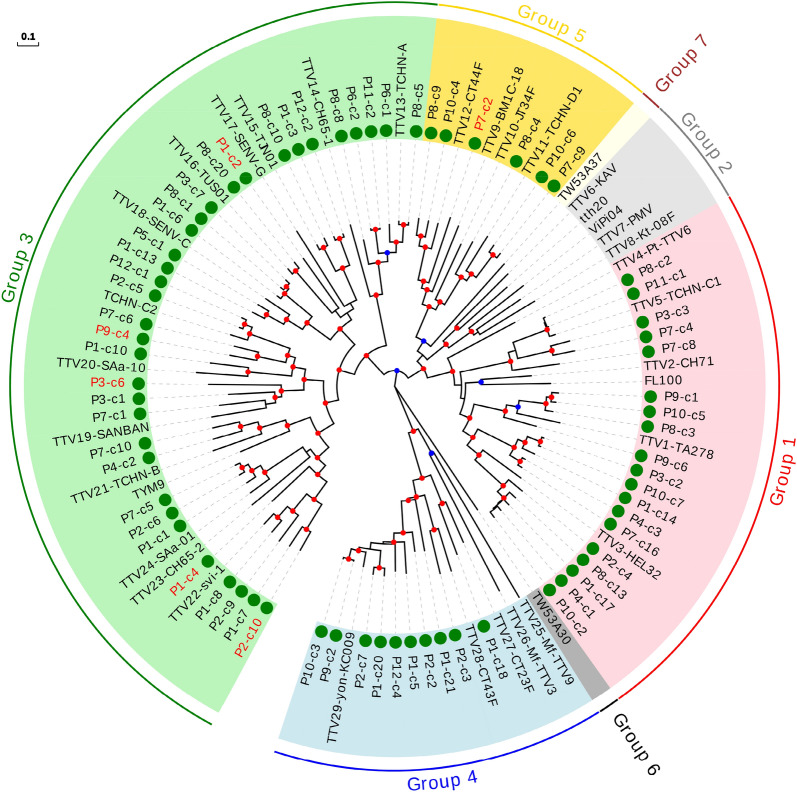
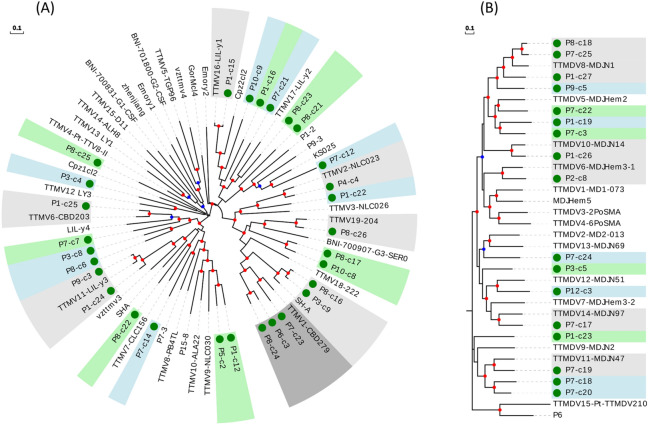
Human blood metagenomics has revealed the presence of different types of viruses in apparently healthy subjects. By far, anelloviruses constitute the viral family that is more frequently found in human blood, although amplification biases and contaminations pose a major challenge in this field. To investigate this further, we subjected pooled plasma samples from 120 healthy donors in Spain to high-speed centrifugation, RNA and DNA extraction, random amplification, and massive parallel sequencing. Our results confirm the extensive presence of anelloviruses in such samples, which represented nearly 97% of the total viral sequence reads obtained. We assembled 114 different viral genomes belonging to this family, revealing remarkable diversity. Phylogenetic analysis of ORF1 suggested 28 potentially novel anellovirus species, 24 of which were validated by Sanger sequencing to discard artifacts. These findings underscore the importance of implementing more efficient purification procedures that enrich the viral fraction as an essential step in virome studies and question the suggested pathological role of anelloviruses.


Conflict of interest statement

The authors declare no competing interests.

Figures

Figure 1
Figure 1
Experimental and bioinformatics workflow (A) and comparison between viral abundance estimated with direct extraction from plasma and the protocol involving initial high centrifugation (B). Main steps at panel (A) are marked in bold (See details in Methods section). For panel (B), comparison of normalized data was achieved by transforming total reads for each specific taxonomic group into abundance, which was obtained with Centrifuge using an Estimation-Maximization algorithm (See details in Methods section). For clarity, abundance × 104 was represented in log scale. Error bars indicate standard error of the mean (SEM, n = 2 replicates). Asterisk indicates the statistical significance of a t-test analyzing the efficiency of the purification protocols (*P<0.01). For VV, the only indicated value for each treatment was obtained with 1 μm pore size filtration.
Figure 2
Figure 2
Summary of bioinformatics subtraction (i.e. mean frequency of reads (± SEM) before and after using Recentrifuge for the twelve analyzed pools) for human, bacterial and viral groups (A) and description of the microbiome (B) and the virome (C) characterized in this study. Classification is shown for bacteria and viruses at phylum and family level, respectively. Frequencies were obtained excluding spiked virus contribution in (A,C) panels.
Figure 3
Figure 3
Phylogenetic tree based on the full coding sequence (i.e. the polyprotein) including representative isolates of the seven known HPgV genotypes. The sequence described in this study is indicated with a green circle. For genotype 2, distinct members from 2a and 2b subtypes are shown. Bootstrap values ranging 0.75–0.9 and 0.9–1.0 are indicated with blue and red circles, respectively. The scale bar indicates evolutionary distance in nucleotide substitutions per site.
Figure 4
Figure 4
Phylogenetic tree for the ORF1 including the representative genotypes from TTV genus. Sequences described in this study are marked with a green circle. Those sequences that could be considered as new species are labelled in red. 0.7–0.85 and 0.85–1.0 bootstrap value ranges are indicated with blue and red circles, respectively. Scale bar indicates evolutionary distance in nucleotide substitutions per site.
Figure 5
Figure 5
Phylogenetic trees for the ORF1 including the representative genotypes from TTMV (A) and TTMDV (B) genera. Sequences described in this study are marked with a green circle. New species (including one or more new sequences) are indicated with background green or blue color in order to distinguish contiguous clusters. Clusters of representative species including new sequences are indicated with background light or dark grey colors in order to distinguish contiguous clusters. 0.7–0.85 and 0.85–1.0 bootstrap value ranges are indicated with blue and red circles, respectively. Scale bar indicates evolutionary distance in nucleotide substitutions per site.

References

    1. Koonin EV, Dolja VV. Metaviromics: A tectonic shift in understanding virus evolution. Virus Res. 2018;246:A1–A3. doi: 10.1016/j.virusres.2018.02.001. - DOI - PubMed
    1. Delwart E. Animal virus discovery: Improving animal health, understanding zoonoses, and opportunities for vaccine development. Curr. Opin. Virol. 2012;2:344–352. doi: 10.1016/j.coviro.2012.02.012. - DOI - PMC - PubMed
    1. Kapoor A, et al. A highly prevalent and genetically diversified Picornaviridae genus in South Asian children. Proc. Natl. Acad. Sci. U.S.A. 2008;105:20482–20487. doi: 10.1073/pnas.0807979105. - DOI - PMC - PubMed
    1. Chow C-ET, Suttle CA. Biogeography of viruses in the sea. Annu. Rev. Virol. 2015;2:41–66. doi: 10.1146/annurev-virology-031413-085540. - DOI - PubMed
    1. Paez-Espino D, et al. Uncovering earth’s virome. Nature. 2016;536:425–430. doi: 10.1038/nature19094. - DOI - PubMed

Publication types