

Vital sign metrics of VLBW infants in three NICUs: implications for predictive algorithms
- PMID: 33767372
- PMCID: PMC8376742
- DOI: 10.1038/s41390-021-01428-3
Vital sign metrics of VLBW infants in three NICUs: implications for predictive algorithms
Erratum in
-
Correction: Vital sign metrics of VLBW infants in three NICUs: implications for predictive algorithms.Pediatr Res. 2021 Jul;90(1):233. doi: 10.1038/s41390-021-01621-4. Pediatr Res. 2021. PMID: 34262133 Free PMC article. No abstract available.
Abstract
Background: Continuous heart rate (HR) and oxygenation (SpO2) metrics can be useful for predicting adverse events in very low birth weight (VLBW) infants. To optimize the utility of these tools, inter-site variability must be taken into account.
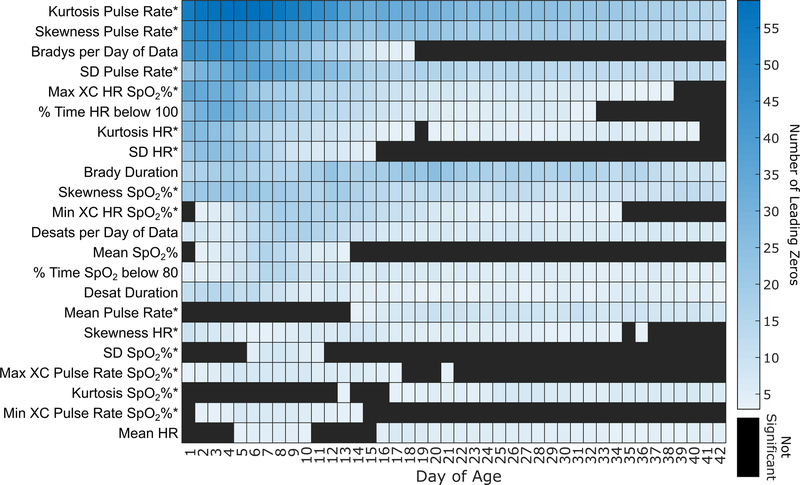
Methods: For VLBW infants at three neonatal intensive care units (NICUs), we analyzed the mean, standard deviation, skewness, kurtosis, and cross-correlation of electrocardiogram HR, pulse oximeter pulse rate, and SpO2. The number and durations of bradycardia and desaturation events were also measured. Twenty-two metrics were calculated hourly, and mean daily values were compared between sites.
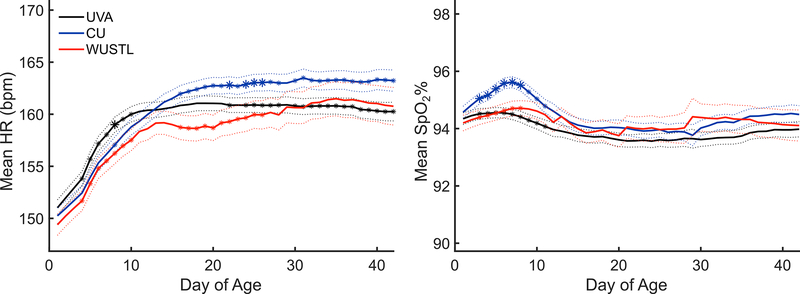
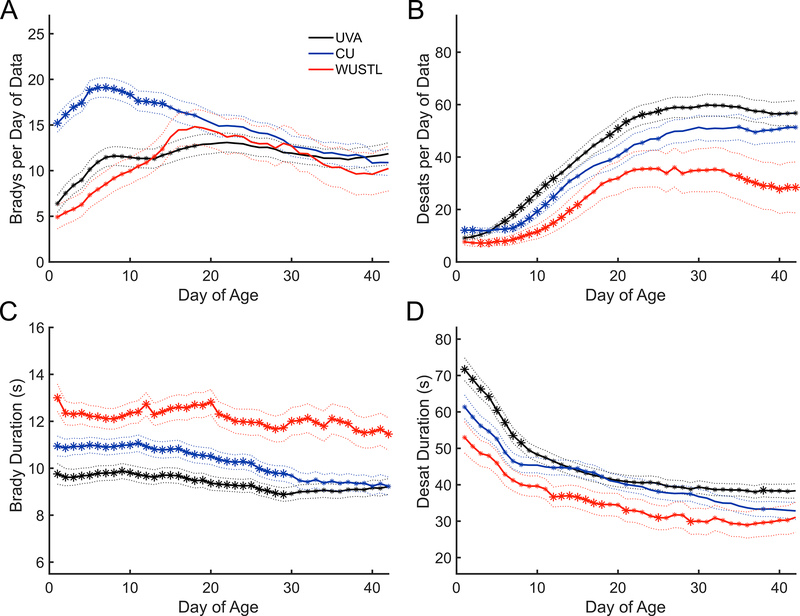
Results: We analyzed data from 1168 VLBW infants from birth through day 42 (35,238 infant-days). HR and SpO2 metrics were similar at the three NICUs, with mean HR rising by ~10 beats/min over the first 2 weeks and mean SpO2 remaining stable ~94% over time. The number of bradycardia events was higher at one site, and the duration of desaturations was longer at another site.
Conclusions: Mean HR and SpO2 were generally similar among VLBW infants at three NICUs from birth through 6 weeks of age, but bradycardia and desaturation events differed in the first 2 weeks after birth. This highlights the importance of developing predictive analytics tools at multiple sites.
Impact: HR and SpO2 analytics can be useful for predicting adverse events in VLBW infants in the NICU, but inter-site differences must be taken into account in developing predictive algorithms. Although mean HR and SpO2 patterns were similar in VLBW infants at three NICUs, inter-site differences in the number of bradycardia events and duration of desaturation events were found. Inter-site differences in bradycardia and desaturation events among VLBW infants should be considered in the development of predictive algorithms.
© 2021. The Author(s), under exclusive licence to the International Pediatric Research Foundation, Inc.
Conflict of interest statement
Disclosure Statement
RM and DL have equity shares in Medical Predictive Science Corporation, Charlottesville, VA. RM is an officer and owns equity in Advanced Medical Predictive Devices, Diagnostics, and Displays. SR has received consulting fees from Airway Therapeutics. The other authors declare no conflicts of interest.
Figures
References
-
- Joshi R et al.Predicting Neonatal Sepsis Using Features of Heart Rate Variability, Respiratory Characteristics, and ECG-Derived Estimates of Infant Motion. IEEE J. Biomed. Heal. Informatics 24, 681–692 (2020). - PubMed
-
- Dewhurst CJ, Cooke RWI & Turner MA Clinician observation of physiological trend monitoring to identify late-onset sepsis in preterm infants. Acta Paediatr. Int. J. Paediatr. 97, 1187–1191 (2008). - PubMed
Publication types
MeSH terms
Grants and funding
LinkOut - more resources
Full Text Sources
Other Literature Sources
Medical
