. 2021 Sep;17(9):937-946.
doi: 10.1038/s41589-021-00770-1. Epub 2021 Mar 25.

LYTACs that engage the asialoglycoprotein receptor for targeted protein degradation

Affiliations

LYTACs that engage the asialoglycoprotein receptor for targeted protein degradation

Green Ahn et al. Nat Chem Biol. 2021 Sep.

Abstract

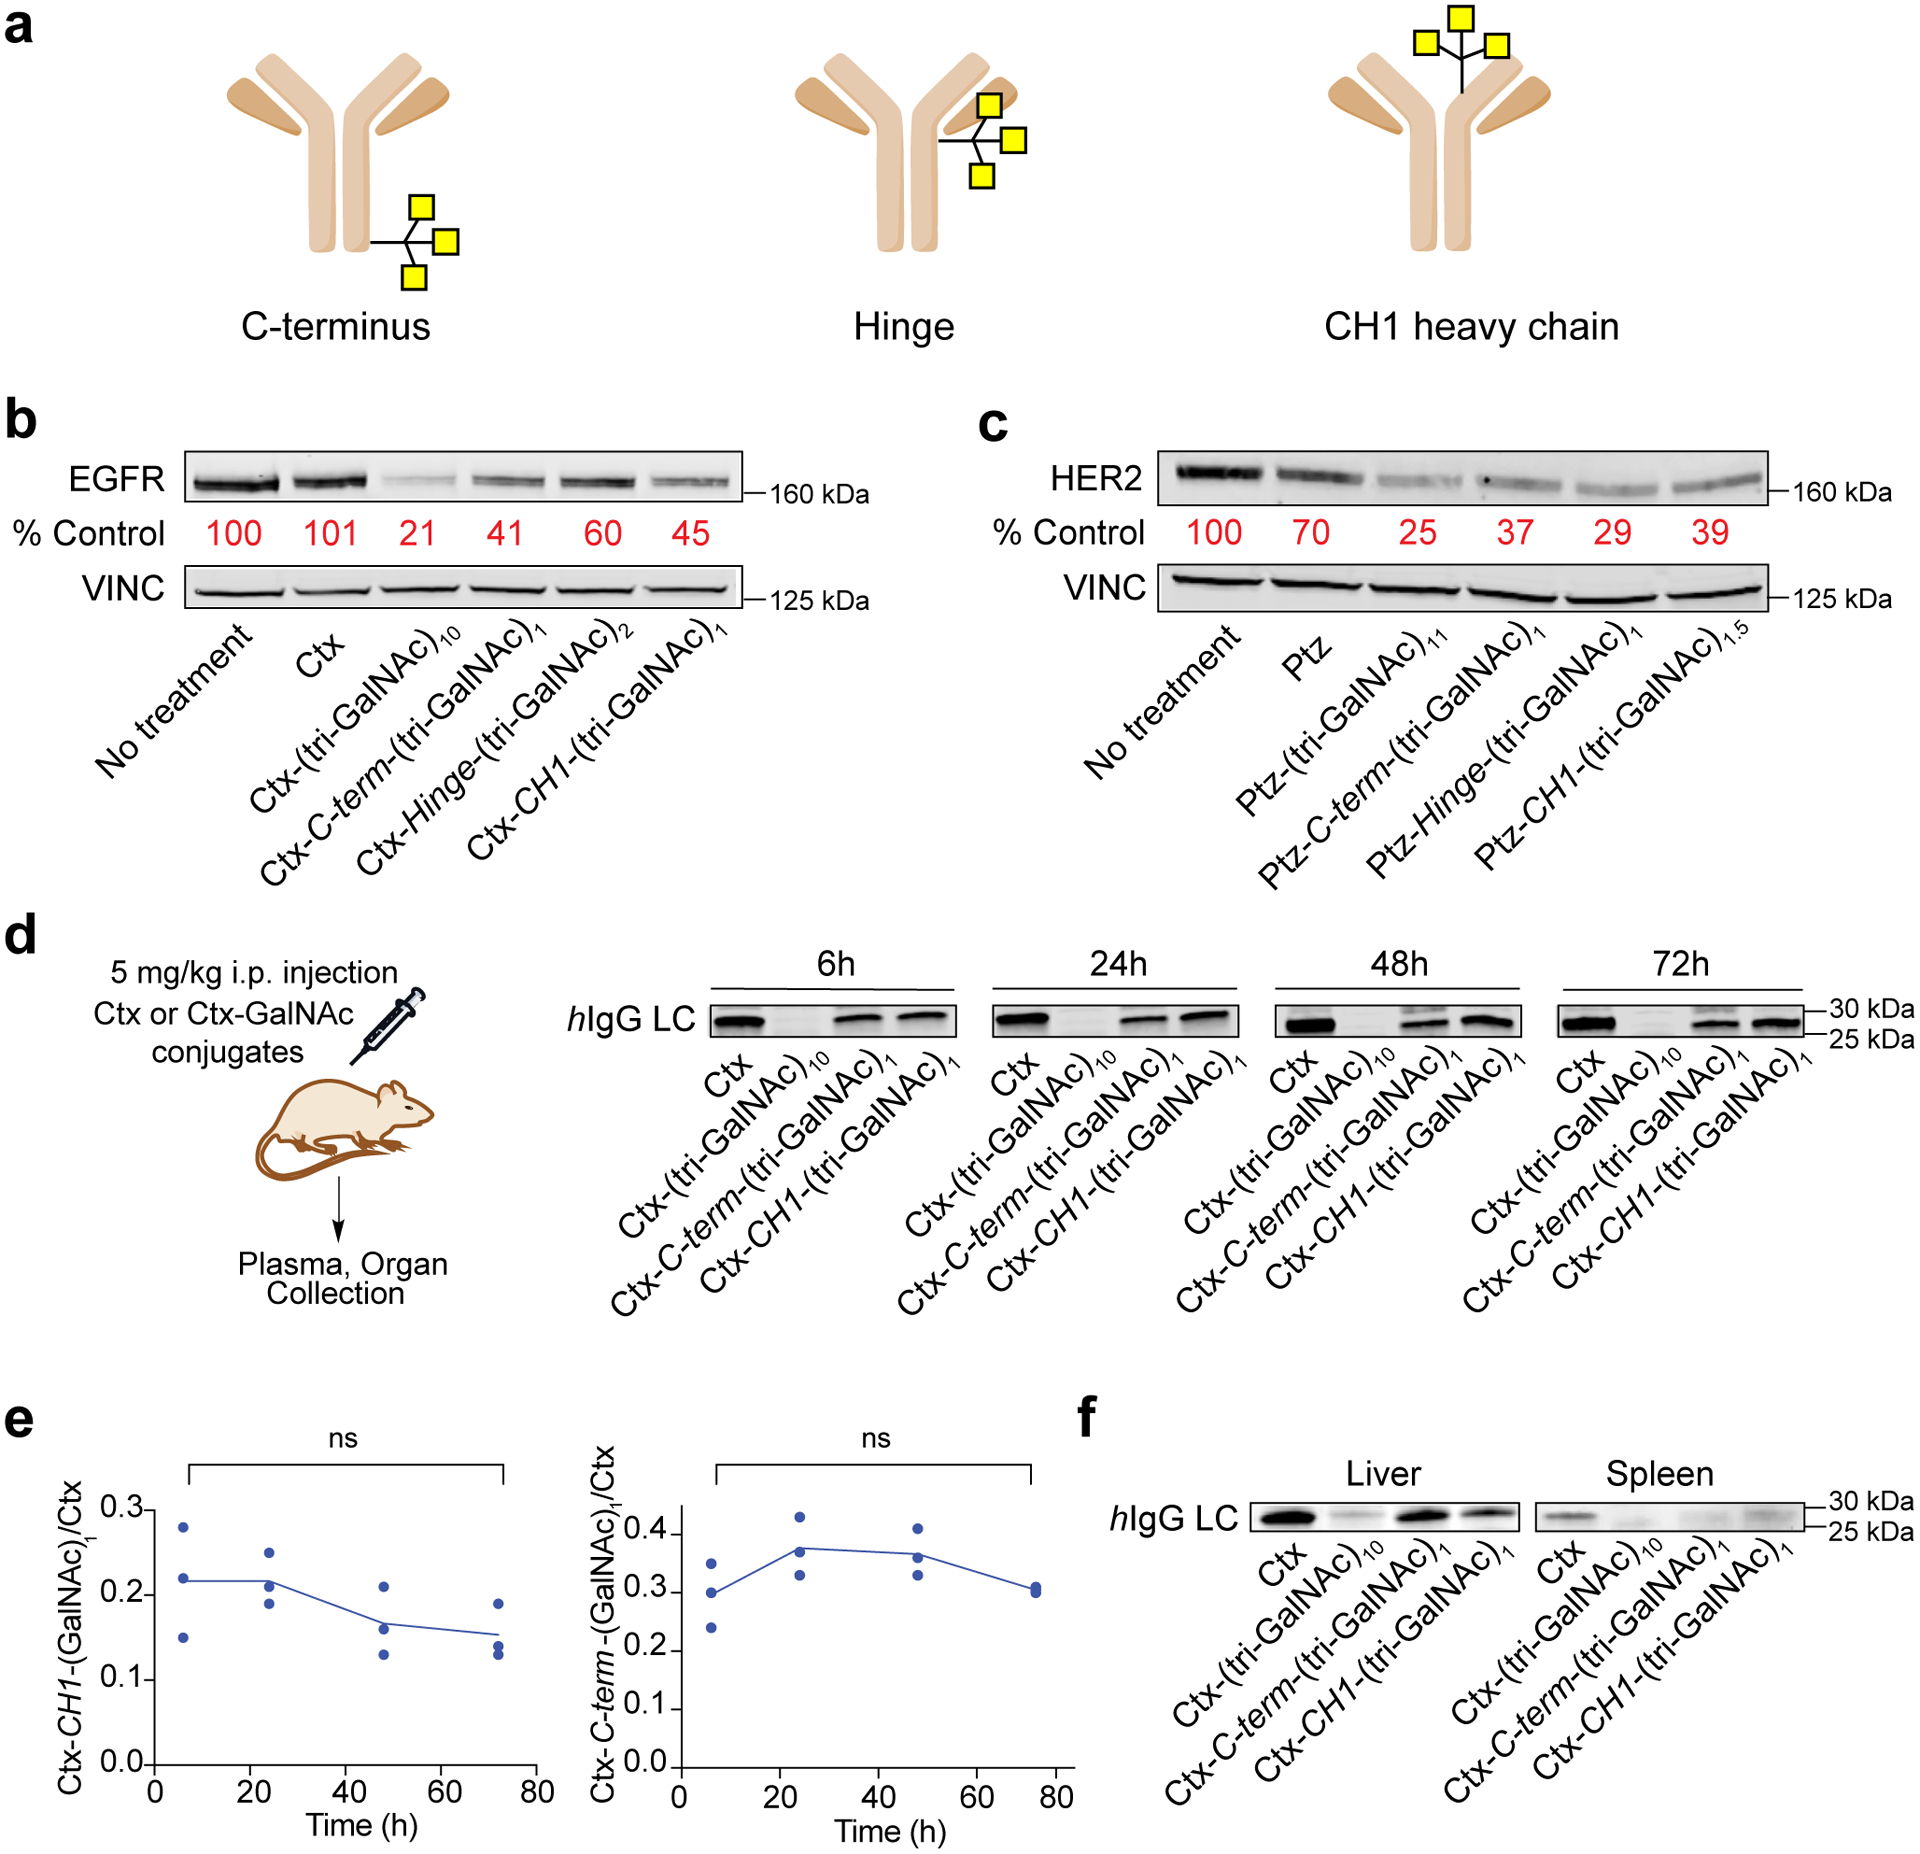
Selective protein degradation platforms have afforded new development opportunities for therapeutics and tools for biological inquiry. The first lysosome-targeting chimeras (LYTACs) targeted extracellular and membrane proteins for degradation by bridging a target protein to the cation-independent mannose-6-phosphate receptor (CI-M6PR). Here, we developed LYTACs that engage the asialoglycoprotein receptor (ASGPR), a liver-specific lysosome-targeting receptor, to degrade extracellular proteins in a cell-type-specific manner. We conjugated binders to a triantenerrary N-acetylgalactosamine (tri-GalNAc) motif that engages ASGPR to drive the downregulation of proteins. Degradation of epidermal growth factor receptor (EGFR) by GalNAc-LYTAC attenuated EGFR signaling compared to inhibition with an antibody. Furthermore, we demonstrated that a LYTAC consisting of a 3.4-kDa peptide binder linked to a tri-GalNAc ligand degrades integrins and reduces cancer cell proliferation. Degradation with a single tri-GalNAc ligand prompted site-specific conjugation on antibody scaffolds, which improved the pharmacokinetic profile of GalNAc-LYTACs in vivo. GalNAc-LYTACs thus represent an avenue for cell-type-restricted protein degradation.


Conflict of interest statement

Competing interests

Stanford University has filed patent applications relating to lysosome targeting chimeras which are licensed to Lycia Therapeutics, listing G.A., S.M.B., and C.R.B. as co-inventors. G.A., S.M.B., C.L.M., J.R.C., and C.R.B. are co-inventors on a patent application relating to PIP-LYTACs filed by Stanford University (docket number STAN-1780PRV). C.R.B. is a co-founder and Scientific Advisory Board member of Lycia Therapeutics, Palleon Pharmaceuticals, Enable Bioscience, Redwood Biosciences (a subsidiary of Catalent), and InterVenn Biosciences, and a member of the Board of Directors of Eli Lilly & Company. J.R.C. is a founder of xCella Biosciences and Combangio Inc. and co-founder and director of Trapeze Therapeutics.

Figures

Extended Data Fig. 1
Extended Data Fig. 1. HER2 degradation by Ptz-GalNAc is inhibited by exogenous tri-GalNAc ligand.
Degradation of HER2 in HEPG2 cells determined by live-cell flow cytometry following co-treatment with DMSO or 5 mM of exogenous tri-GalNAc ligand (10) and 10 nM Ptz conjugates for 48 h. Data are the mean of three independent experiments ± SEM. P values were determined by unpaired two-tailed t-tests.
Extended Data Fig. 2
Extended Data Fig. 2. Ptz-GalNAc internalizes membrane HER2 within 2 hours.
a, Visualization of HER2 in HEPG2 cells by confocal microscopy after 10 nM pertuzumab conjugate treatments for 2 h. EEA1 is included as an early endosomal marker. b, Visualization of HER2 in HEPG2 cells by confocal microscopy after 10 nM pertuzumab conjugate treatments for 48 h. EEA1 is included as an early endosomal marker. Images are representative of two independent experiments. Scale bar, 30 μm.
Extended Data Fig. 3
Extended Data Fig. 3. Ctx-GalNAcs show similar lysosomal health as untreated cells.
a, Visualization and quantification of Lysotracker by confocal microscopy imaging of HEP3B cells treated with 10 nM cetuximab conjugates for 48 h or 1 μM LLOMe for 1 hour. b, Visualization and quantification of Cathepsin B activity using Magic Red in HEP3B cells treated with 10 nM cetuximab conjugates for 48 h or 1 μM LLOMe for 1 h. c, Visualization and quantification of ALIX in HEP3B cells treated with 10 nM cetuximab conjugates for 48 h or 1 μM LLOMe for 1 h. Scale bar, 30 μm. Values are the average ± SEM of three separate images from confocal microscopy. P values were determined by unpaired two-tailed t-tests.
Extended Data Fig. 4
Extended Data Fig. 4. Ptz-GalNAcs do not affect lysosomal health.
a. Visualization and quantification of Cathepsin B activity using Magic Red in HEPG2 cells treated with 100 nM Ptz conjugates for 48 h or 1 μM LLOMe for 1 h. b, Visualization and quantification of ALIX in HEPG2 cells treated with 100 nM Ptz conjugates for 48 h or 1 μM LLOMe for 1 h. Scale bar, 30 μm. Values are the average ± SEM of three separate images from confocal microscopy. P values were determined by unpaired two-tailed t-tests.
Extended Data Fig. 5
Extended Data Fig. 5. PIP-GalNAc conjugate and ASGPR are required for enhanced anti-proliferative effect.
a, Time-course percent proliferation of HEPG2 cells during 44 h of treatment with 50 or 100 nM PIP or PIP-GalNAc. b, Percent proliferation of HEPG2 cells over 48 h with 100 nM exogenous tri-GalNAc, 100 nM PIP, 100 nM PIP + 100 nM exogenous tri-GalNAc, or 100 nM PIP-GalNAc conjugate. c, Percent proliferation of HEPG2 cells at 48h following co-incubation of 100 nM of PIP or PIP-GalNAc with or without 10 mg/ml asialofetuin (ASF). Data are three independent experiments in b. For c, values are the average of three independent experiments ± SEM. Ordinary two-way ANOVA with adjusted P values shown from Tukey’s multiple comparisons.
Extended Data Fig. 6
Extended Data Fig. 6. Analysis of site-specific conjugation of the tri-GalNAc ligand to three different locations on cetuximab
a, Reducing SDS-PAGE gel of Ctx and Ctx with aldehyde tag at C-terminus, Hinge, and CH1 Heavy chain. b, The proportion of signal seen between tri-GalNAc-modified (blue) peptides and peptides from the sequence that should have harbored the tri-GalNAc ligand but were seen unmodified (gray). Due to the dimer nature of the antibody, 50% of signal as modified indicates one site of modification per antibody molecule while 100% of signal as modified shows two ligands per antibody molecule. c, EThcD spectra of peptides showing site-specific localization of the tri-GalNAc ligand in the SMARTag sequence. Note, “M” represents the intact mass of the modified peptide, “GalNAc” shows the oxonium ion of a GalNAc residue, and the “M-GalNAc(x)” annotations show the intact mass minus × number of GalNAc moieties. a is a representative data from two independent experiments.
Extended Data Fig. 7
Extended Data Fig. 7. Analysis of site-specific conjugation of the tri-GalNAc ligand to three different locations on pertuzumab.
a, Reducing SDS-PAGE gel of Ptz with aldehyde tag at C-terminus, Hinge, and CH1 Heavy chain.b, The proportion of signal seen between tri-GalNAc-modified (blue) peptides and peptides from the sequence that should have harbored the tri-GalNAc ligand but were seen unmodified (gray). Due to the dimer nature of the antibody, 50% of signal as modified indicates one site of modification per antibody molecule while 100% of signal as modified shows two ligands per antibody molecule. c, EThcD spectra of peptides showing site-specific localization of the tri-GalNAc ligand in the SMARTag sequence. Note, “M” represents the intact mass of the modified peptide, “GalNAc” shows the oxonium ion of a GalNAc residue, and the “M-GalNAc(x)” annotations show the intact mass minus × number of GalNAc moieties. a is a representative data from two independent experiments.
Extended Data Fig. 8
Extended Data Fig. 8. Non-specific Ctx-GalNAc conjugates show enhanced uptake in vitro compared to site-specific Ctx conjugates.
a, Binding of Ctx conjugates in HEPG2 cells measured by live-cell flow cytometry following 1 h incubation on ice. b, Mean fluorescence intensity (MFI) relative to the control (human IgG-647 only) for HEPG2 cells incubated at 37 °C for 1 h with 50 nM human IgG-647 and 25 nM Ctx, Ctx-(tri-GalNAc)10, Ctx-C-term-(tri-GalNAc)1, or Ctx-CH1-(tri-GalNAc)1. MFI was determined by live cell flow cytometry. Values are the average ± SEM of three independent experiments. P values were determined by unpaired two-tailed t-tests.
Extended Data Fig. 9
Extended Data Fig. 9. Durability of LYTAC-mediated degradation in HEP3B cells.
a, HEP3B cells were treated with 10 nM Ctx conjugates, then washed with PBS 3 times, and were incubated in fresh media for 6, 24, 48h. EGFR levels were measured by western blot. 100 ng/ml of EGF was included as a control. b, Quantification of EGFR levels with and without wash-off following treatment with Ctx conjugates. Values are the average of three independent experiments ± SEM. P values were determined by unpaired two-tailed t-tests.
Extended Data Fig. 10
Extended Data Fig. 10. GalNAc-LYTACs do not cause hepatic toxicity in mice.
a, Balb/c mice were intraperitoneally injected with 5 mg/kg of Ctx or Ctx-(tri-GalNAc)10 every 2 days or 5 mg/kg Ctx or Ctx-C-term-(tri-GalNAc)1 every 4 days for a week. Plasma and liver were harvested on day 8, and levels of liver enzymes (b – alanine transaminase (ALT); c – aspartate transaminase (AST), d, alkaline phosphatase (ALP), e – total bilirubin) from plasma were measured. Values in b-e are the average of three independent mice ± SEM and were evaluated using Ordinary one-way ANOVA with Tukey’s multiple comparisons. f, Representative H&E staining of the liver from three independent experiments. Scale bar, 40 μm.
Fig. 1.
Fig. 1.. LYTACs can hijack the asialoglycoprotein receptor (ASPGR) for targeted and cell-specific protein degradation.
a, First-generation LYTACs co-opt the broadly expressed cation independent mannose 6-phosphate receptor (CI-M6PR). b, GalNAc-LYTACs hijack the liver-specific ASGPR to target hepatocytes specifically. c, Structure of tri-GalNAc-DBCO (1) ligand for ASGPR-targeting. d, Synthesis of antibody-tri-GalNAc conjugates (GalNAc-LYTACs). Native gel electrophoresis of IgG, IgG-N3, and IgG-GalNAc. e, LYTAC-mediated internalization of rabbit IgG-647 in HEPG2 cells. f, Mean fluorescence intensity (MFI) relative to the control (rabbit IgG-647 only) for HEPG2 cells incubated at 37 °C for 1 h with 50 nM rabbit IgG-647 and 25 nM goat-anti-rabbit, goat-anti-rabbit-M6Pn, or goat-anti-rabbit-GalNAc. MFI was determined by live cell flow cytometry. g, Live-cell imaging of HEPG2 cells that were incubated at 37 °C for 1 h with 50 nM rabbit IgG-647 and 25 nM goat-anti-rabbit, goat-anti-rabbit-M6Pn, or goat-anti-rabbit-GalNAc. Scale bar, 20 μm. For d, g, gels and images are representative of two independent experiments. For f, data are the mean of three independent experiments ± SEM. P values were determined by unpaired two-tailed t-tests.
Fig. 2.
Fig. 2.. GalNAc-LYTACs promote degradation of epidermal growth factor receptor (EGFR) in HCC cell lines.
a, EGFR degradation mediated by Cetuximab (Ctx)-GalNAc. b, Degradation of cell surface EGFR in HEP3B determined by live cell flow cytometry following 48 h of treatment with 10 nM Ctx or conjugates. c, Western blot analysis of total EGFR levels in HEP3B, HEPG2, and HUH7 after treat with 10 nM Ctx conjugates for 48 h. d, Dose-response curve for cell surface EGFR degradation in HEP3B incubated with 1 nM, 10 nM, 50 nM, 100 nM Ctx conjugates for 48 h. Relative surface expression of EGFR is determined by live cell flow cytometry. e, Time-course of degradation of cell surface EGFR in HEP3B incubated with 10 nM Ctx conjugates for 3, 6, 24, and 48 h. Relative surface expression of EGFR is determined by live cell flow cytometry. f, Visualization of EGFR degradation in HEP3B cells by confocal microscopy after 10 nM Ctx conjugate treatments for 48 h. Scale bar, 30 μm. For b-e, data are three independent experiments and mean ± SEM for b,c. Images in f are representative of two independent experiments. P values were determined by unpaired two-tailed t-tests. NS, not significant.
Fig 3.
Fig 3.. GalNAc-LYTACs operate via an endo-lysosomal mechanism and attenuate EGFR-driven signaling.
a, Western blot of EGFR in HEP3B cells treated with 10 nM Ctx conjugates for 48 h following knockdown of ASGPR by siRNA. Non-targeting siRNA is included as a control. b, Degradation of EGFR in HEP3B cells determined by live-cell flow cytometry following co-treatment with DMSO or 5 mM of exogenous tri-GalNAc ligand (10) and 10 nM Ctx conjugates for 24 h. c, Western blot of EGFR degradation in HEP3B cells incubated with 10 nM Ctx conjugates and 50 nM bafilomycin A1 or 10 μM chloroquine for 24 h. d, Western blot of pEGFR, pAkt, and pMAPK in HEP3B cells following incubation of 10 nM Ctx conjugates for 48 h then 1 h stimulation with 100 ng/ml or 50 ng/ml of EGF. a, c are representative of two independent experiments. For b, data are the mean of three independent experiments ± SEM. P values were determined by unpaired two-tailed t-tests. d is a representative of three independent experiments.
Fig 4.
Fig 4.. Ctx-GalNAc mediates selective degradation of EGFR in ASGPR expressing cells.
a, HEP3B (ASGPR+, EGFR+, M6PR+) and HeLa-GFP (ASGPR-, EGFR+, M6PR+) were co-cultured and treated with Ctx conjugates. Ctx-GalNAc degrades EGFR selectively in HEP3B cells. b, Representative flow cytometry plot of cell-surface EGFR levels in HEP3B cells and HeLa-GFP cells following co-culture and treatment with 50 nM cetuximab or conjugates for 48 h. c, Quantification of relative surface expression of EGFR in b determined by live cell flow cytometry. b is a representative of three independent experiments. For c, data are the mean of three independent experiments ± SEM. P values were determined by unpaired two-tailed t-tests.
Fig. 5.
Fig. 5.. GalNAc-LYTAC degrades the membrane proteins HER2 and integrins and induces anti-proliferative effects in HEPG2 cells.
a, Western blot of HER2 degradation in HEPG2 cells following incubation with 100 nM Pertuzumab (Ptz) or Ptz conjugates for 48 h. b, Visualization of HER2 degradation in HEPG2 cells by confocal microscopy after 100 nM Ptz conjugate treatments for 48 h. Scale bar, 30 μm. c, Synthesis of PIP-GalNAc. Tri-GalNAc-DBCO was conjugated to PIP, a knottin peptide that binds to multiple integrins. d, Degradation of cell surface integrins in HEPG2 determined by live cell flow cytometry following 44 h of treatment with 100 nM PIP or PIP-GalNAc using anti-αvβ3, anti-αvβ5, and PIP-Fc fusion for detection. PIP was genetically fused to the Fc domain of a mouse IgG2a to generate a PIP-Fc fusion construct that measures the surface expression of integrins recognized by PIP. e, Percent proliferation of HEPG2 cells following 44 h of treatment with 50, 100, and 200 nM PIP or PIP-GalNAc. Proliferation was quantified by phase confluence over time on IncuCyte. f, Time-course percent proliferation of HEPG2 cells during 44 h of treatment with 200 nM PIP or PIP-GalNAc. g, Percent proliferation of HEPG2 cells for 6 days following wash-out. Cells were treated with 200 nM PIP or PIP-GalNAc on day 0. PIP+ and PIP-GalNAc+ indicate the conditions where cells were washed on day 4 and replaced with fresh media without treatment. PIP++ and PIP-GalNAc++ indicate the conditions where cells were washed on day 4 and replaced with fresh media containing 200 nM PIP or PIP-GalNAc. h, Live HEPG2 imaging by IncuCyte throughout 5 days after treatment with 100 nM PIP or PIP-GalNAc. a is a representative of three independent experiments. Images are representative of two independent experiments for b and three independent experiments for h. d-g represent three independent experiments, where d,e show the mean of three independent experiments ± SEM. P values were determined by unpaired two-tailed t-tests.
Fig. 6.
Fig. 6.. Site-specific conjugation improves pharmacokinetics of antibody-based GalNAc-LYTACs.
a, Site-specific conjugation of antibody at the CH1 domain, hinge, and C-terminus of the antibody using the SMARTag technology. b, Western blot of EGFR degradation in HEP3B after treatments with 10 nM site-specific cetuximab conjugates for 48 h. c, Western blot of HER2 degradation in HEPG2 cells after treatments with 100 nM site specific pertuzumab conjugates for 48h. d, In vivo pharmacokinetic study of GalNAc LYTACs. Representative human-IgG light chain western blot of plasma following 5 mg/kg intraperitoneal injection of Ctx, Ctx-(tri-GalNAc)10, Ctx-CH1-(tri-GalNAc)1, Ctx-C-term-(tri-GalNAc)1. Plasma was collected 6, 24, 48, and 72 h post injection. e, Quantification of d representing the ratio of site specific Ctx conjugates over unmodified Ctx. Values are the average of three separate mice ± SEM. f, Representative human-IgG light chain blot of liver and spleen 72 h after Ctx and Ctx conjugate injections. For b-d, f, data are representative of three independent experiments. For e, data are the mean of three independent experiments ± SEM. P values were determined by unpaired two-tailed t-tests.

Comment in

  • Lysosome-targeting chimeras evolve.
    Paulk J. Paulk J. Nat Chem Biol. 2021 Sep;17(9):931-933. doi: 10.1038/s41589-021-00835-1. Nat Chem Biol. 2021. PMID: 34413526 No abstract available.

References

    1. Krönke J, Udeshi ND, Narla A, Grauman P, Hurst SN, McConkey M, Svinkina T, Heckl D, Comer E, Li X, Ciarlo C, Hartman E, Munshi N, Schenone M, Schreiber SL, Carr SA & Ebert BL Lenalidomide Causes Selective Degradation of IKZF1 and IKZF3 in Multiple Myeloma Cells. Science 343, 301–305 (2014). - PMC - PubMed
    1. Lu G, Middleton RE, Sun H, Naniong M, Ott CJ, Mitsiades CS, Wong K-K, Bradner JE & Kaelin WG The Myeloma Drug Lenalidomide Promotes the Cereblon-Dependent Destruction of Ikaros Proteins. Science 343, 305–309 (2014). - PMC - PubMed
    1. Sakamoto KM, Kim KB, Kumagai A, Mercurio F, Crews CM & Deshaies RJ Protacs: Chimeric molecules that target proteins to the Skp1-Cullin-F box complex for ubiquitination and degradation. Proc. Natl. Acad. Sci 98, 8554–8559 (2001). - PMC - PubMed
    1. Winter GE, Buckley DL, Paulk J, Roberts JM, Souza A, Dhe-Paganon S & Bradner JE Phthalimide conjugation as a strategy for in vivo target protein degradation. Science 348, 1376–1381 (2015). - PMC - PubMed
    1. Nabet B, Roberts JM, Buckley DL, Paulk J, Dastjerdi S, Yang A, Leggett AL, Erb MA, Lawlor MA, Souza A, Scott TG, Vittori S, Perry JA, Qi J, Winter GE, Wong K-K, Gray NS & Bradner JE The dTAG system for immediate and target-specific protein degradation. Nat. Chem. Biol 14, 431–441 (2018). - PMC - PubMed

Publication types

MeSH terms

Substances