. 2021 May;27(5):892-903.
doi: 10.1038/s41591-021-01296-8. Epub 2021 Mar 25.

SARS-CoV-2 infection of the oral cavity and saliva

Collaborators, Affiliations

SARS-CoV-2 infection of the oral cavity and saliva

Ni Huang et al. Nat Med. 2021 May.

Abstract

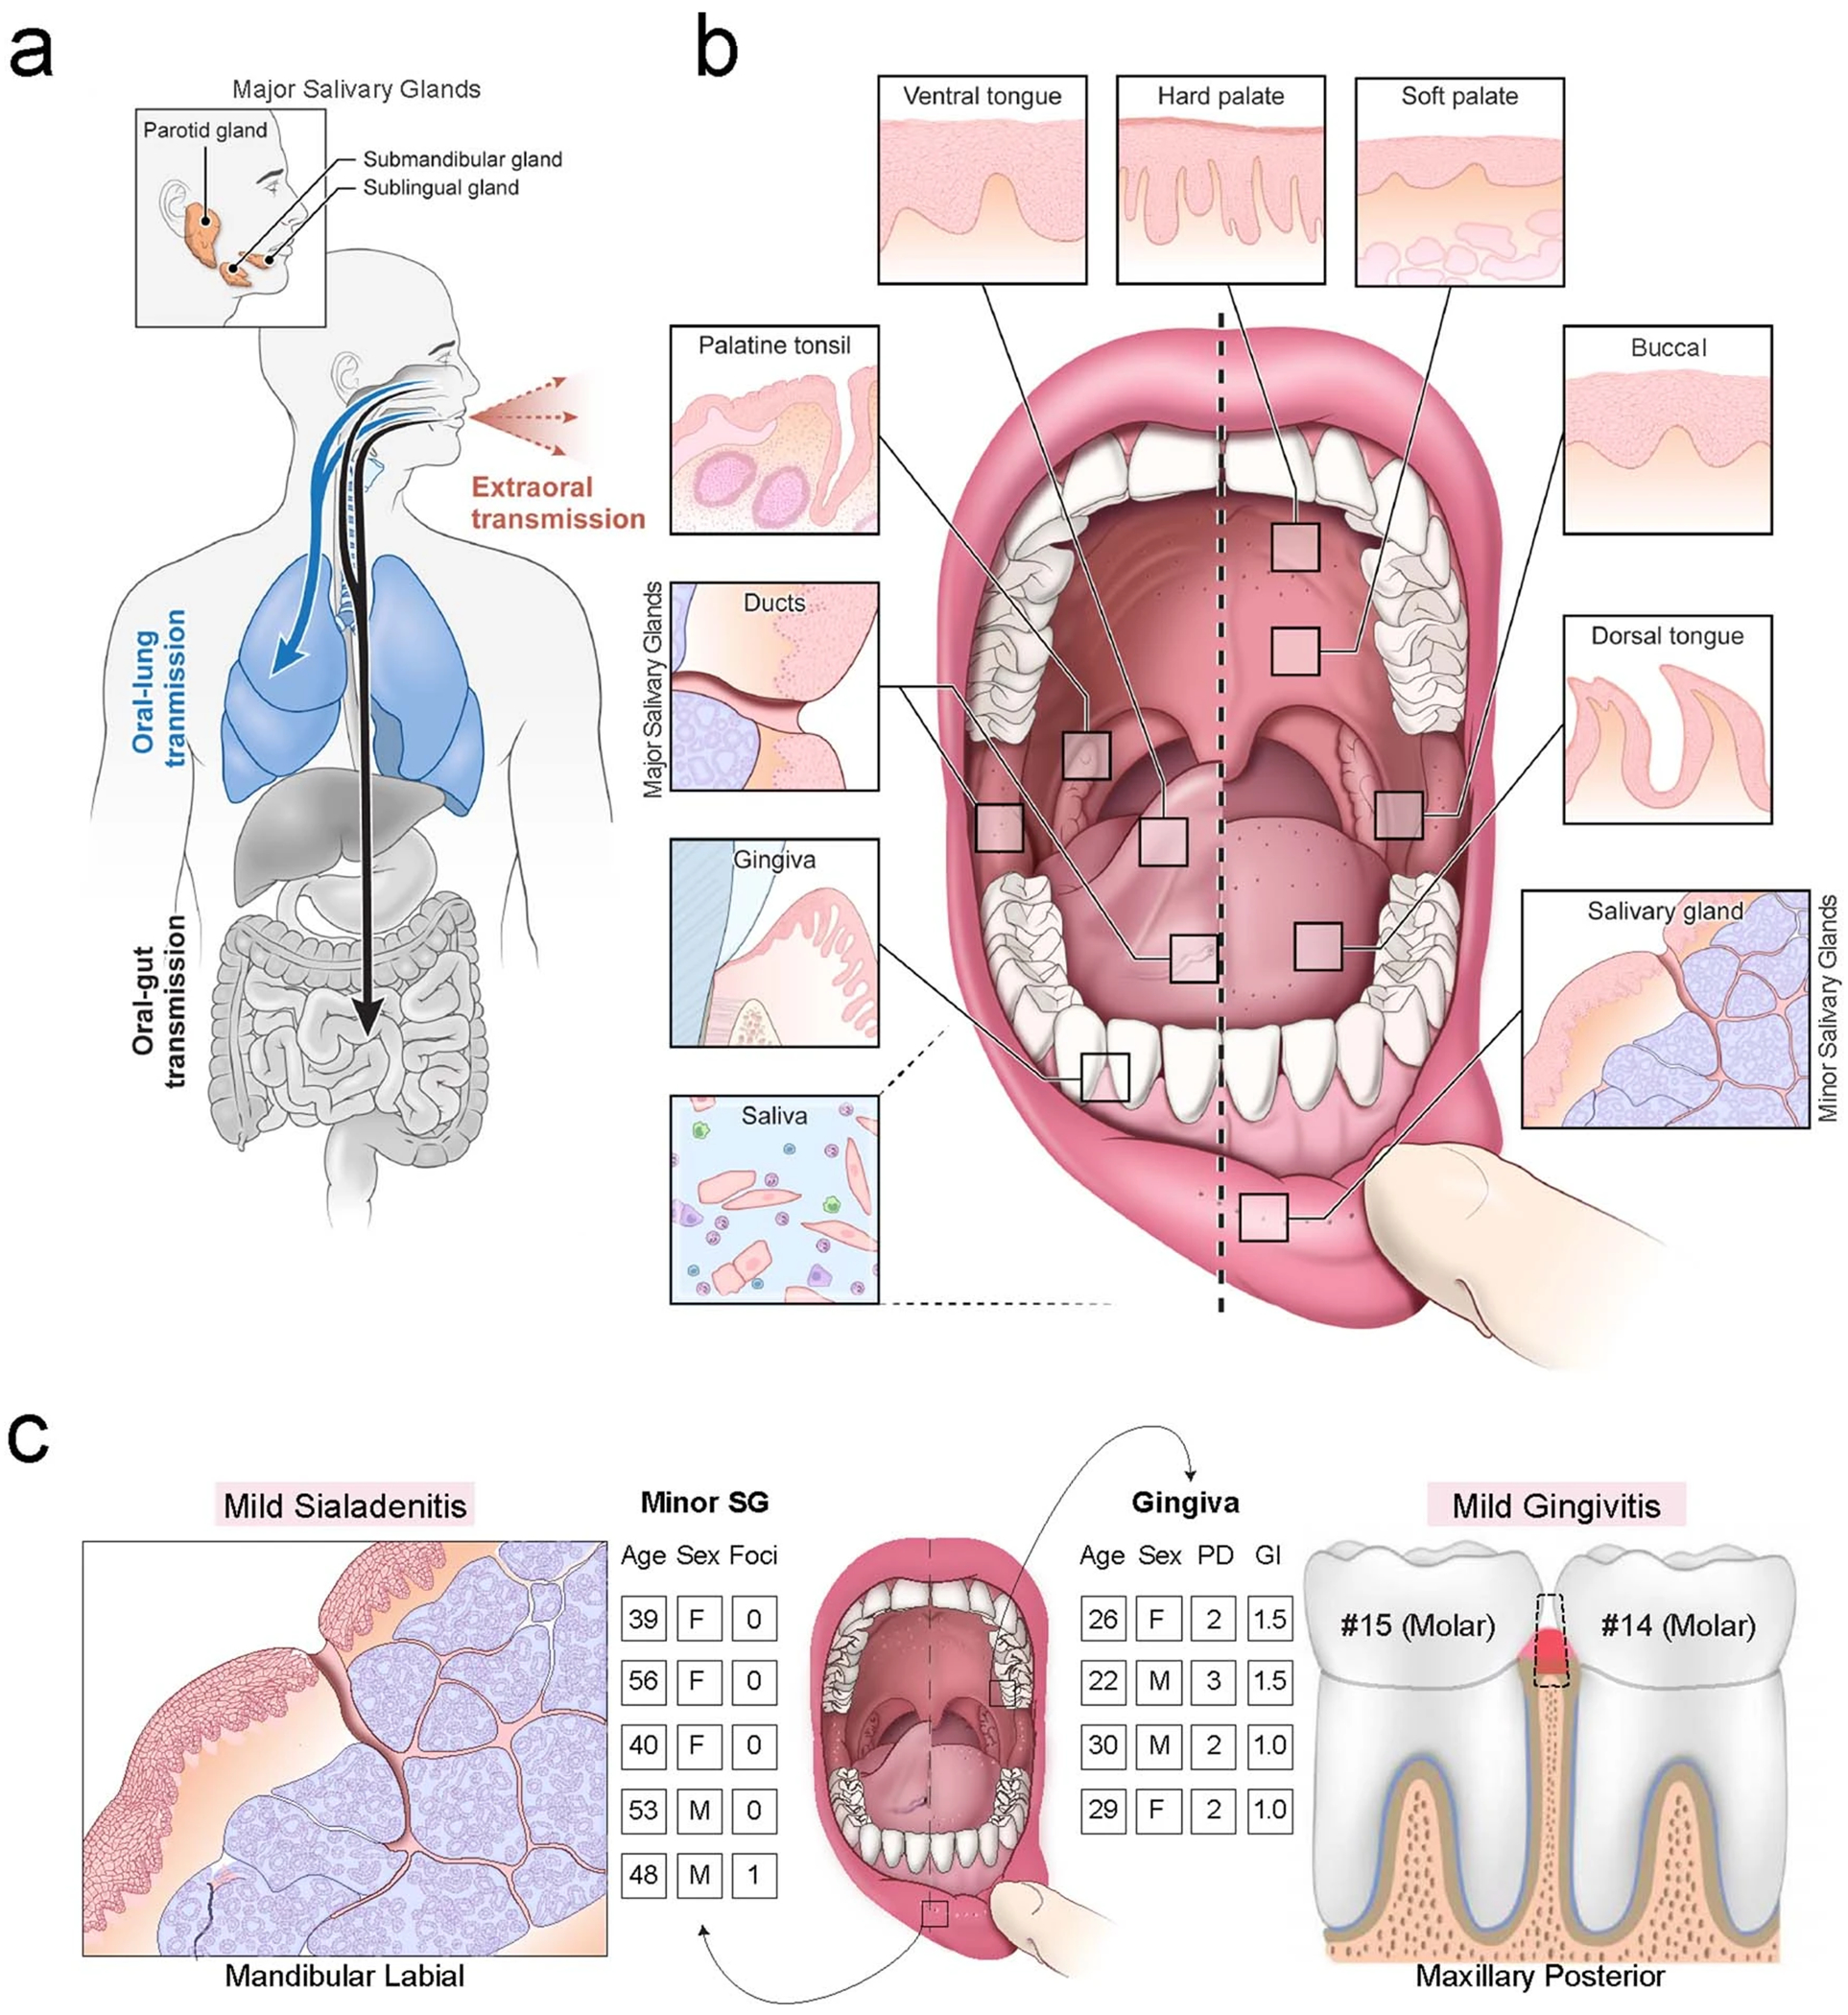
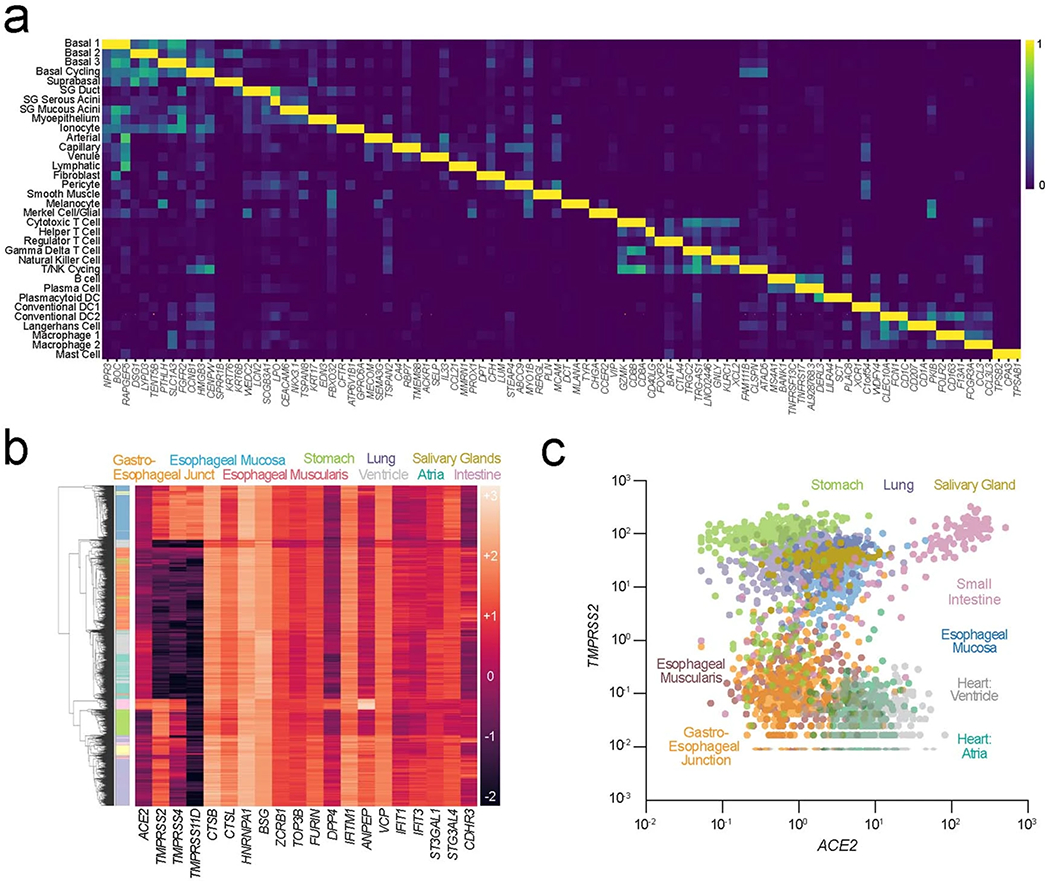
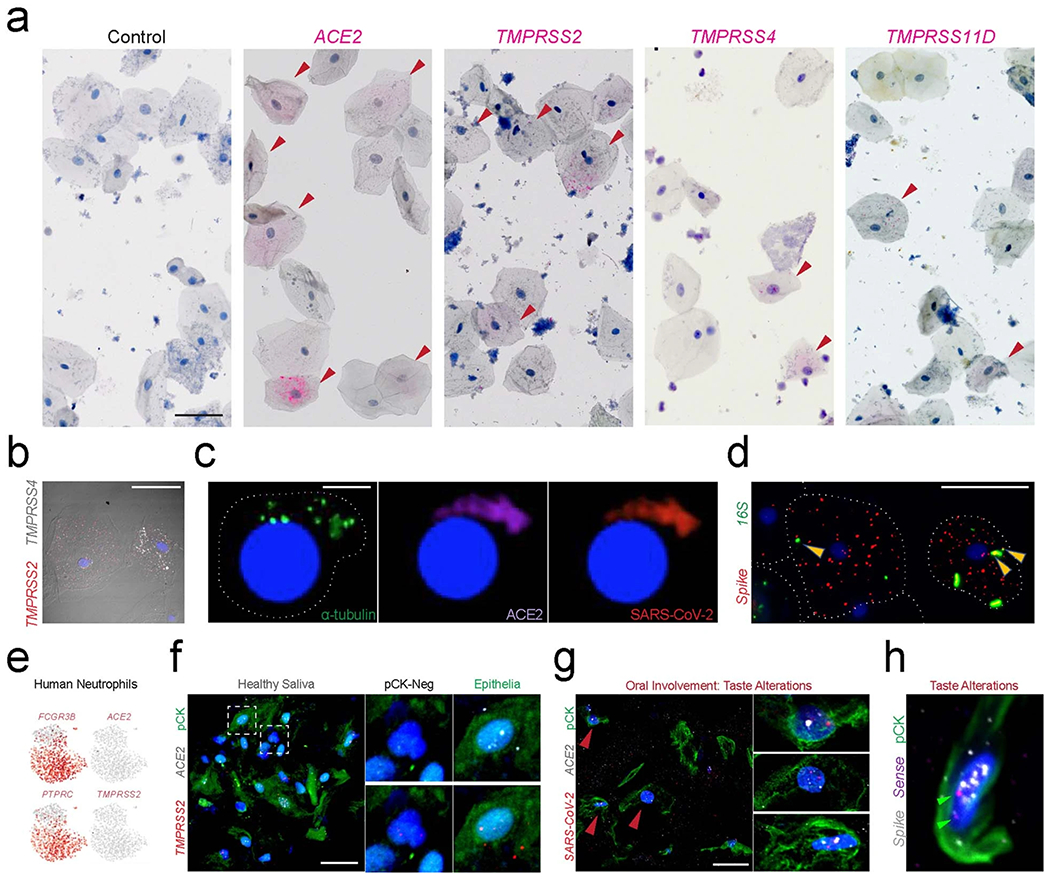
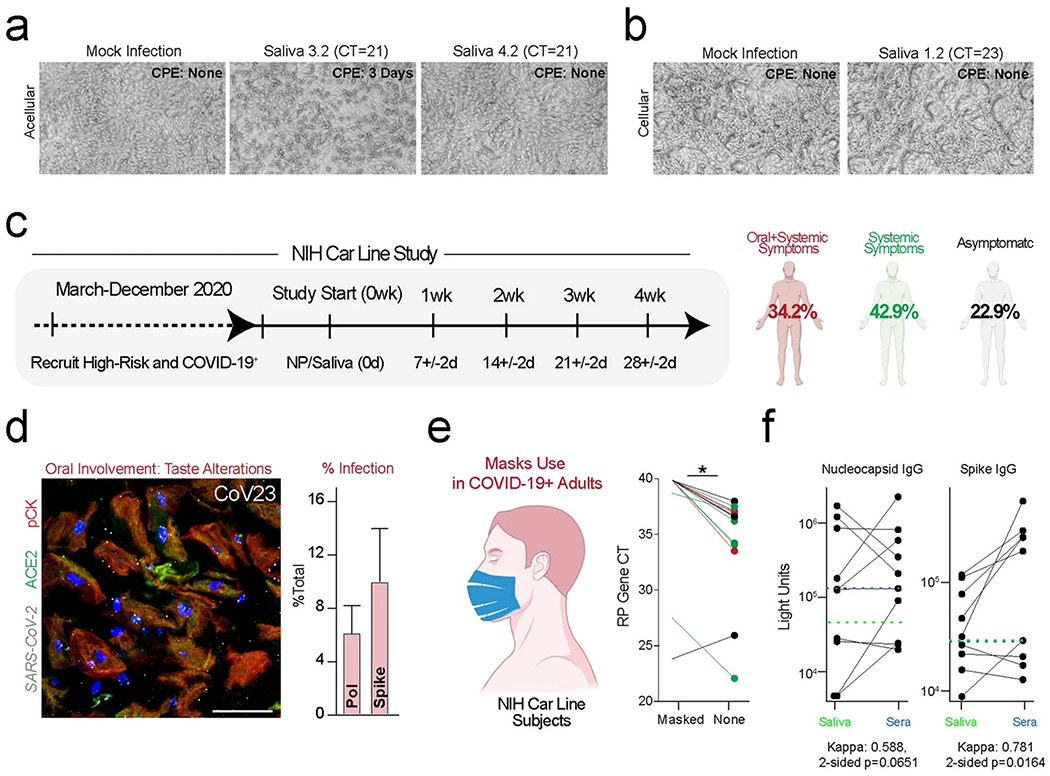
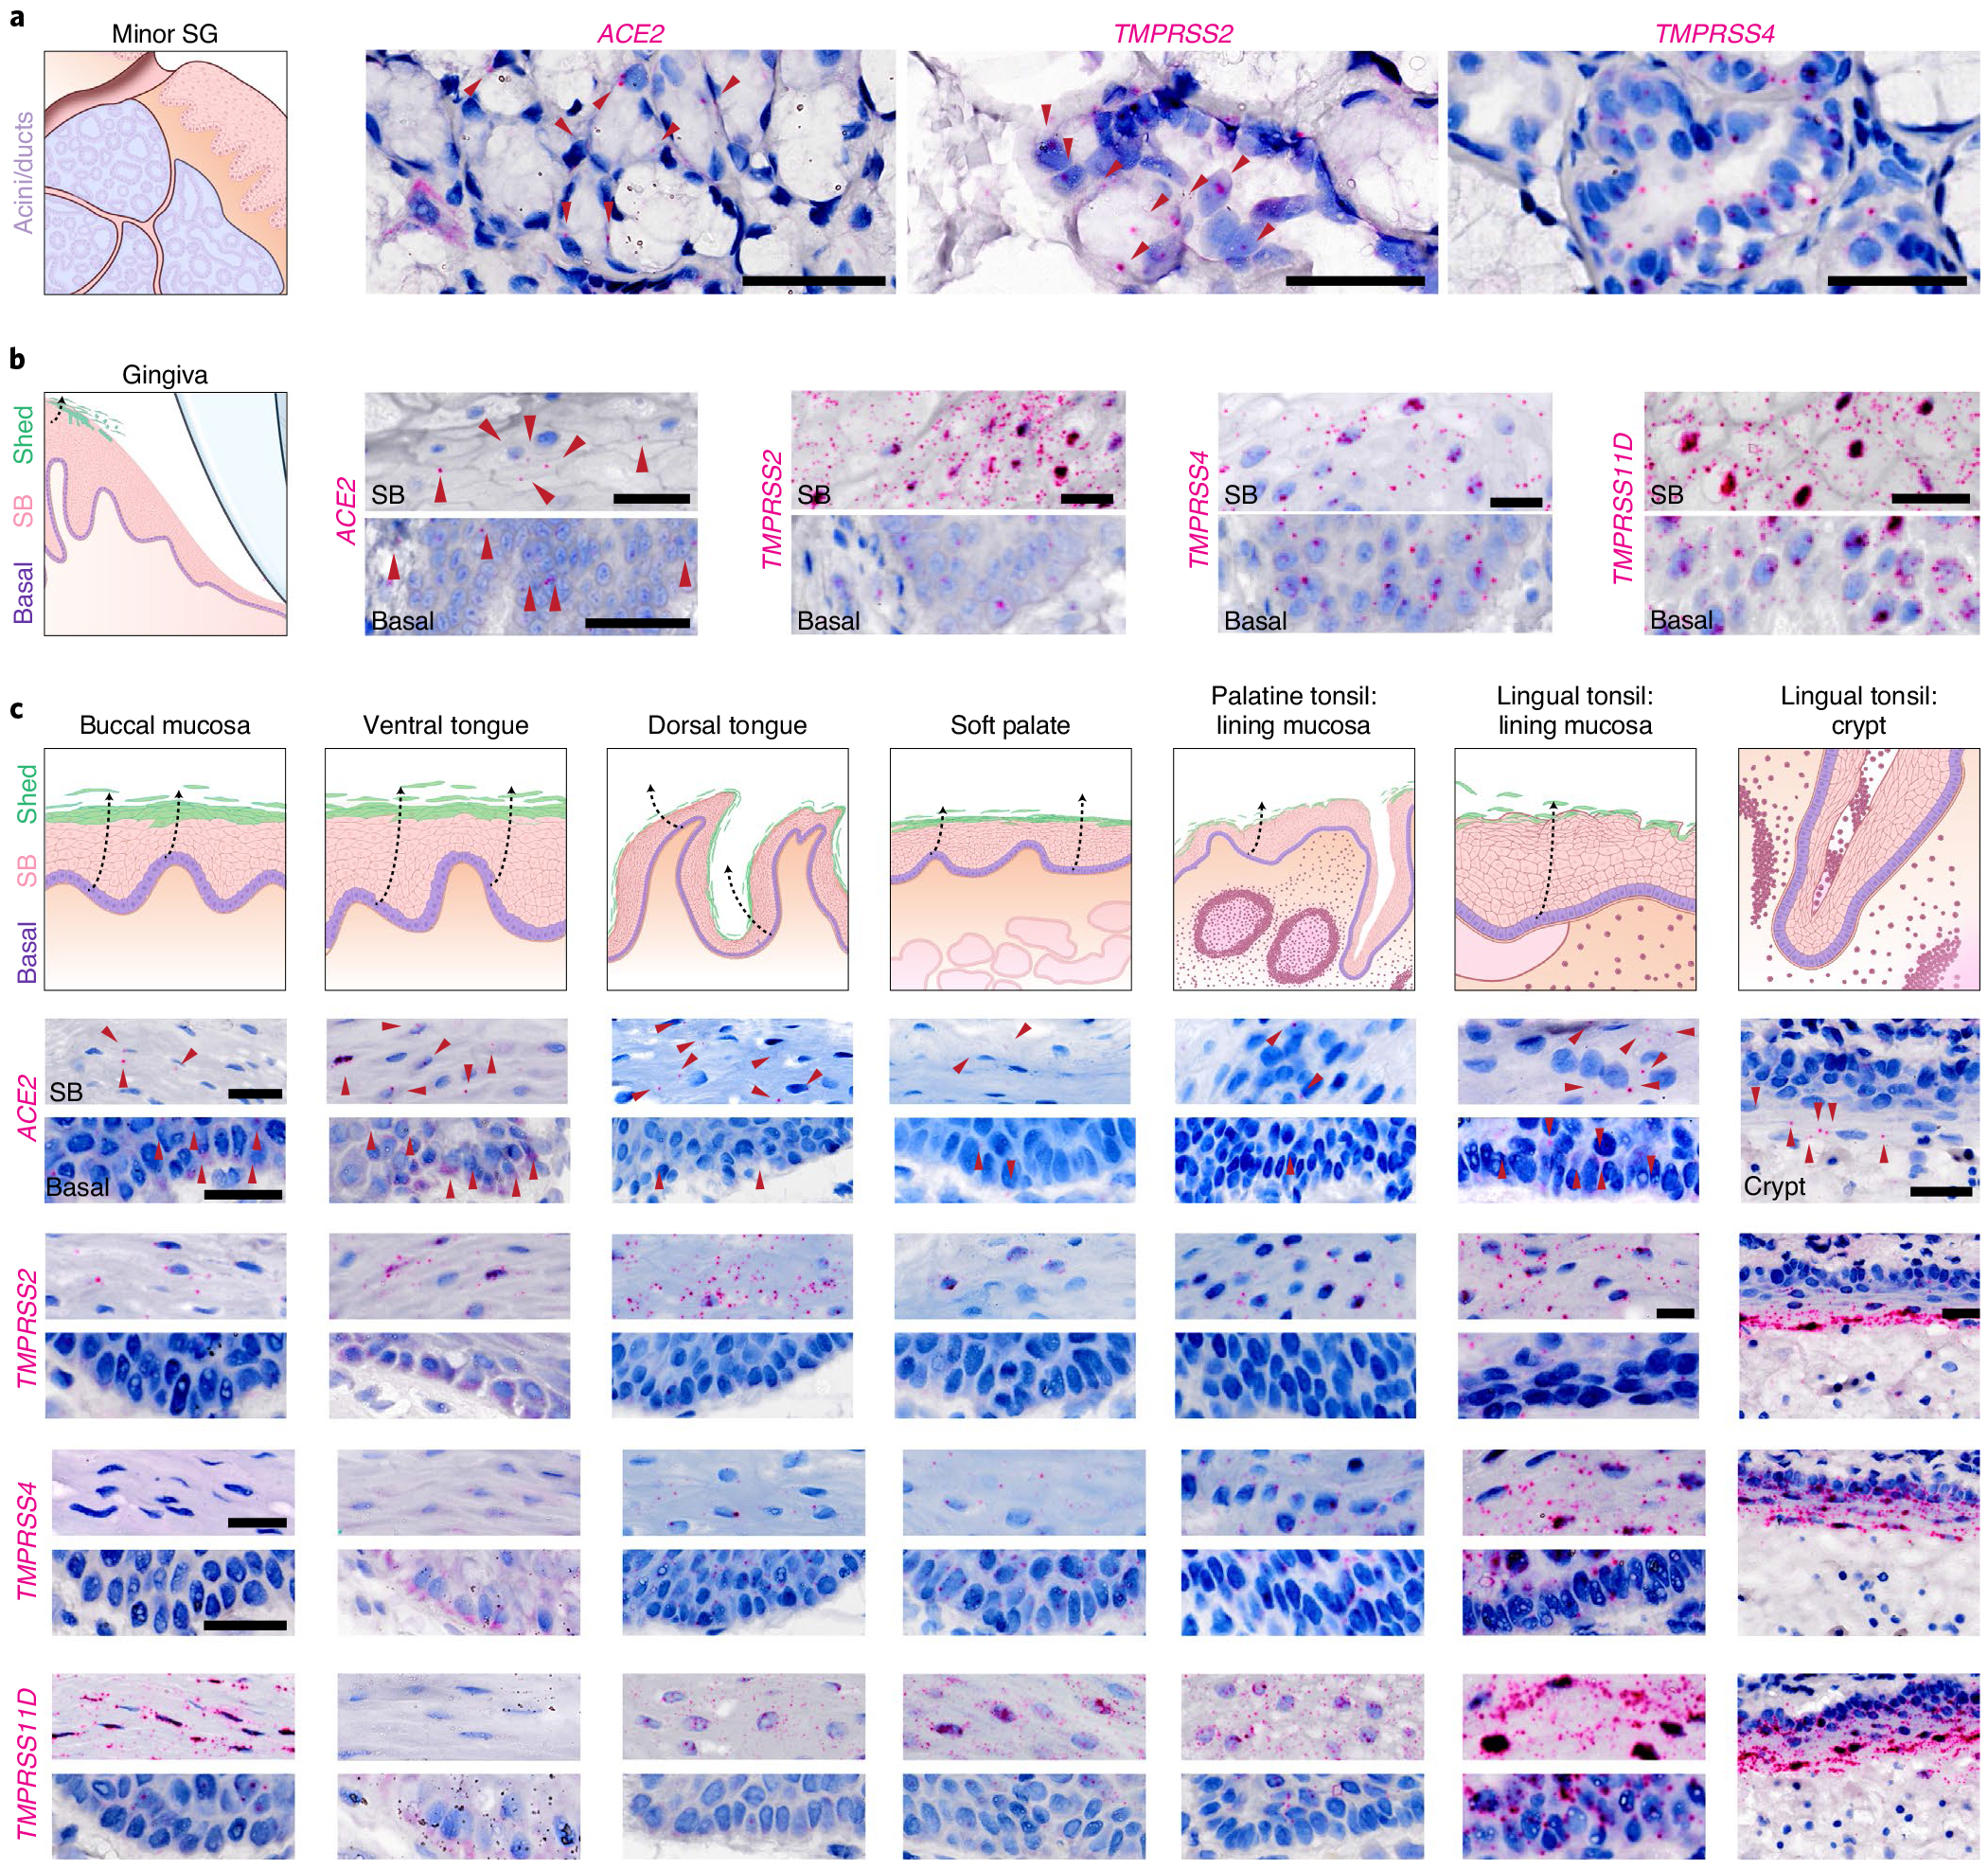
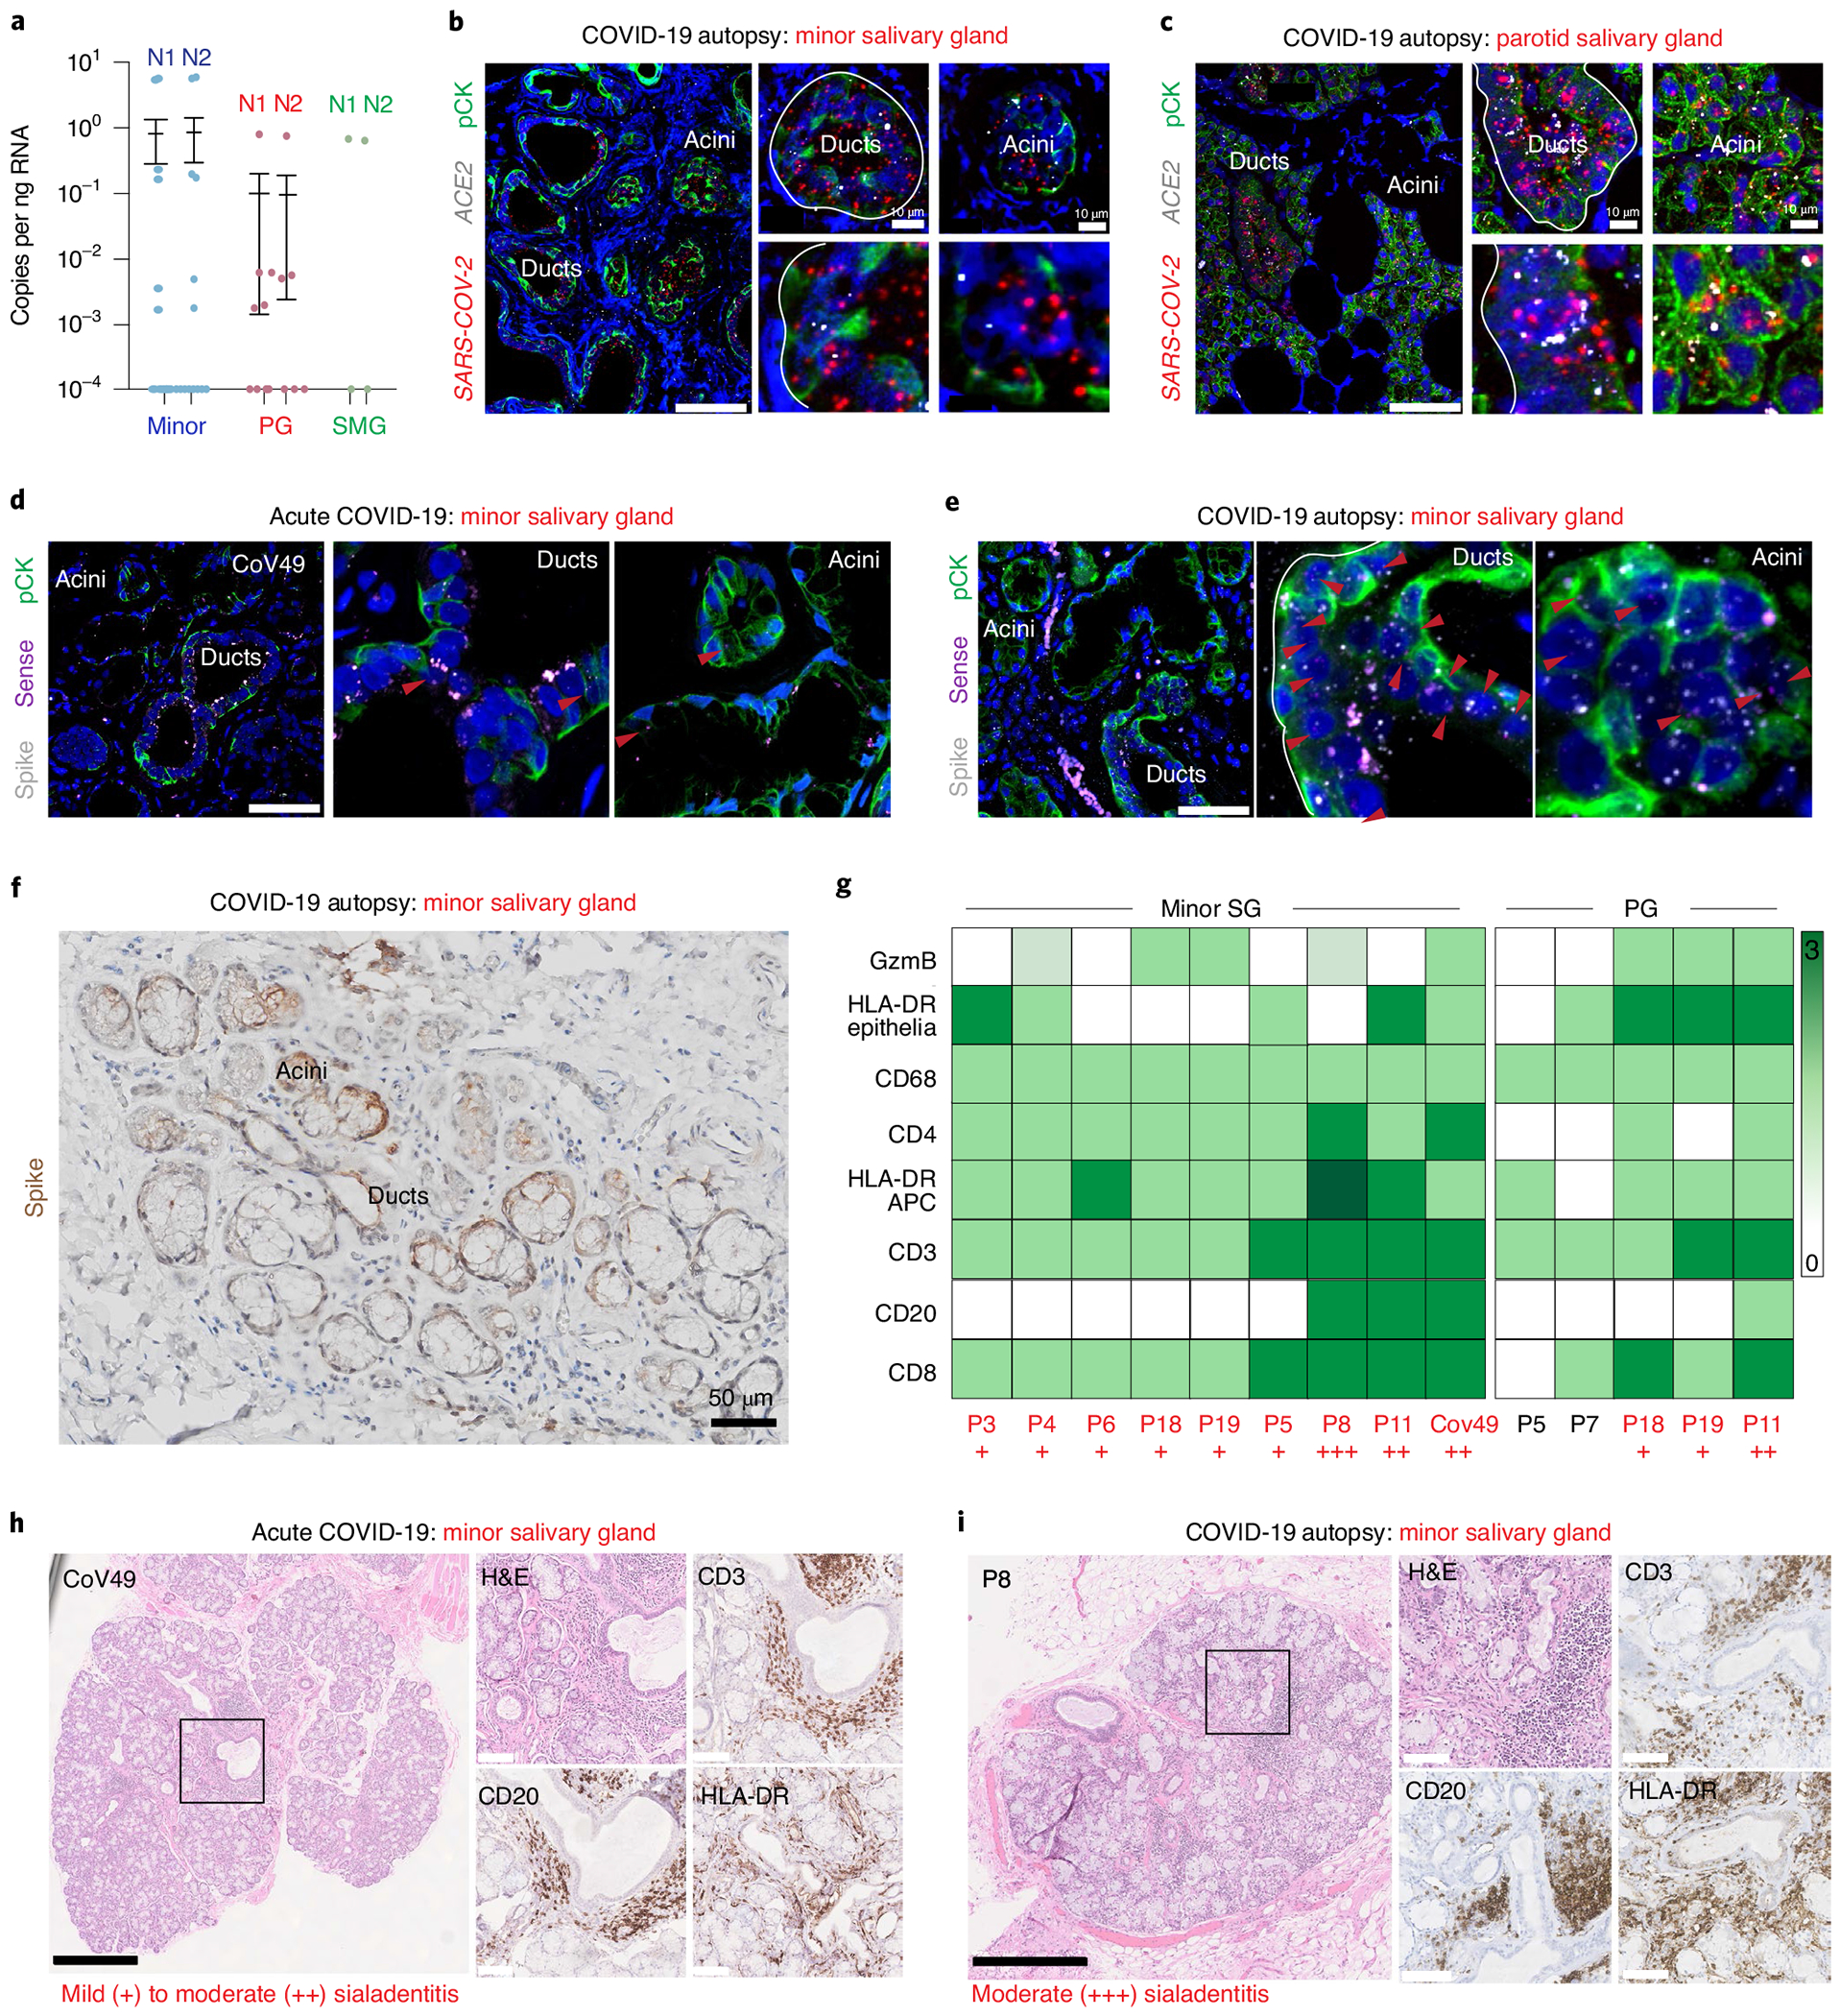
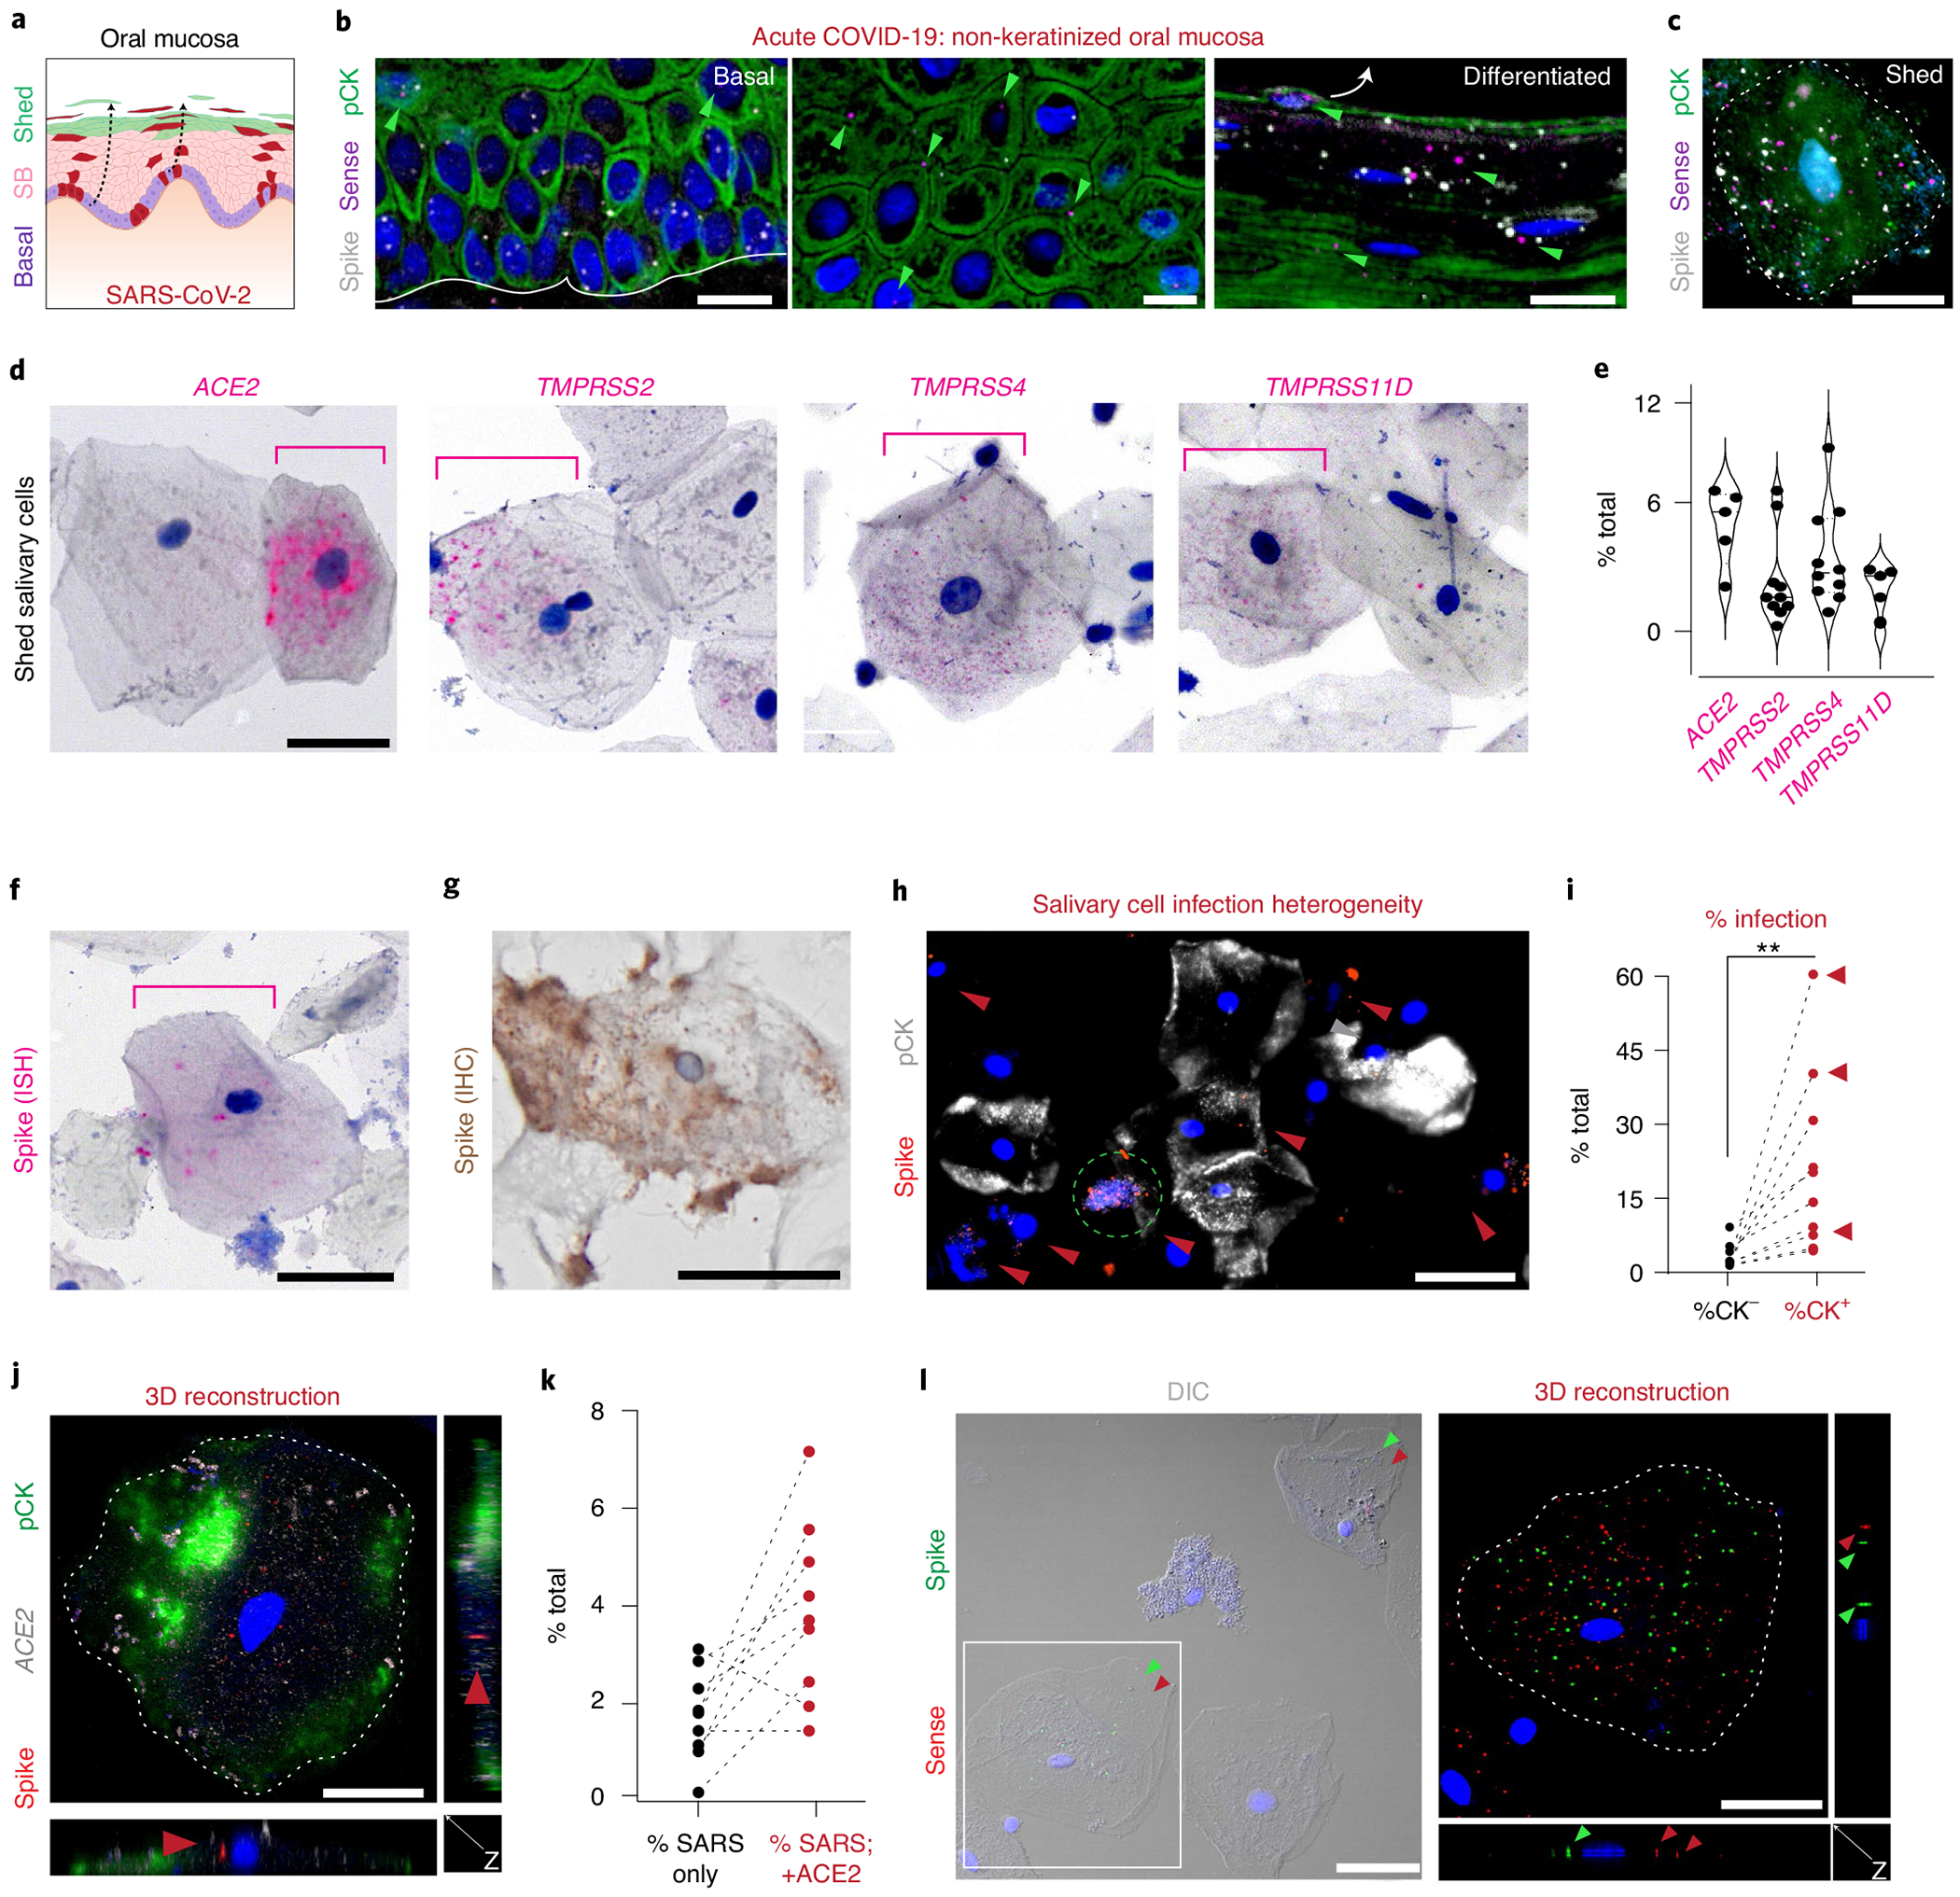
Despite signs of infection-including taste loss, dry mouth and mucosal lesions such as ulcerations, enanthema and macules-the involvement of the oral cavity in coronavirus disease 2019 (COVID-19) is poorly understood. To address this, we generated and analyzed two single-cell RNA sequencing datasets of the human minor salivary glands and gingiva (9 samples, 13,824 cells), identifying 50 cell clusters. Using integrated cell normalization and annotation, we classified 34 unique cell subpopulations between glands and gingiva. Severe acute respiratory syndrome coronavirus 2 (SARS-CoV-2) viral entry factors such as ACE2 and TMPRSS members were broadly enriched in epithelial cells of the glands and oral mucosae. Using orthogonal RNA and protein expression assessments, we confirmed SARS-CoV-2 infection in the glands and mucosae. Saliva from SARS-CoV-2-infected individuals harbored epithelial cells exhibiting ACE2 and TMPRSS expression and sustained SARS-CoV-2 infection. Acellular and cellular salivary fractions from asymptomatic individuals were found to transmit SARS-CoV-2 ex vivo. Matched nasopharyngeal and saliva samples displayed distinct viral shedding dynamics, and salivary viral burden correlated with COVID-19 symptoms, including taste loss. Upon recovery, this asymptomatic cohort exhibited sustained salivary IgG antibodies against SARS-CoV-2. Collectively, these data show that the oral cavity is an important site for SARS-CoV-2 infection and implicate saliva as a potential route of SARS-CoV-2 transmission.


Conflict of interest statement

Competing interests

Although the authors view each of these as non-competing financial interests, we report that, in the last year, K.M.B. has been a Scientific Advisor at Arcato Laboratories; K.M.B., B.M.W., M.O.F., A.J.K. and S.T. are active members of the Human Cell Atlas; for the past 6 months, M.O.F. has served as a Scientific Advisor for the PolyBio Research Foundation; and, for the last 3 years, S.A.T. has been remunerated for consulting by Roche and Genentech and is a member of Scientific Advisory Boards at Biogen, GlaxoSmithKline and Foresite Labs. All other authors declare no competing interests.

Figures

Extended Data Fig. 1 |
Extended Data Fig. 1 |. A hypothetical oral infection and transmission axis for SARS-CoV-2.
a, The contribution of the oral cavity to COVID-19 pathogenesis and transmission has been little explored. It is unknown whether SARS-CoV-2 can infect and replicate in the oral mucosae or glands. If the oral cavity is a site of early infection, this space may play important and underappreciated roles in transmitting SARS-CoV-2 ‘intermucosally’ to the lungs or gastrointestinal tract. Alternatively, saliva may also play a central role in transmitting the virus extraorally to others. b, The human oral cavity is a diverse collection of tissue niches with potentially unique vulnerabilities to viral infection (adapted from62). Additionally, saliva, a mixture of fluids, electrolytes, proteins, and cells (immune and sloughed mucosal epithelial cells) is made by the glands and empties into the oral cavity where it mixes with other fluids and cells). c, Labial minor salivary glands (SG) were procured from patients having biopsies for the clinical workup of Sjögren’s Syndrome who did not meet classification criteria and were otherwise healthy, including lacking SSA/SSB autoantibodies and without focal lymphocytic sialadenitis. Mucosal tissues including the gingiva and hard palate were harvested from four 20 to 30-year-old healthy subjects who were given a stent that prevented brushing only three maxillary teeth to induce localized gingivitis in subjects who never have progressed to periodontitis (Gingival Index; GI = avg. 1 out of 3; Probing depths <3 mm). For more annotated clinical characteristics, see Supplementary Table 1.
Extended Data Fig. 2 |
Extended Data Fig. 2 |. RNA sequencing reveals common viral infection susceptibilities.
a, Expression matrix visualization of the integrated human oral atlas illustrates that cell types are distinguished by unique—and for some oral cell populations—as of yet, undescribed transcriptional signatures (defining list in Supplementary Table 1). b,c, (b) GTEx v7 RNA-seq data was used to construct a heatmap to visualize and compare the expression of viral entry factors across available tissue types including the esophagus, heart, lung, salivary gland, small intestine, and stomach. Salivary glands cluster with lung, small intestine, and stomach—all known tissues with tropism for SARS-CoV-2. c, Comparison of ACE2 and TMPRSS2 co-expression shows distinct clusters of tissues at risk of infection based on co-expression, including salivary glands clustering with the lungs and stomach—known sites of infection.
Extended Data Fig. 3 |
Extended Data Fig. 3 |. Validation of viral entry factor expression patterning across oral niches.
a, Immunofluorescence (IF) confocal microscopy demonstrated AQP5 (red, acini) colocalization with ACE2 (green) reveal that ACE2 is expressed on the apical (luminal) and basolateral membranes and is concentrated in the salivary gland (SG) acini/ducts (dotted/solid line, respectively; 1 independent replication). b-d, (b) Using healthy volunteer SG sections, minimal TMPRSS11D expression in ducts and acini was confirmed using RNAscope® in situ hybridization (1 independent replication). c, Analysis of available bulk RNA sequencing data suggests that the minor (minor) and parotid (PG) glands are vulnerable to SARS-CoV-2 infection compared to the submandibular glands (SMG); no independent replication. The minor SG express ~3x higher ACE2 compared to the major SG (violin plot highlights the mean with a solid line; minor: 1.42, 0.70; 0.53, respectively). For comparison, the glands express an equivalent amount of TMPRSS2 across all three SG samples (mean 63.60, 49.42; 64.78, respectively). d,e, To further confirm co-expression of ACE2 and TMPRSS2, RNAscope® fluorescent in situ hybridization and immunohistochemistry for pan-cytokeratin (pCK), shows that acini and ducts co-express ACE2 and TMPRSS2 further highlighting their vulnerability to infection in (d) minor and (e) parotid SG (1 independent replication). f, Examples of positive and negative controls for chromogenic assays in Fig. 3 (1 independent replication). g-h, (g) ISH mapping validation pipeline for discovering epithelial expression of SARS-CoV-2 entry factor expression in shedding suprabasal cells, first starting with H&E histochemical staining (1 independent replication). h, ISH was used with negative and positive probe controls. The dotted black box in (g) represents the zoomed-in areas. Experiments using immunofluorescence and in situ hybridization confocal microscopy were completed on tissue sections from 4 separate individuals (2 minor, 2 PG). Curved white arrows in (h) represent direction of differentiated epithelial cell shedding Scale bars: (f-h) 100μm, (a,b,d,e) 50μm.
Extended Data Fig. 4 |
Extended Data Fig. 4 |. Major and minor salivary glands are infected by SARS-CoV-2.
a, Viral load in minor salivary glands (SG) is generally higher when compared to parotid glands (PG) using ddPCR (n = 8 pairs, mean +/−s.e.m. = 1.38 +/−0.90 and 0.25 +/−0.16; respectively; p = 0.0625, Wilcoxon 2-sided signed-rank test). b, Infection and replication were tested using RNAscope® spike (V-nCoV2019-S), sense (V-nCoV2019-orf1ab-sense), and controls (See Fig. 4b–e, Fig. 5, Extended Data Fig. 5); 1 independent replication. Positive and negative controls for spike and sense probes are presented. c, Compared to minor SG (Fig. 4b–e), in situ hybridization (ISH) also reveals infection and replication in PG. d, Quantification of spike and sense signal per cell in P19 minor SG, P19 PG, and CoV49 minor SG reveals. The majority of cells in the minor SG expressed less than 7 positive signals per-cell that were well-correlated. e,f, (e) More summary immunophenotyping scoring (0-3) data from the submandibular SG and submucosal SG of the upper respiratory tract (minor and parotid gland data can be seen in Fig. 4g); 1 independent replication. f, Representative immunophenotyping studies on a parotid gland from COVID-19 autopsy (P19) demonstrating mild, non-specific sialadenitis with a predominant T cell infiltrate with the expression of HLA-DR in the ducts and acini associated with inflammation; 1 independent replication. Scale bars: (b) 25μm, (c) 10μm, (f) black: 500μm; white: 100μm. A solid black box highlights the area highlighted in the inset. Experiments using immunofluorescence and in situ hybridization confocal microscopy were completed on tissue sections from at least 4 separate individuals (5 minor, 4 PG). Immunophenotyping and was performed using autopsy sections (N =18 total tissue blocks) from individual specimens (N = 10). Three pathologists (BMW, DEK, and BG) independently scored the cases; disagreements were settled by consensus discussion.
Extended Data Fig. 5 |
Extended Data Fig. 5 |. Salivary cellular fractions are heterogeneous, but epithelia sustain infection.
a, Salivary epithelial cells were found to heterogeneously express SARS-CoV-2 entry factors in a minority of cells; 1 independent replication. b, Shed cells in saliva display unique TMPRSS family heterogeneity, which we also observed in tissue-specific oral atlases for salivary glands (SG) and mucosa; 1 independent replication. SG express the highest TMPRSS2, and some shed epithelial cells express similar patterns, suggesting they may be shed from the SG ducts; no independent replication. Others express higher TMPRSS4, suggesting these cells may be from the suprabasal mucosa. c, Ciliated cells in saliva are exceedingly rare (α-tubulin + ) but can be present and infected; no independent replication. d, SARS-CoV-2 can be found to be associated with the diverse oral microbiome on shed epithelial cells; 1 independent replication. e, Using a salivary neutrophil atlas from healthy patients, we confirm that virtually no neutrophils express ACE2 or TMPRSS2. f-h, (f) Using cell blocks of heathy saliva from the NIH, we validate our findings that shed salivary epithelial (pan-cytokeratin positive; pCK + ) cells express both ACE2 and TMPRSS2; 1 independent replication. We see minimal to no expression of these SARS-CoV-2 entry factors in pCKnegative cells. g, These ACE2 + cells are also infected by SARS-CoV-2 and (h) able to replicate the virus (1 independent replication each). Red arrowheads in (a) indicate SARS-CoV-2 entry factors; in (g) SARS-CoV-2 infection; green arrowheads in (h) represent SARS-CoV-2 replication. Arrowheads in (h) indicate SARS-CoV-2 (red), universal 16 S probe (green) that are co-expressing (yellow); dotted lines (f) represent zoomed-in images. Scale bars: (a,b,d,g) 25 μm, (c,f,h) 10μm.
Extended Data Fig. 6 |
Extended Data Fig. 6 |. Saliva sampling supports a role for oral cavity in COVID-19 pathogenesis.
a,b, (a) Acellular (b) and cellular fractions (N = 8) were incubated with Vero cells in duplicate. Supernatants from the acellular saliva more often caused CPE (n = 2 of 8) compared to the cellular fraction (n = 1 of 8); 1 independent replication. c, A clinical study, NIH Transmissibility and Viral Load of SARS-CoV-2 Through Oral Secretions Study (AKA – ‘NIH Carline Study’), was used for symptom tracking and prospective sampling of nasopharyngeal (NP) swabs and saliva. d, Subjects with the highest saliva viral load and reported taste alterations (left); these individuals displayed infection of salivary epithelial (pCK+) cells using spike and polymerase probes--n = 3 (CoV19, CoV23, CoV25 where 2257, 28260, and 31804 cells, respectively, were counted). Bars are presented as mean +/− SEM., respectively with 1 independent replication). e, Infectious saliva fraction was measured with masks and unmasked in symptomatic (oral/systemic; red and systemic only; green). f, Sub-study of LIPS for nucleocapsid IgG and spike IgG levels comparing saliva and sera from the same subjects by calculating a two-sided agreement statistic (kappa) of antibody positivity without adjustment for multiple comparisons. Due to the limitations of the study design, samples were not temporally linked. In general, there was fair to excellent agreement between the presence of salivary and sera antibodies to nucleocapsid and spike, respectively. No pattern for salivary versus sera nucleocapsid IgG levels was observed, though this may reflect temporal differences. Sera trended toward relatively higher levels when assaying for spike IgG antibody levels. Green dotted lines in (f) represent saliva cutoff for nucleocapsid and spike; blue dotted lines, cutoffs for sera. Annotations: Scale bars: (a,b) 100μm, (d) 25μm. Statistical test (e): p< 0.005, two-sided Wilcoxon signed-rank test.
Fig. 1 |
Fig. 1 |. Single-cell atlases of distinct oral tissue niches reveal diverse immune and epithelial cells.
a,b, Using unpublished datasets, UMAPs of scRNA-seq data from dissociated (a) minor SGs and gingiva (b) delineate cell population contribution by sample and cell type annotation. We found 22 populations in the SG (7,141 cells) and 28 populations in the gingiva (6,683 cells). c–f, Distinct SG cell subpopulations were defined by a (c) dot plot expression matrix. Gene set (MSigDB) analysis for immune activation pathways (d) does not show clear enrichment, pointing to cells being in a resting/homeostatic state in the SGs. Gingival cell atlases were also defined by a dot plot expression matrix. f, Despite these biopsies coming from minorly inflamed gingival tissues (gingival index scoring an average of 1 out of 3), MSigDB analysis revealed minimal activation of T, natural killer and B cell populations. For gene lists related to a–d, see Supplementary Table 1. IFN, interferon; NK, natural killer; DC, dendritic cell.
Fig. 2 |
Fig. 2 |. An integrated oral cell atlas reveals broad epithelial infection susceptibilities.
a, To characterize the vulnerabilities of oral tissues to infection by SARS-CoV-2 and other common viruses, we integrated unpublished data from human oral gingiva and minor SGs. b, These 50 populations were jointly annotated before integration into 34 cell clusters to create the first human pan-oral cell atlas (see gene signatures in Extended Data Fig. 2a and Supplementary Table 2). These results illustrate that both shared and unique cell populations are represented in the gingiva and SG. c, Vulnerabilities to infection by coronaviruses, influenza and rhinovirus C can be predicted based on entry factor expression and visualized using expression matrices. Epithelia appear especially at risk for viral infection. d, When focused on the nine epithelial cell populations, vulnerabilities to SARS-CoV-2 were apparent in both SG and mucosa. These results strongly suggest that the oral cavity might be vulnerable to viral infection, especially for SARS-CoV-2. Expression matrices, including a low-frequency ACE2/TMPRSS2 co-expressing cells in Basal 1, ducts, mucous acini and myoepithelial clusters, further supporting SARS-CoV-2 infection susceptibilities. e, UMAPs demonstrate distinct cluster vulnerabilities, with ACE2 highest in most oral epithelia; however, expression of proteases demonstrated tissue-specific expression patterns with TMPRSS2 (enriched for SGs) and TMPRSS11D (enriched for mucosal cells). Endosomal proteases, CTSB and CTSL exhibited broad expression across vulnerable cell types. f, Normalized expression of epithelial clusters across oral, nasal and intestinal tissues demonstrate the relatively equivalent expression level of oral sites, especially in the minor SG. NK, natural killer; DC, dendritic cell; TA, transit amplifying.
Fig. 3 |
Fig. 3 |. Oral and oropharyngeal ISH mapping supports oral infection by SARS-CoV-2.
a,b, Using healthy volunteer (a) gland and (b) gingival tissue sections, mRNA expression was confirmed using RNAscope ISH for ACE2, TMPRSS2, TMPRSS4 and TMPRSS11D in gingiva; (see TMPRSS11D in SG: Extended Data Fig. 3b); three independent replications for each. b, Owing to the known shedding/sloughing of suprabasal epithelial cells (c, illustrations), we examined both basal and suprabasal (SB) expression, revealing enrichment of all examined entry factors in suprabasal over basal cells. c, Using ISH, we mapped ACE2 and TMPRSS2, TMPRSS4 and TMPRSS11D in diverse oral tissues (buccal mucosa, ventral tongue and the dorsal tongue) and the oropharynx (soft palate and tonsils); three independent replications for oral and two replications for oropharyngeal samples. ISH controls are included in Extended Data Fig. 3f–h. This again supported the heterogeneity that can be found in the oral cavity—not only considering suprabasal over basal enrichment but also across sites. This mapping also revealed that all sites are vulnerable to infection in suprabasal cells that are shed/sloughed into saliva. Arrowheads in a-c indicate high gene expression (red). Scale bars (a-c), 25 μm.
Fig. 4 |
Fig. 4 |. SGs are infected in patients with COVID-19 and exhibit robust immune responses.
a, ddPCR was used to investigate SARS-CoV-2 RNA in SGs: (minor (n = 14), parotid (PG, n = 8) and submandibular (SMG, n = 2) (18 individuals and 28 glands) recovered from COVID-19 autopsies. N1 and N2 mean ± standard deviation are displayed as appropriate for minor: 0.82 ± 2.0 and 0.86 + 2.1; PG: 0.10 ± 0.28 and 0.10 ± 0.26; and SMG: 0.34 ± 0.48 and 0.32 ± 0.46. b, c, Infection was confirmed using RNAscope fluorescence in situ hybridization (FISH) and IHC. Both minor (b) and parotid (c) SGs demonstrated SARS-CoV-2 in ACE2-positive ducts/acini (one independent replication). d-f, FISH and IHC detected SARS-CoV-2 infection and replication in the minor SG from (d) an acutely infected and (e) an autopsy SG using the spike (V-nCoV2019-S) and sense (V-nCoV2019-orf1ab-sense) probes, respectively (one independent replication). f, Spike IHC confirms patchy regional expression (zero independent replications). g, Immunophenotyping of autopsied SG was completed for CD3, CD4, CD8, CD20, CD68, HLA-DR and granzyme B (GzmB); T cell responses dominate and are well correlated with sialadenitis. h, i, Representative immunophenotyping studies on (h) an acutely infected individual (CoV49) and (i) a COVID-19 autopsy (P8), demonstrating mild-to-moderate sialadenitis with focal lymphocytic sialadenitis and epithelial injury. Scale bars: b,c left, d and e, 25 μm; b,c right, 10 μm; f, 50 μm; h,i black, 500 μm; h,i white, 100 μm. A solid black box highlights the area enlarged in the inset. Experiments were completed on tissue sections from at least four separate individuals (five minor and four parotid). Where appropriate, summary data are presented as mean values ± s.e.m.
Fig. 5 |
Fig. 5 |. Oral mucosal epithelial cells are infected by SARS-CoV-2 and shed into saliva.
a, We hypothesized that oral mucosae would be infected by SARS-CoV-2. b, Using the overlying mucosa from SG biopsy of CoV49 (Fig. 4), we performed ISH using spike/sense probes to demonstrate infection in basal, suprabasal (SB), and differentiated cells. Like the expression of SARS-CoV-2 entry factors (Fig. 3), replication was found more often in suprabasal layers (one independent replication). c, Mucosal scrapings from CoV49 confirmed infection and replication in cells fated to be shed into saliva (no independent replication). d,e, Salivary epithelial cells were found to express (d) all SARS-CoV-2 entry factors in a minority of cells (n = 5 for ACE2 and TMPRSS11D; n = 10 for TMPRSS2 and TMPRSS4). e, Scatter violin plots highlight percentage of expressing cells per sample from d, with means represented by a thick solid line (5.4, 2.8, 3.9 and 2.4; respectively). f-l, Salivary epithelial cells can sustain infection by SARS-CoV-2 using (f) ISH (one independent replication) or (g) IHC (no independent replication). h, Across saliva cells, there is infection heterogeneity of pCK cells (one independent replication). i, Using ten samples collected from outpatients with COVID-19, we confirmed that pCK cells are the primary infected cell population; red arrows point to individuals with loss of taste (n = 10 with two independent replications; two-tailed paired t-test P=0.01). j, SARS-CoV-2 infection more often occurs in ACE2+ cells. Using 3D confocal microscopy, we demonstrated the virus inside of these cells, (k) most of which were ACE2+ (two independent replications). l, These epithelial cells were found to sustain viral replication inside the cells (two independent replications). The solid white line in b represents basement membrane; the white arrow in b represents differentiated cell trajectory. Dotted white lines (c, j and l) highlight cell membranes; the dotted green circle (h) indicates possibly CK+ cell undergoing cell death; red arrowheads (h, j and l) represent SARS-CoV-2 infection, and green arrowheads (b and l) represent SARS-CoV-2 replication. DIC, differential interference contrast microscopy. Scale bars: b, h and l left, 25 μm; c, d, f, g, j and l right, 10 μm. Statistical test (i): **P ≤ 0.001.
Fig. 6 |
Fig. 6 |. Viral infection kinetics and the antibody response in saliva samples of patients with COVID-19.
a,b, To test the infectiousness of saliva, (a) acellular and (b) cellular fractions of saliva from individuals with high viral load (n = 8; Ct 16–29) were incubated in duplicate on Vero cells to observe viral CPE. Supernatants were incubated with new Vero cultures in duplicate to demonstrate replication of the virus. Both acellular and cellular fractions demonstrated CPE in some (n = 2) samples after 2 and 6 d, respectively; culture of supernatants elicited similar temporal dynamics as parent incubations (one independent replication). c,d, In a prospective, observational study, 39 NP-positive individuals with COVID-19 were grouped as having oral symptoms (with or without systemic symptoms), as having systemic symptoms only, or as being asymptomatic. Individuals demonstrated a heterogeneous disease course, with some requiring up to 13 weeks to clear detected virus in either the (c) nasopharynx or (d) saliva. Most asymptomatic individuals displayed only NP swab positivity, including two patients who developed symptoms during the prospective sampling (CoV12 and CoV13). e,f, Compared to healthy control saliva samples procured before the pandemic (n = 7), the LIPS assay shows that saliva from a cohort of individuals with COVID-19 (n = 32) contains antibodies to both (e) nucleocapsid and (f) spike viral antigens and occurred in 73% (22/30) and 54% (15/28) of samples, respectively. By week, the means ± s.e.m. are displayed to the right of each scatter plot as appropriate for nucleocapsid from weeks 1–7 (3.5 × 10⁴ ± 1.2 × 10⁴; 1.1 × 10⁵ ± 4.8 × 10⁴; 4.4 × 10⁵ ± 1.8 × 10⁵; 1.9 × 10⁵ ± 8.4 × 10⁴; 2.6 × 10⁵ ± 9.0 × 10⁴; 3.5 × 10⁵ ± 9.1 × 10⁴; 1.0 × 10⁵± 2.5 × 10⁴) and also for spike (1.8 × 10⁴ ± 2.6 × 10³; 2.2 × 10⁴ ± 3.3 × 10³; 3.7 × 10⁴± 8.2×10³; 4.2 × 10⁴ ± 8.7 × 10³; 4.7 × 10⁴ ± 7.6 × 10³; 5.7 × 10⁴ ± 6.2 × 10³; 3.3 × 10⁴± 5.0 × 10³). Fair to excellent agreement between presence of antibodies to viral antigens to nucleocapsid and spike was shown, respectively (Extended Data Fig. 6f). Horizontal dashed bar: (e and f) control light unit cutoff for positivity: mean plus 3 standard deviations. Scale bars (a and b), 100 μm. Ct, cycle threshold.

Similar articles

Cited by

References

    1. Zhu N et al. A novel coronavirus from patients with pneumonia in China, 2019. N. Engl. J. Med 382, 727–733 (2020). - PMC - PubMed
    1. Zhang R, Li Y, Zhang AL, Wang Y & Molina MJ Identifying airborne transmission as the dominant route for the spread of COVID-19. Proc. Natl Acad. Sci. USA 117, 14857–14863 (2020). - PMC - PubMed
    1. Ghinai I et al. First known person-to-person transmission of severe acute respiratory syndrome coronavirus 2 (SARS-CoV-2) in the USA. Lancet 382, 1137–1144 (2020). - PMC - PubMed
    1. Pung R et al. Investigation of three clusters of COVID-19 in Singapore: implications for surveillance and response measures. Lancet 382, 1039–1046 (2020). - PMC - PubMed
    1. Hamner L et al. High SARS-CoV-2 attack rate following exposure at a choir practice—Skagit County, Washington, March 2020. MMWR Morb. Mortal. Wkly. Rep 69, 606–610 (2020). - PubMed

Publication types