. 2021 Apr;22(4):485-496.
doi: 10.1038/s41590-021-00896-3. Epub 2021 Mar 25.

The tumor suppressor kinase DAPK3 drives tumor-intrinsic immunity through the STING-IFN-β pathway

Affiliations

The tumor suppressor kinase DAPK3 drives tumor-intrinsic immunity through the STING-IFN-β pathway

Mariko Takahashi et al. Nat Immunol. 2021 Apr.

Abstract

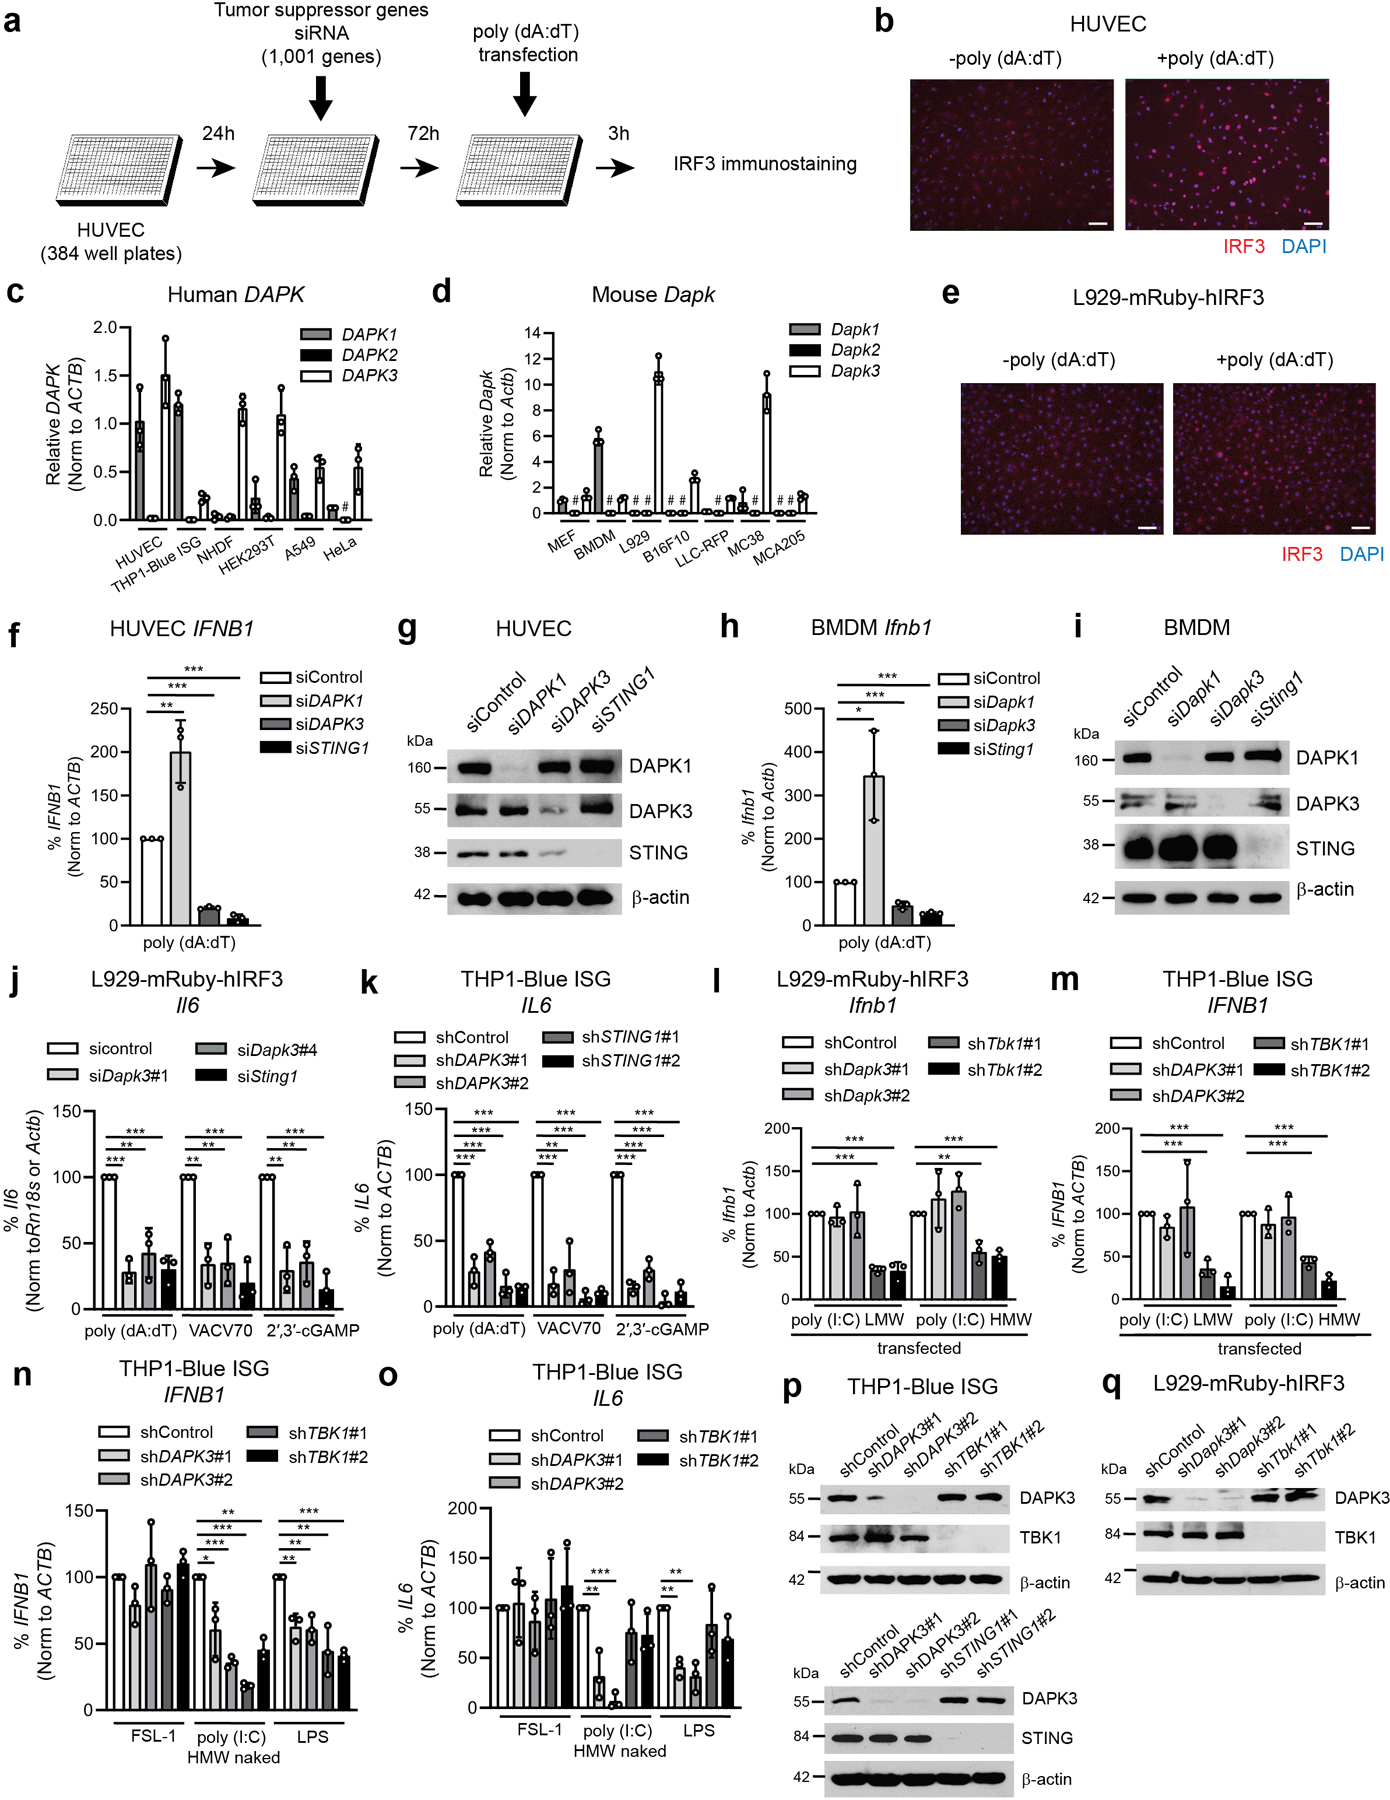
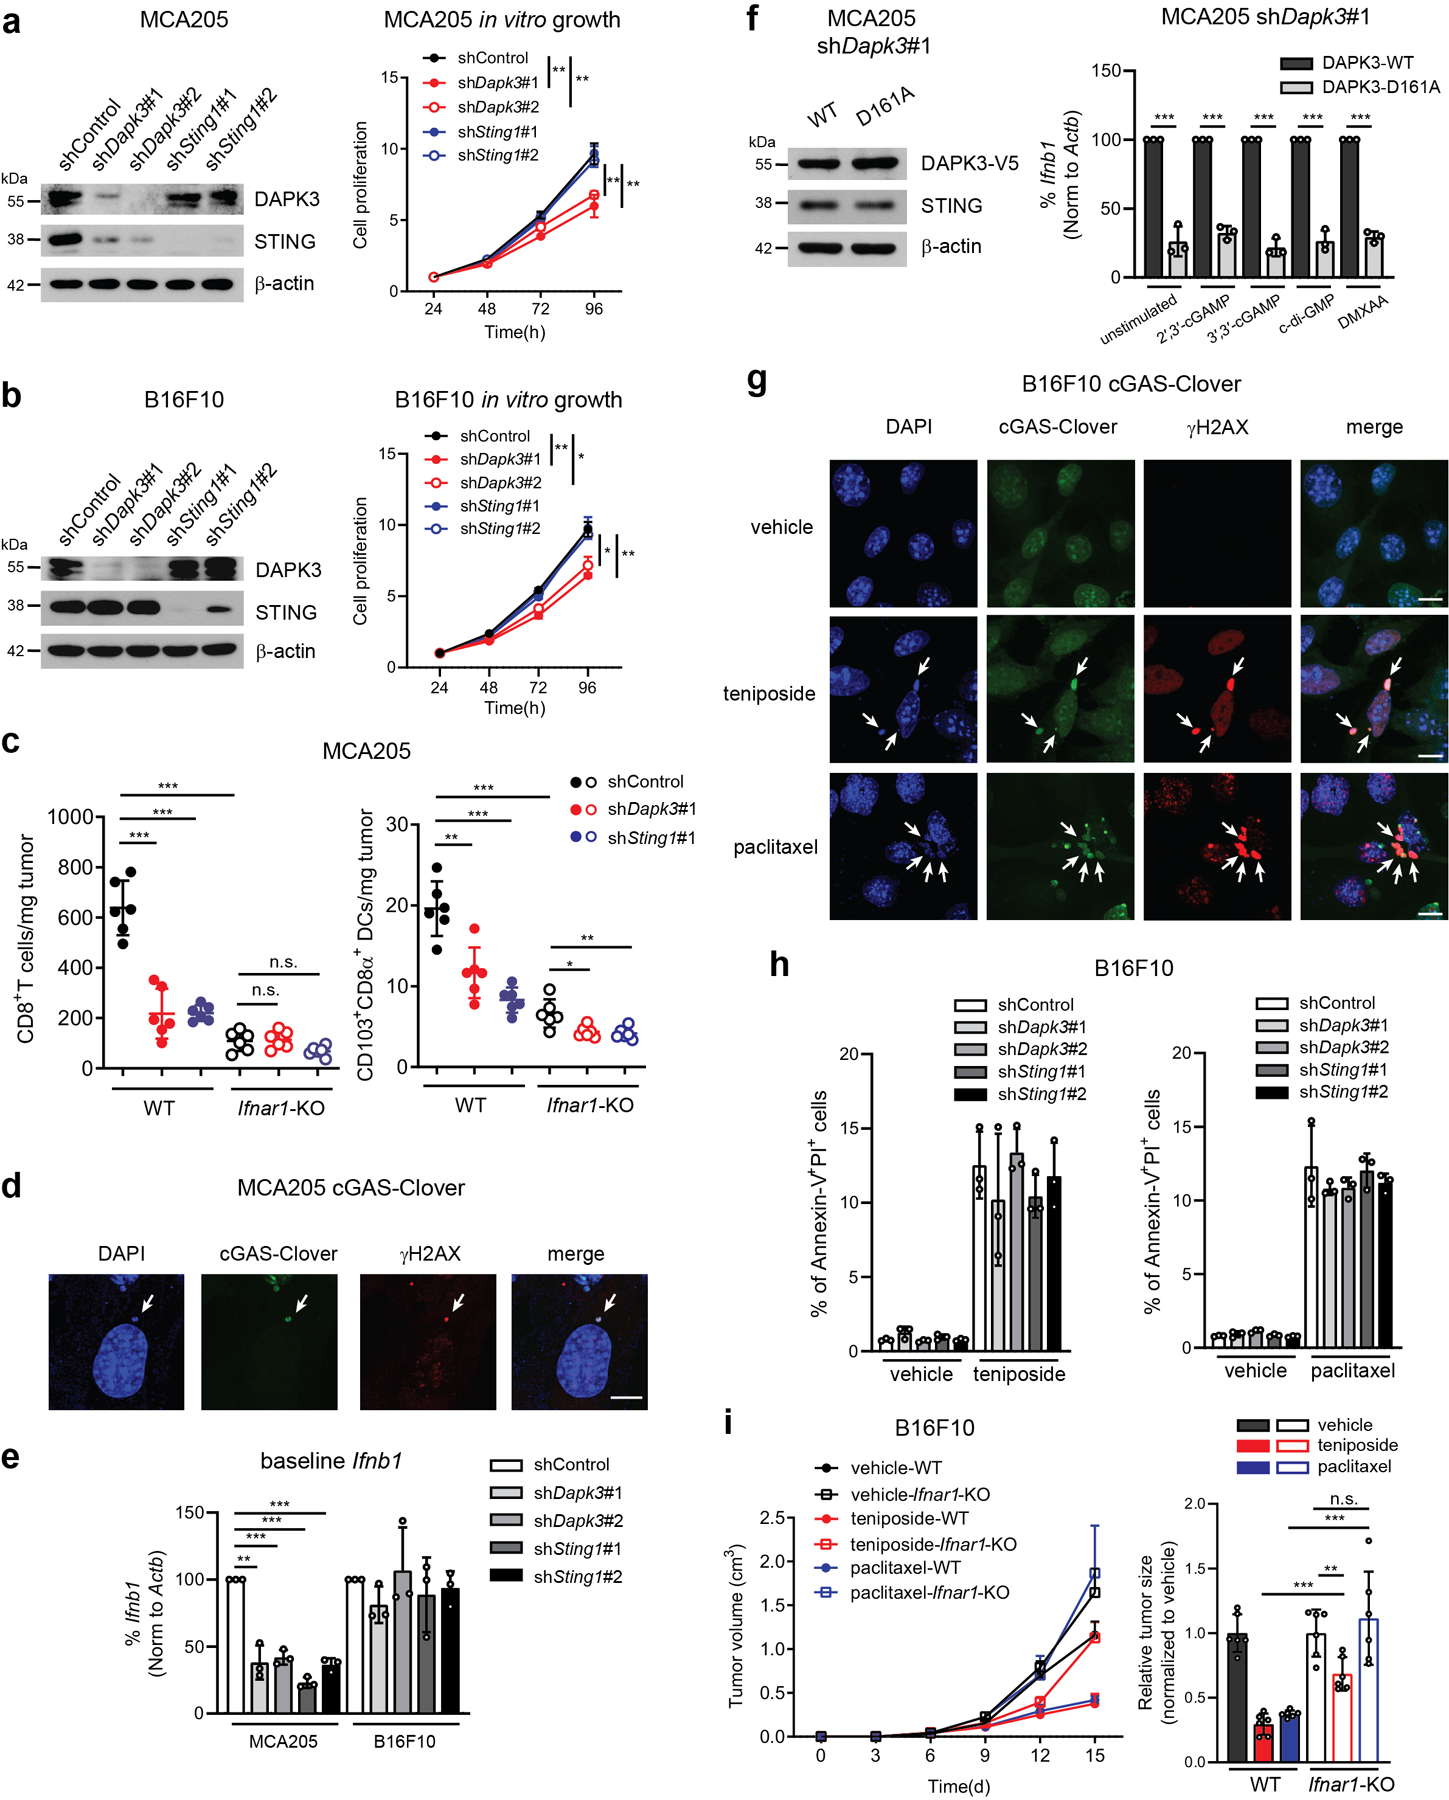
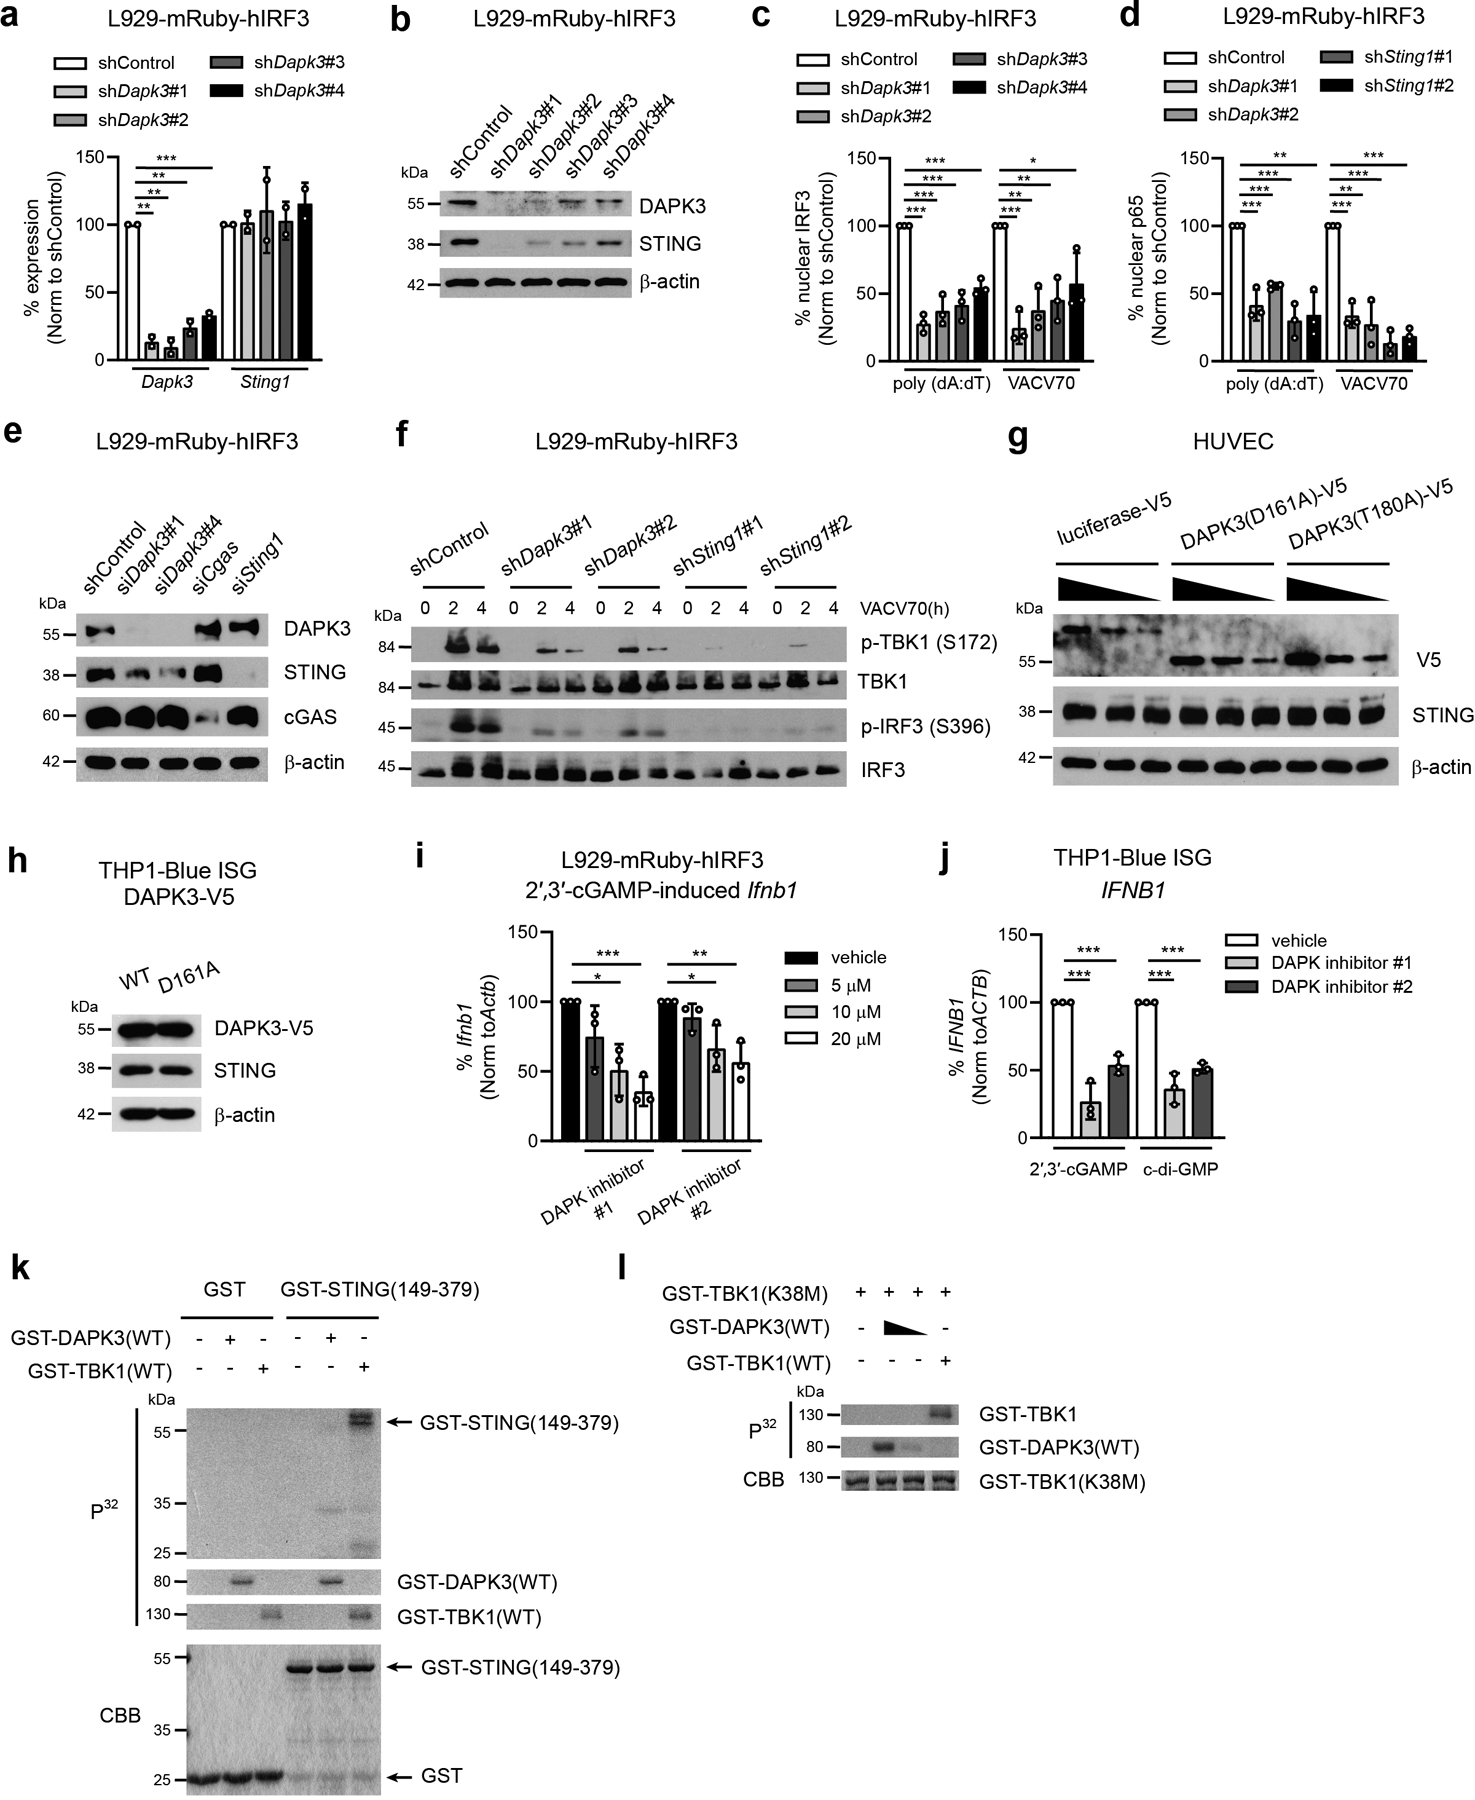
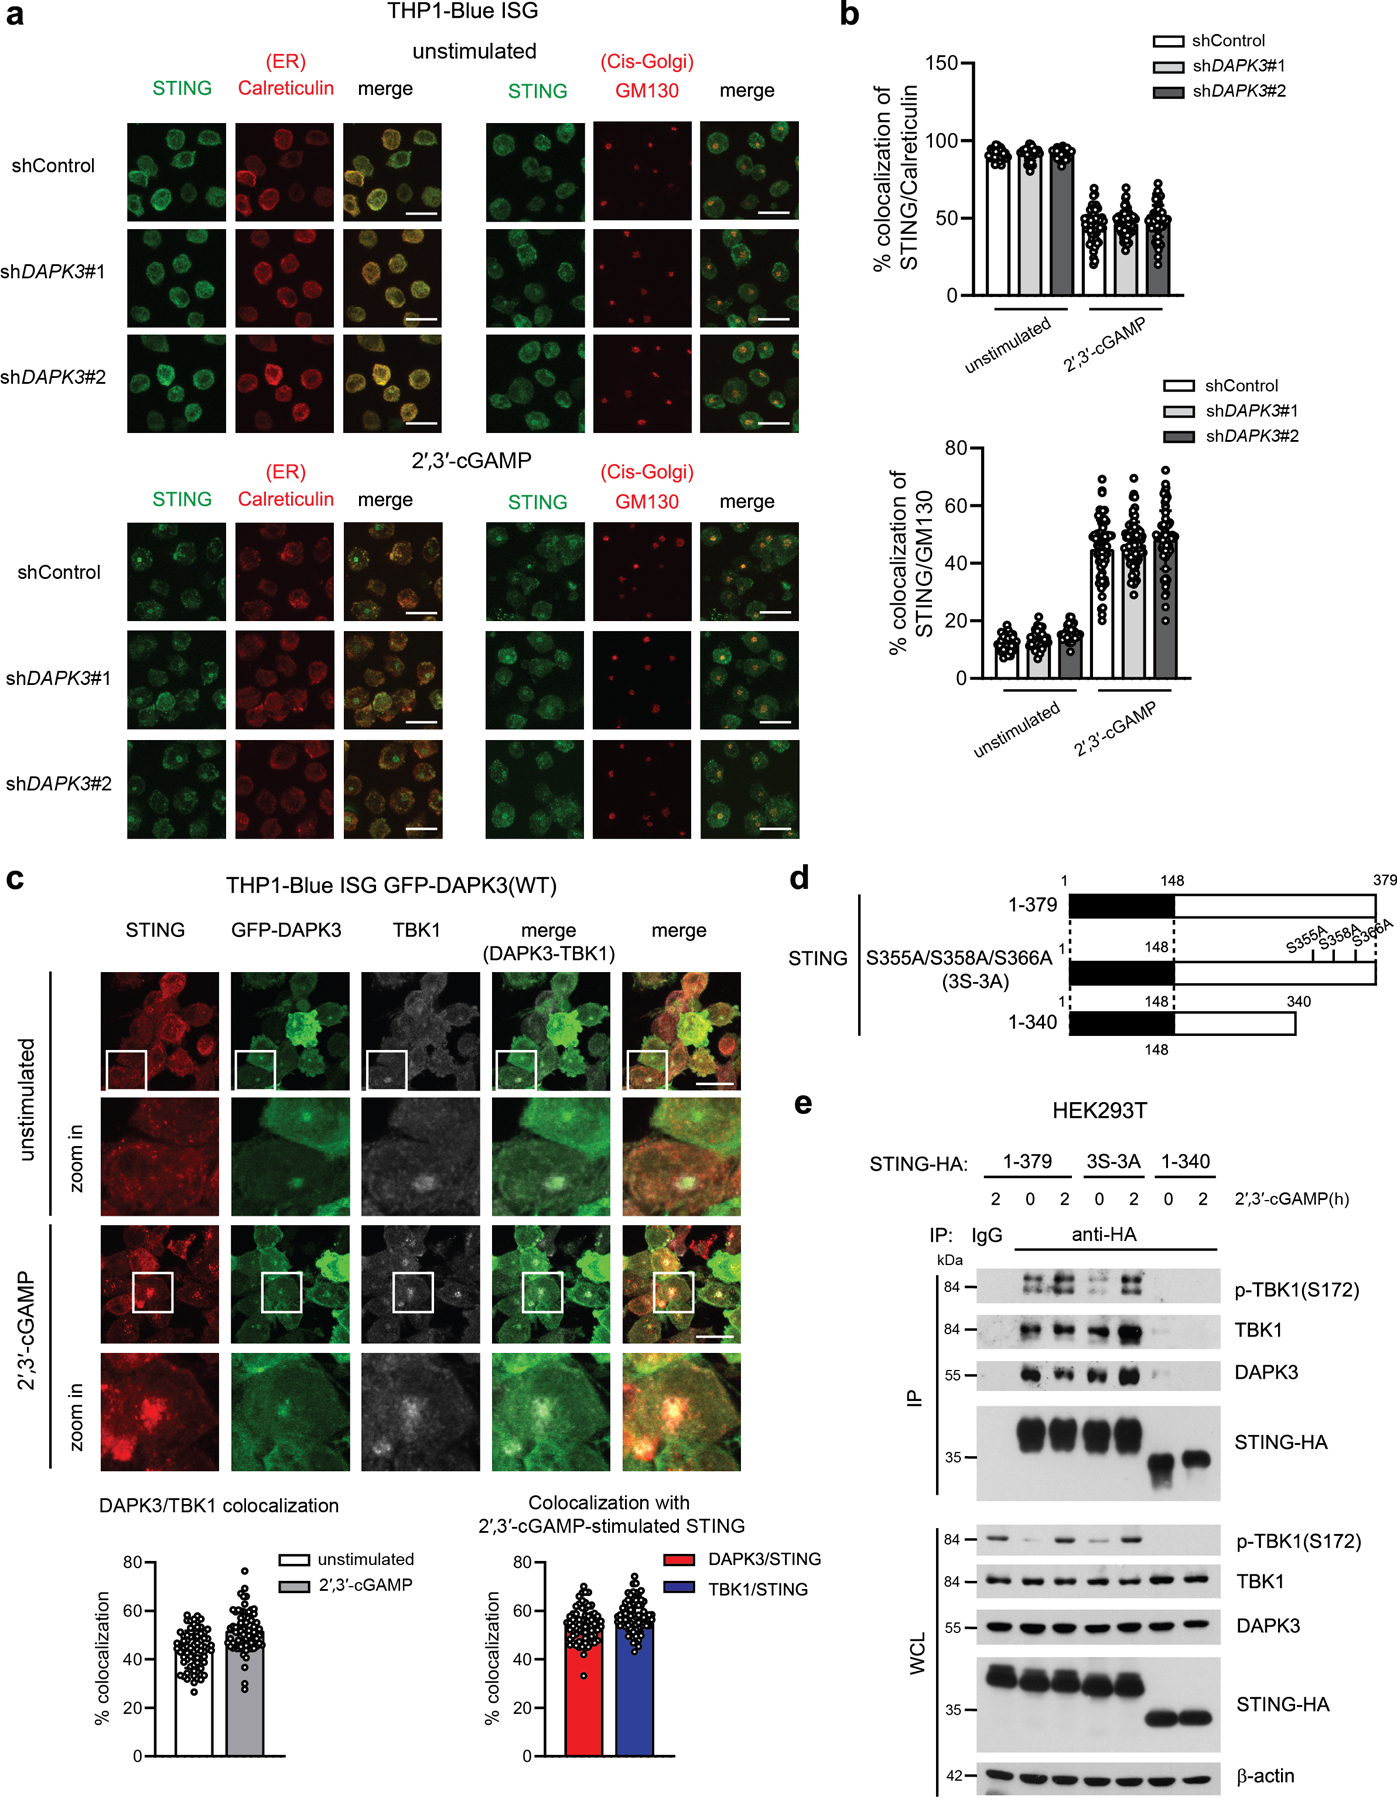
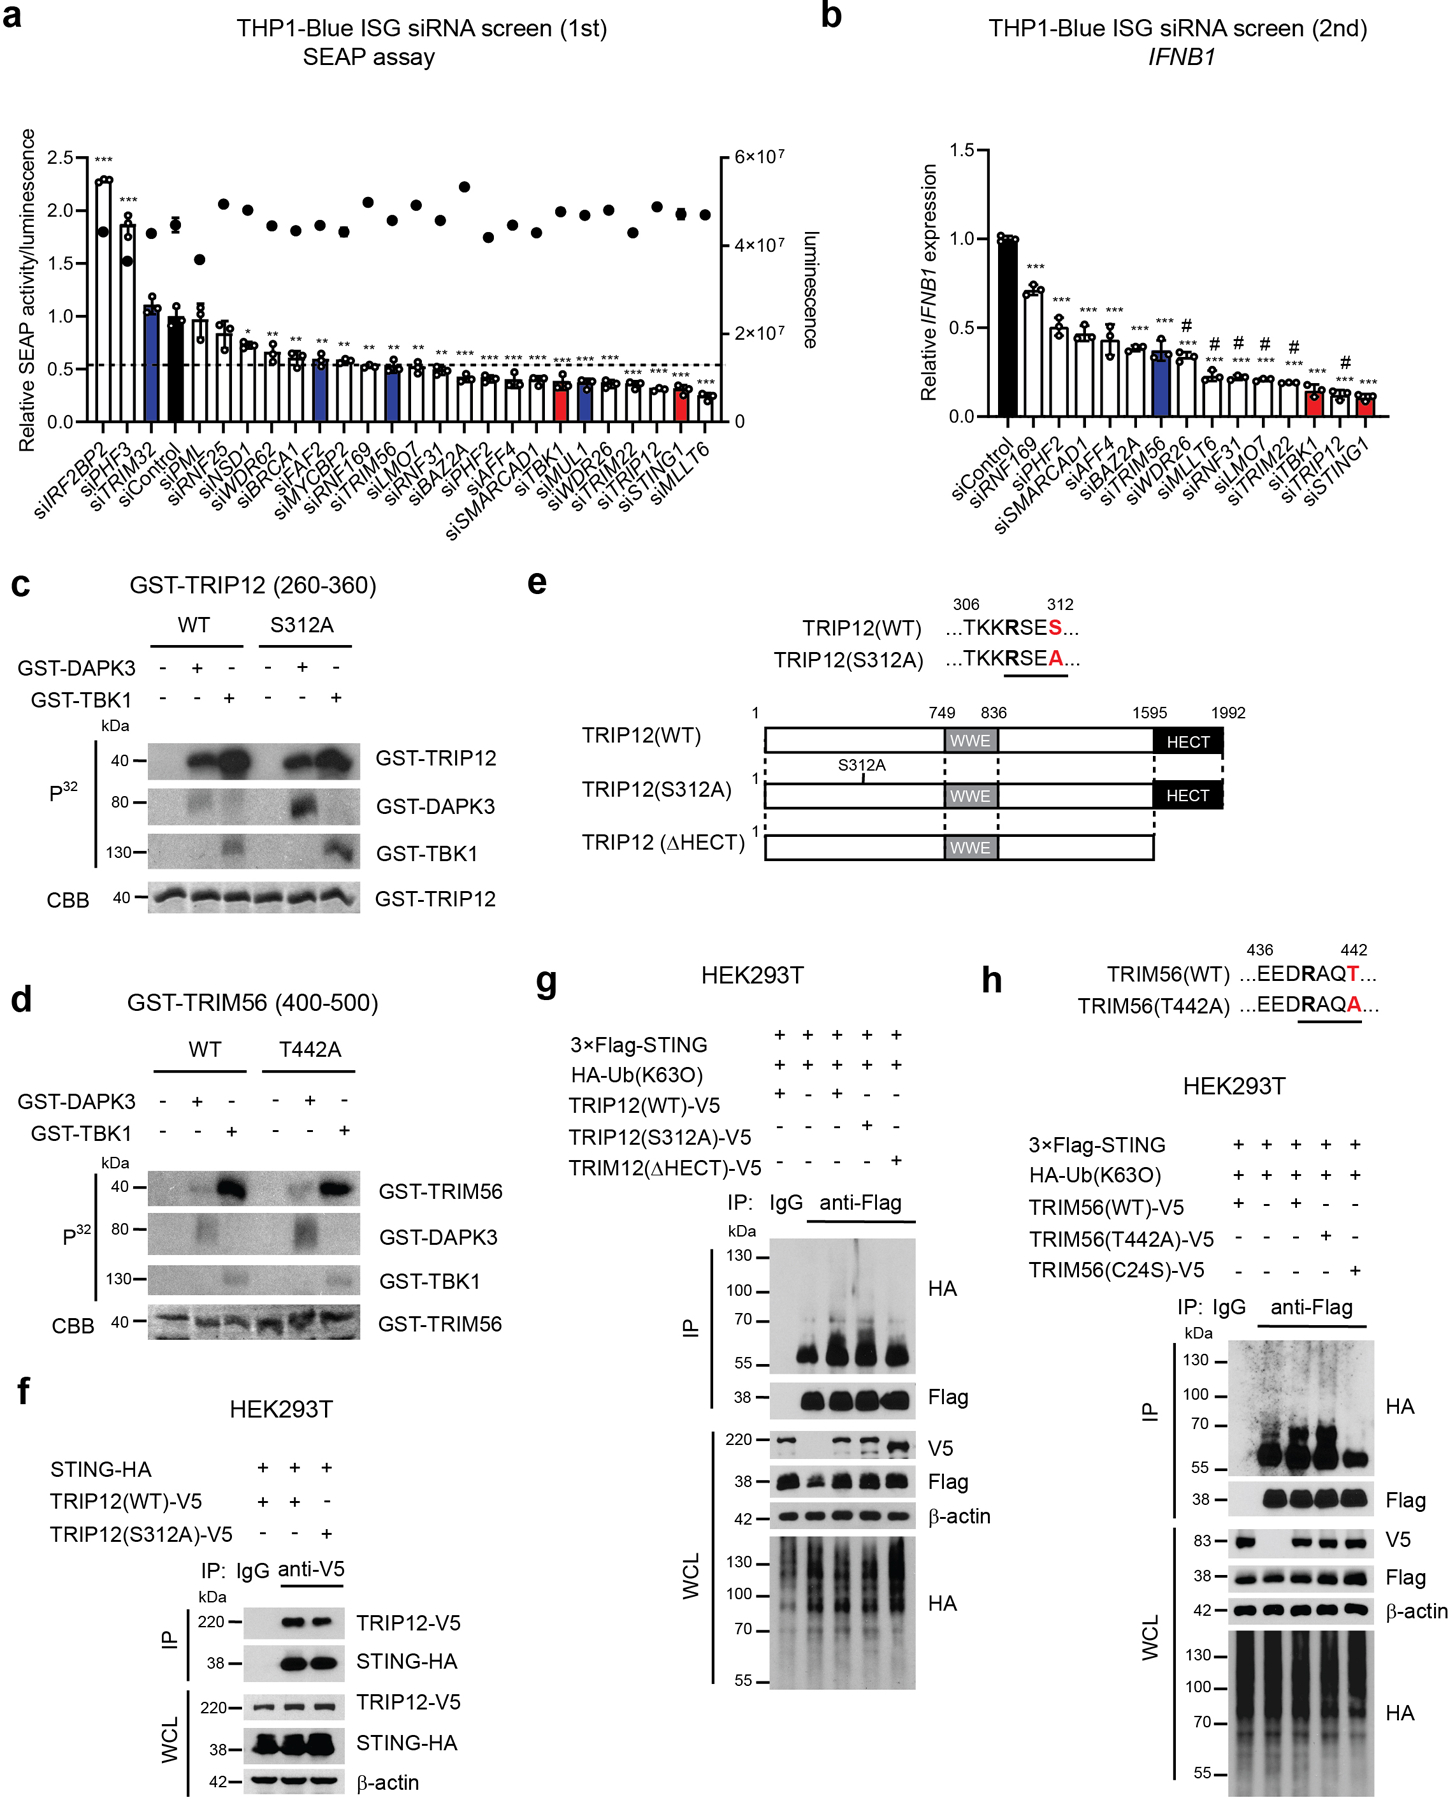
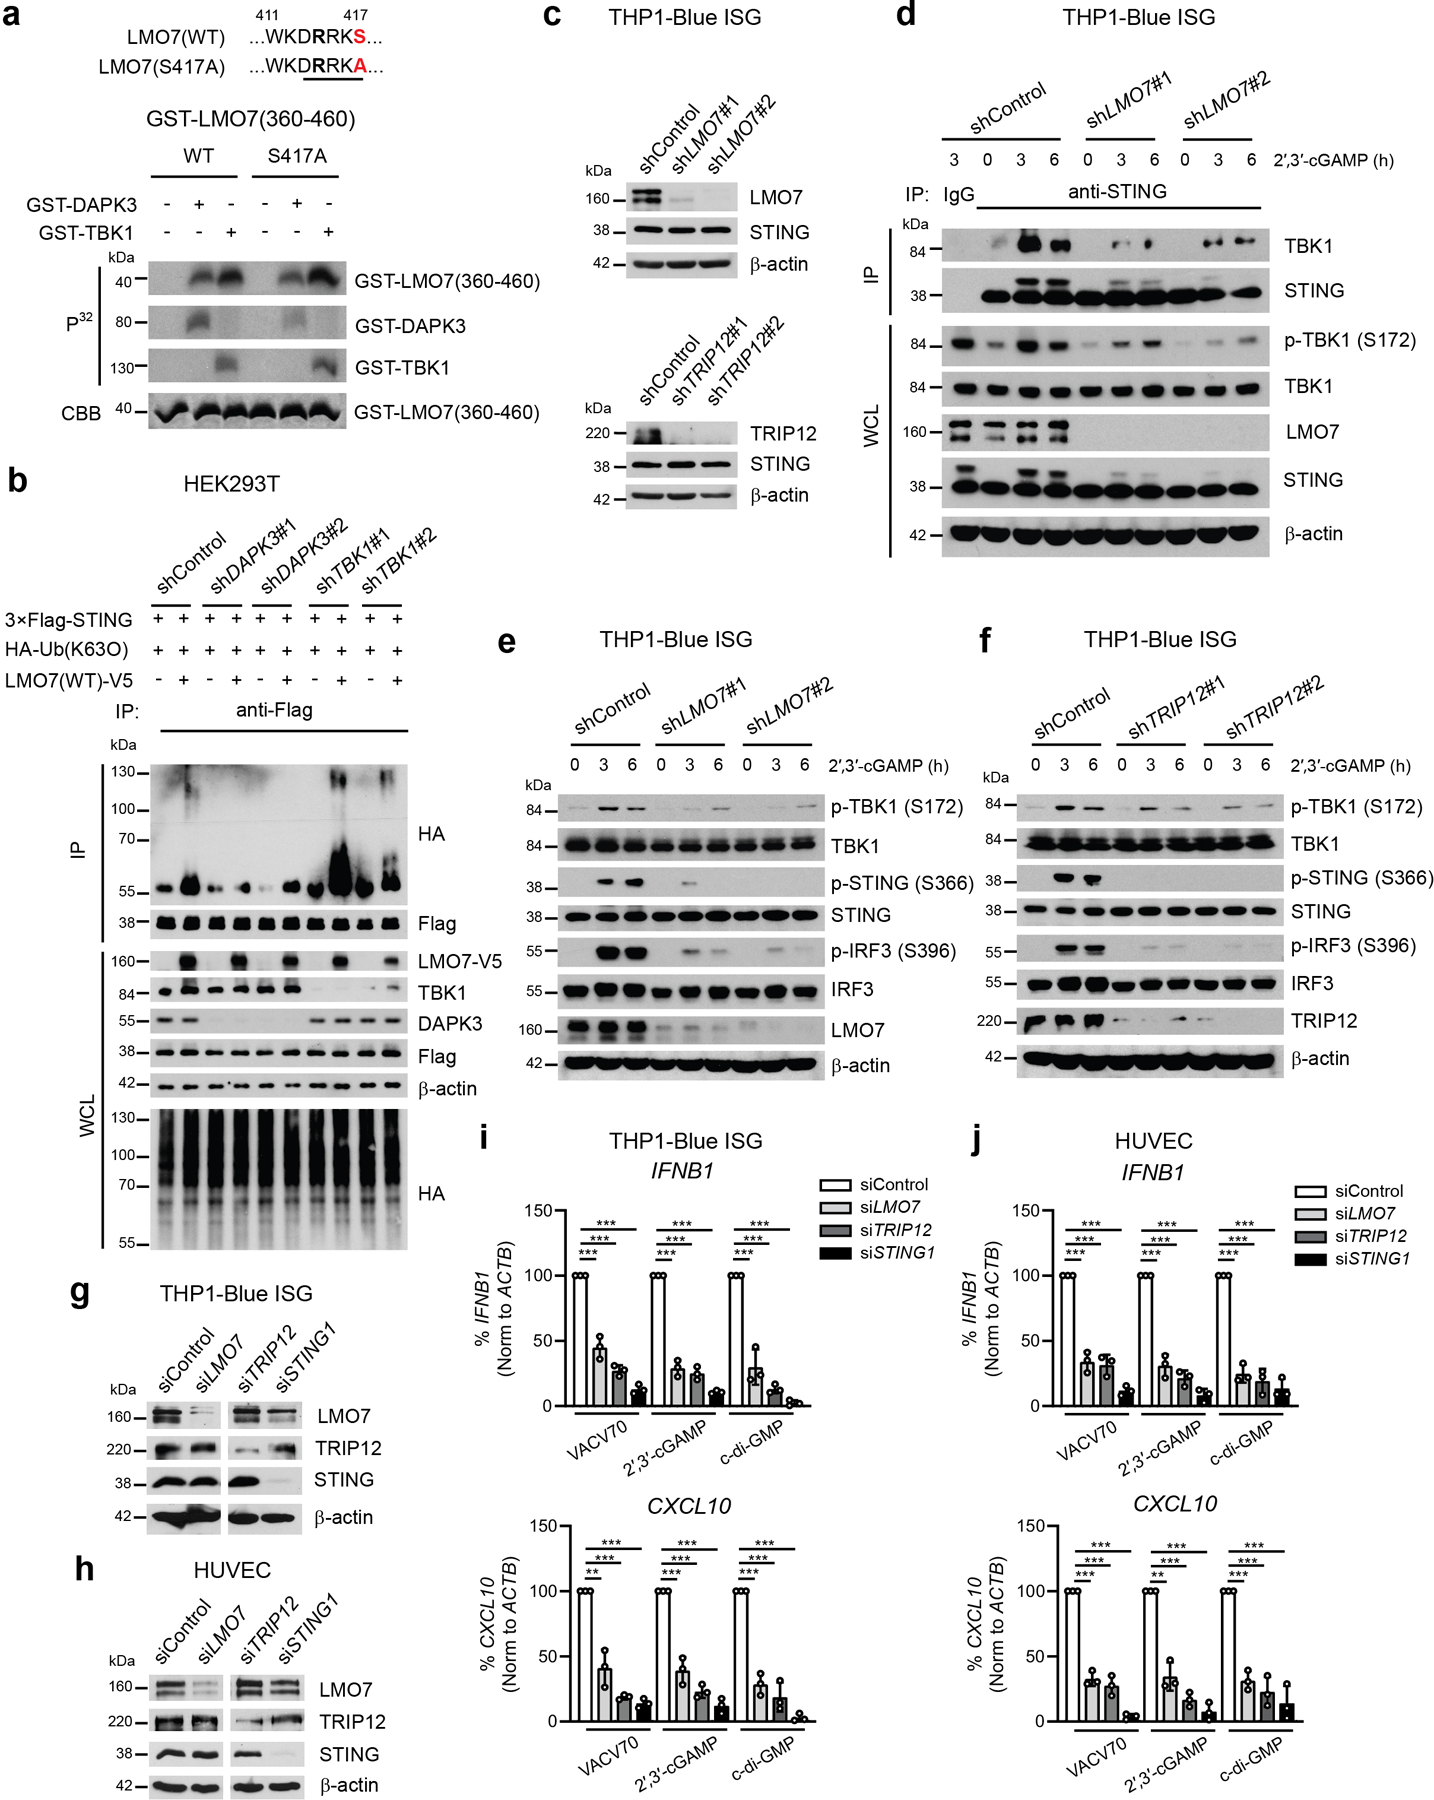
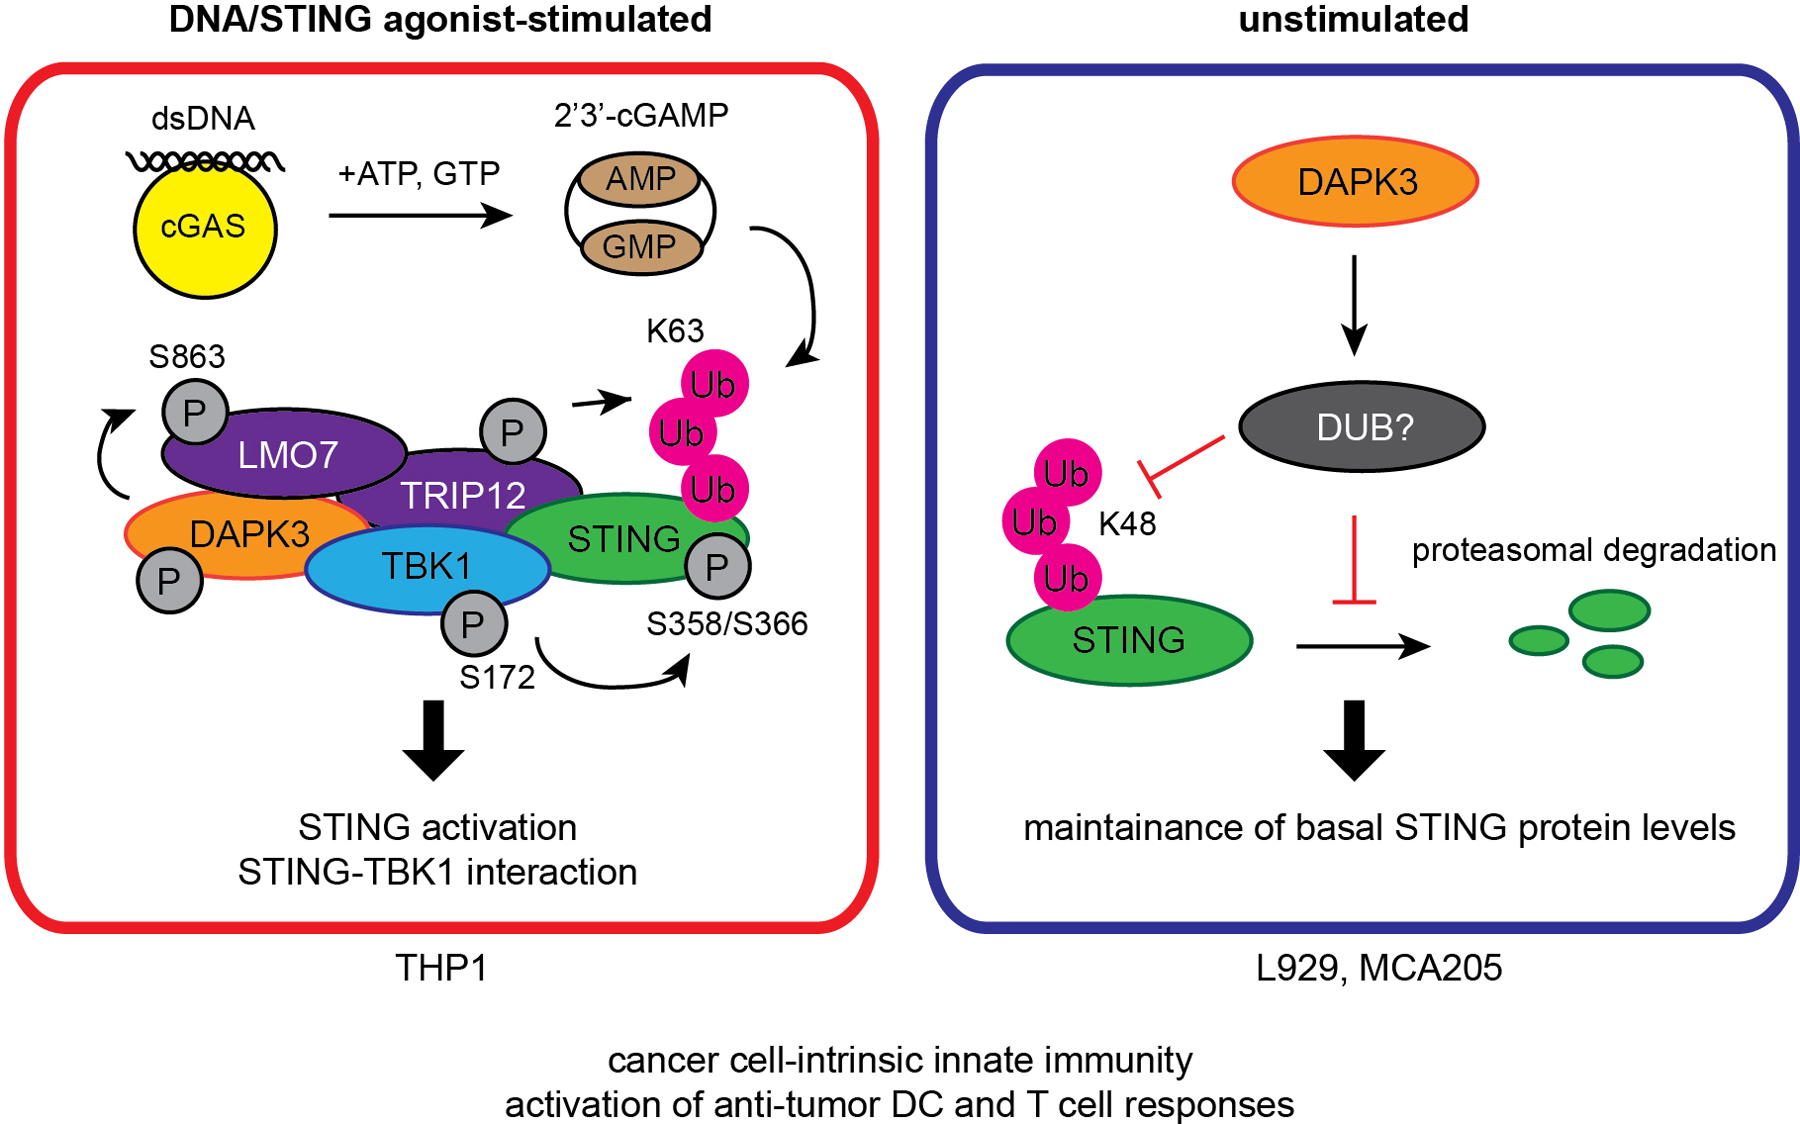
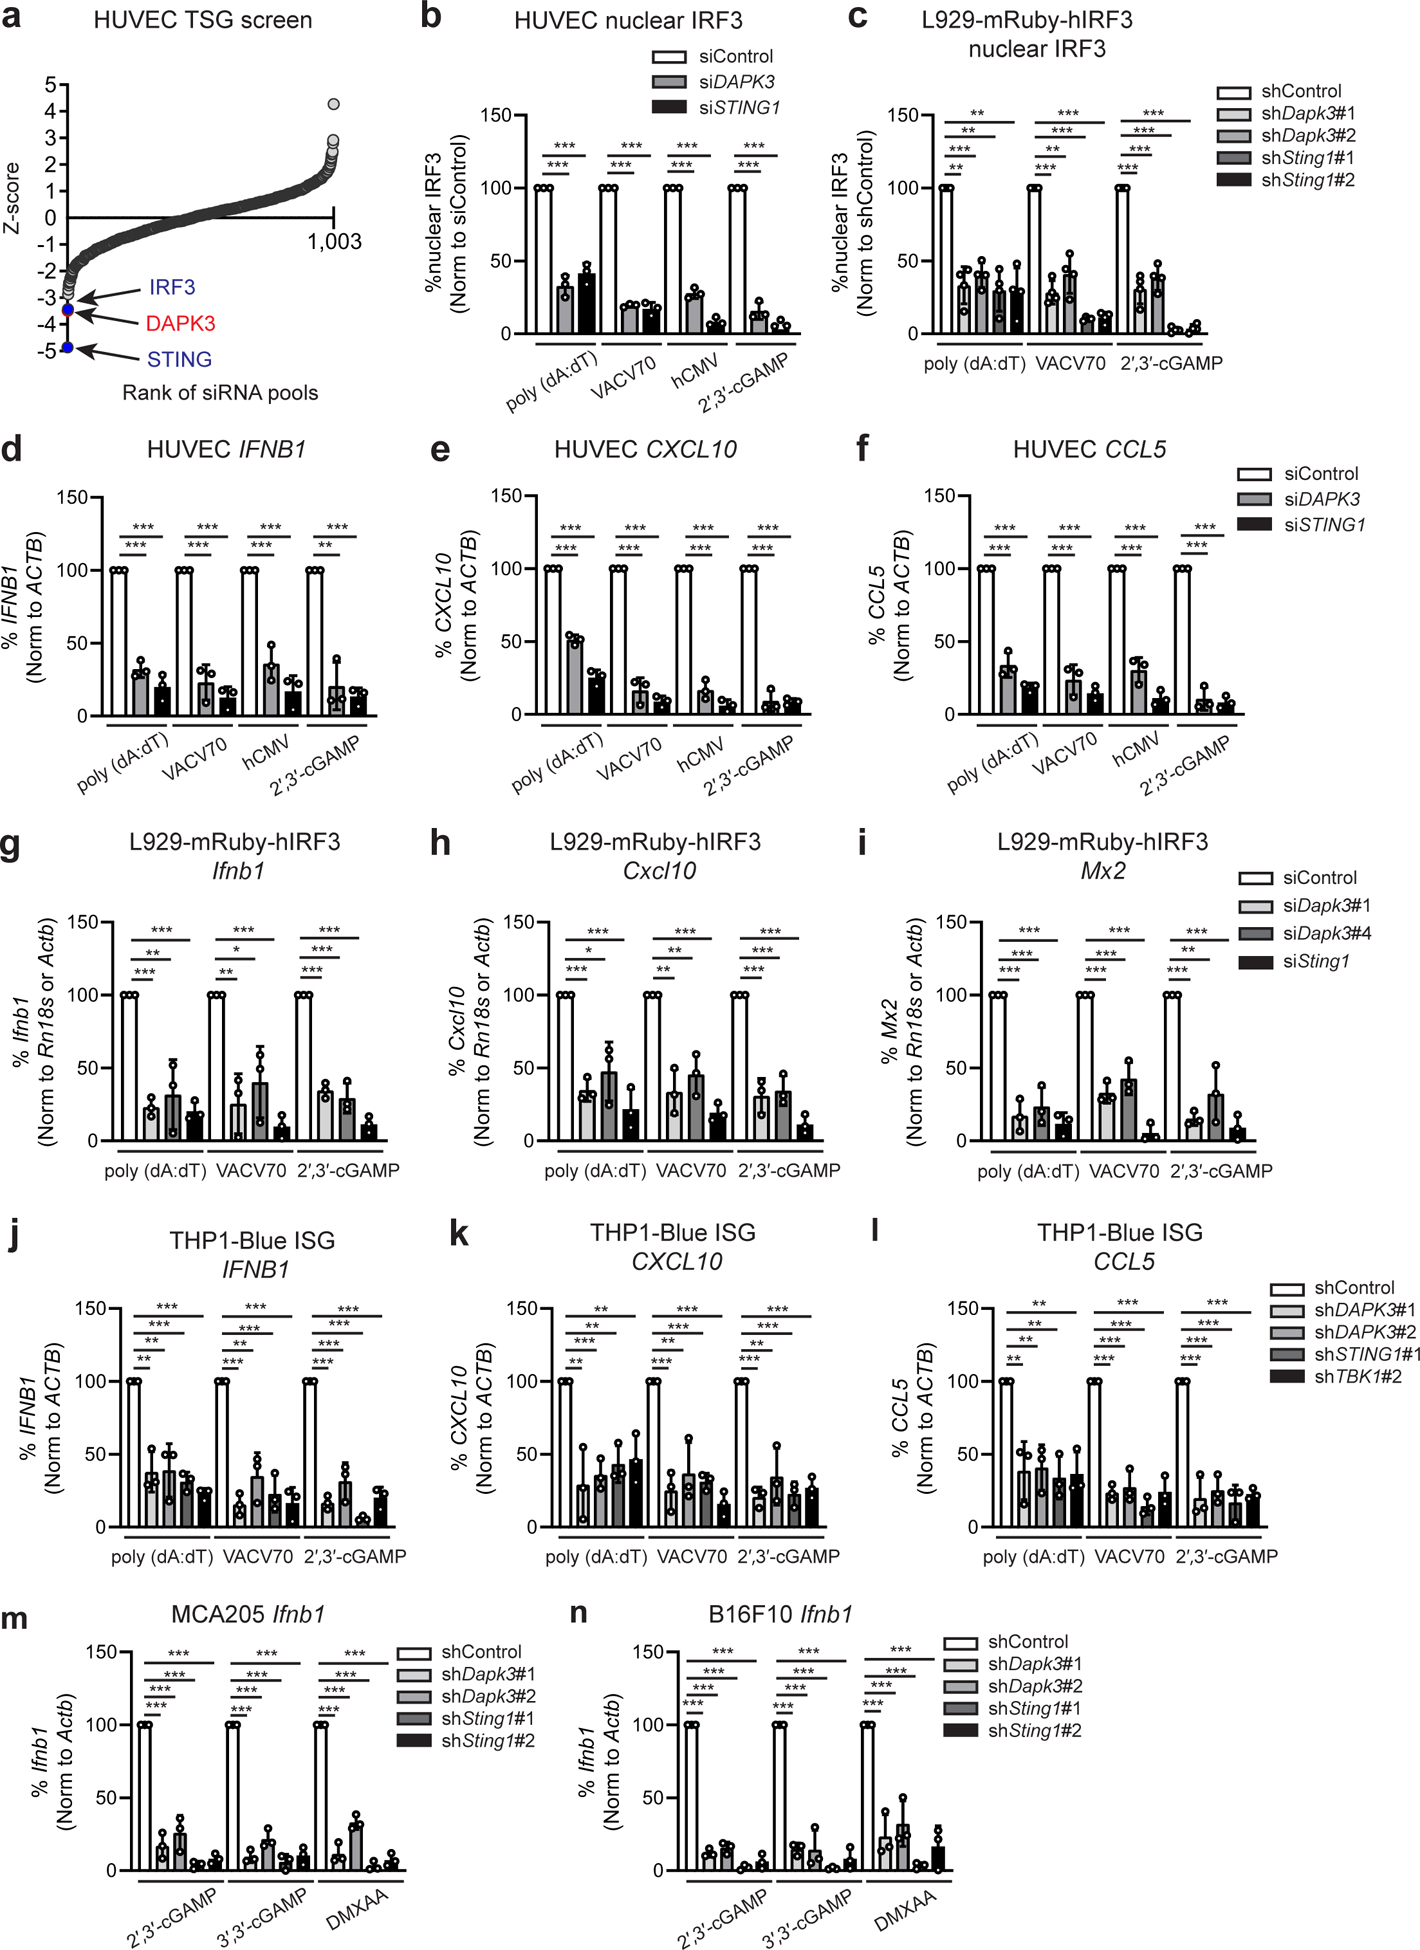
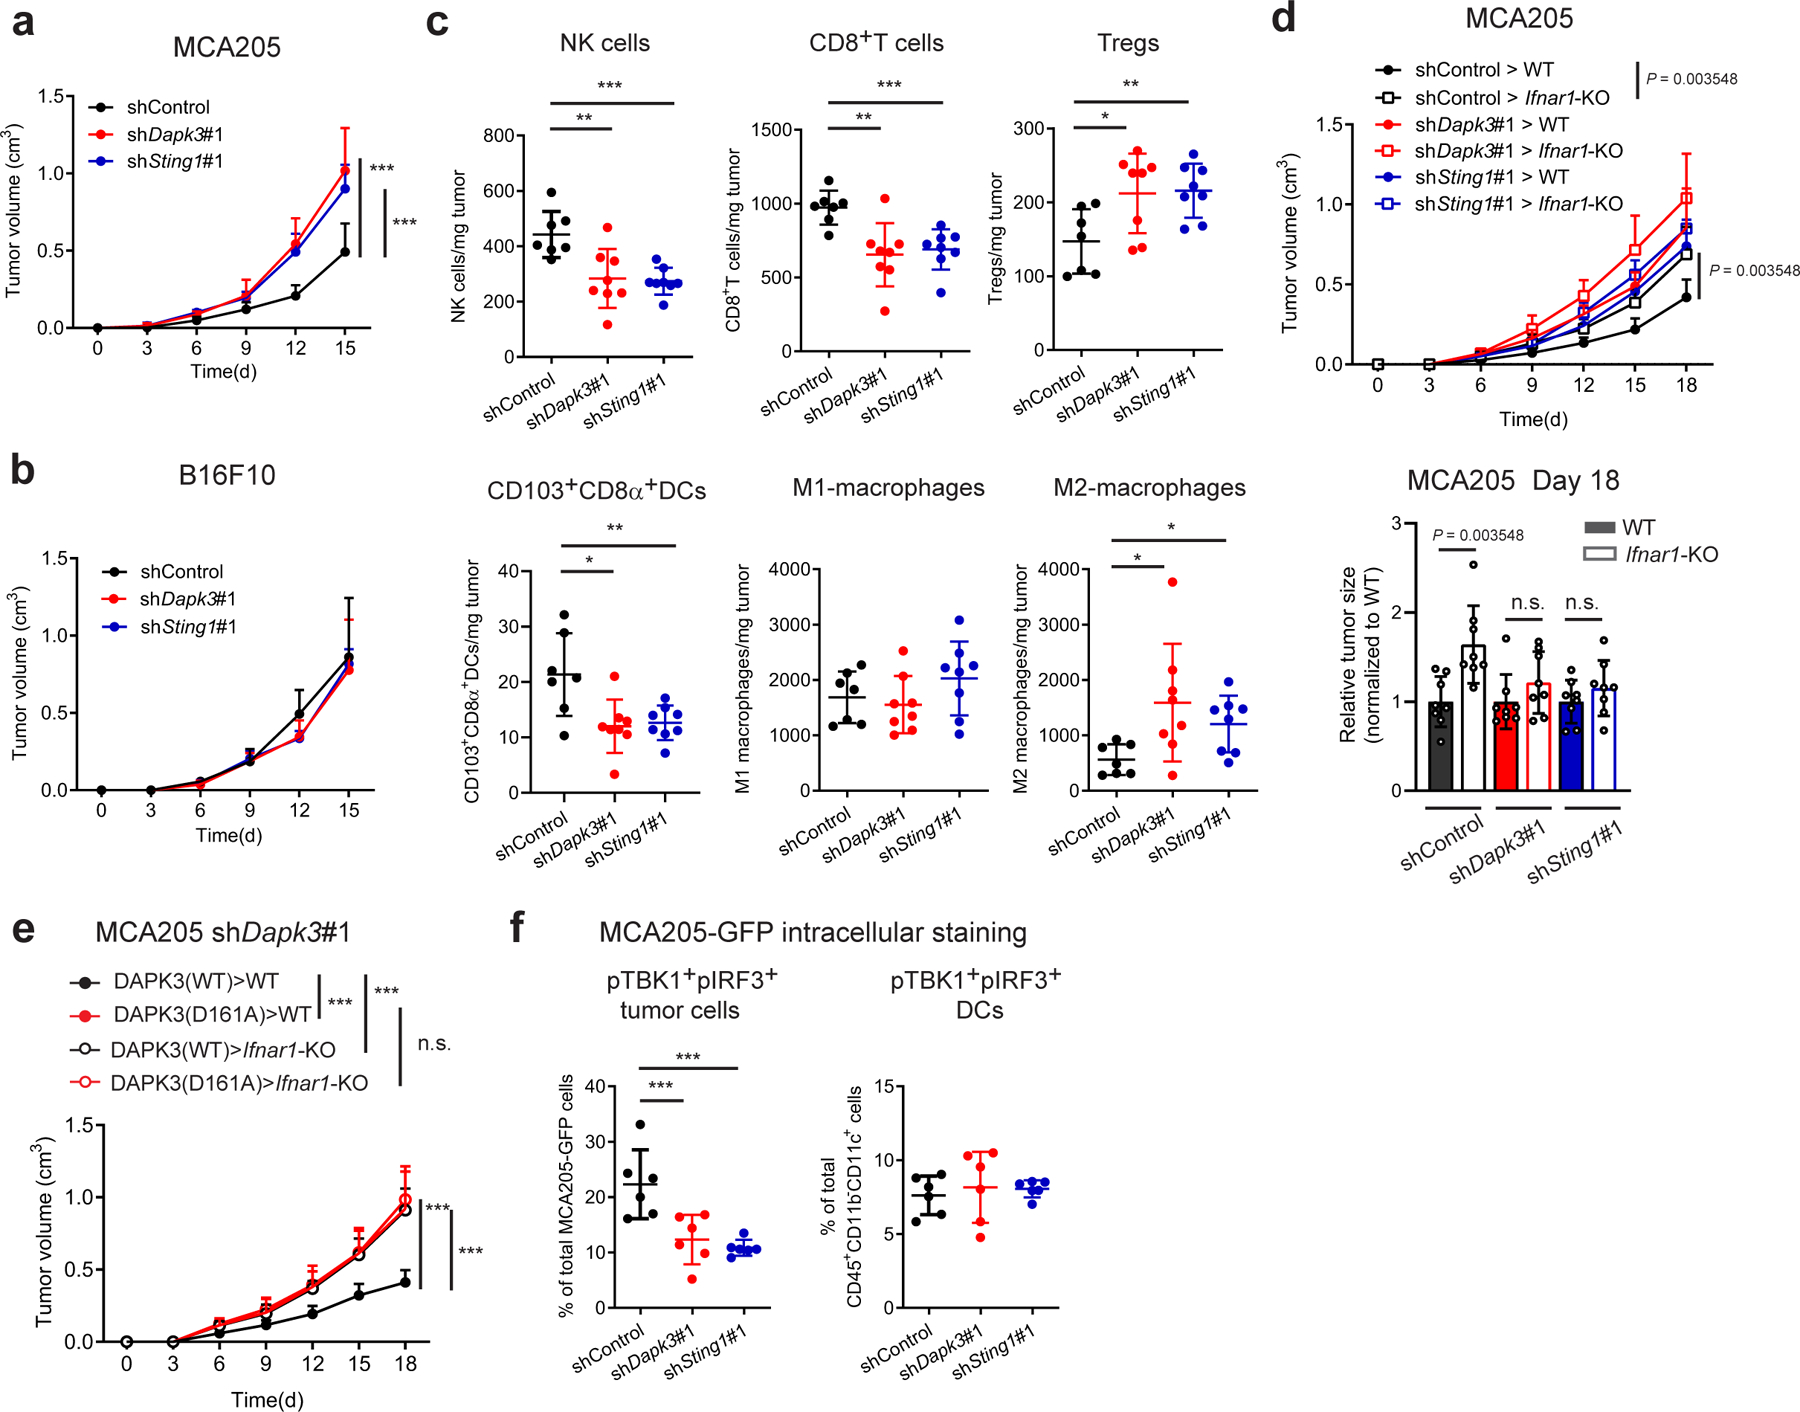
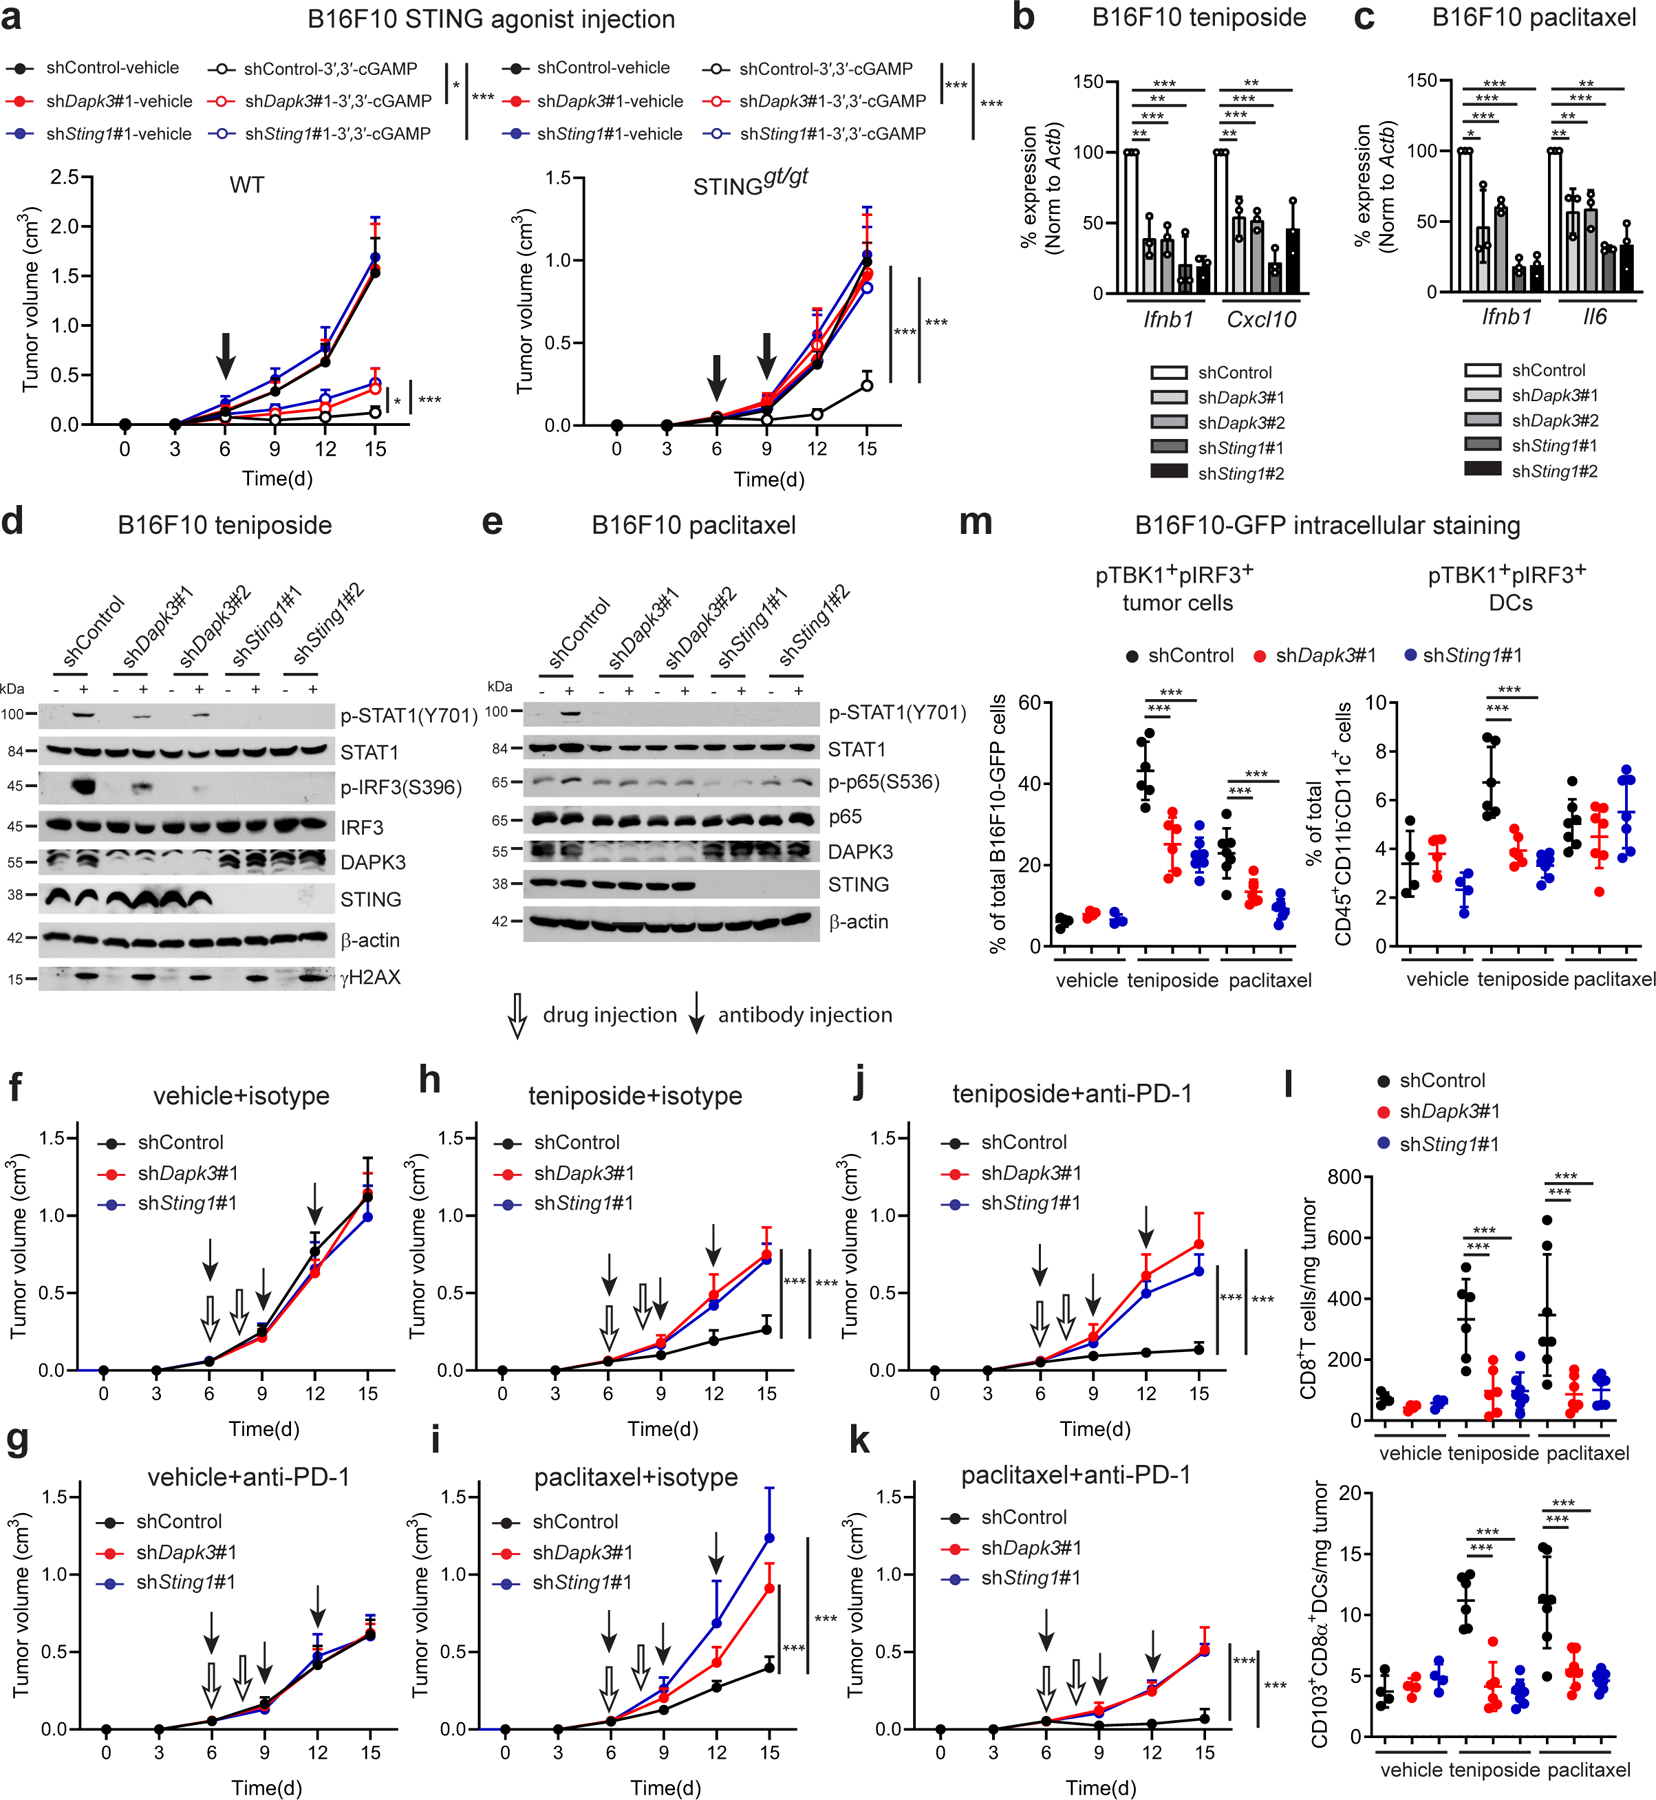
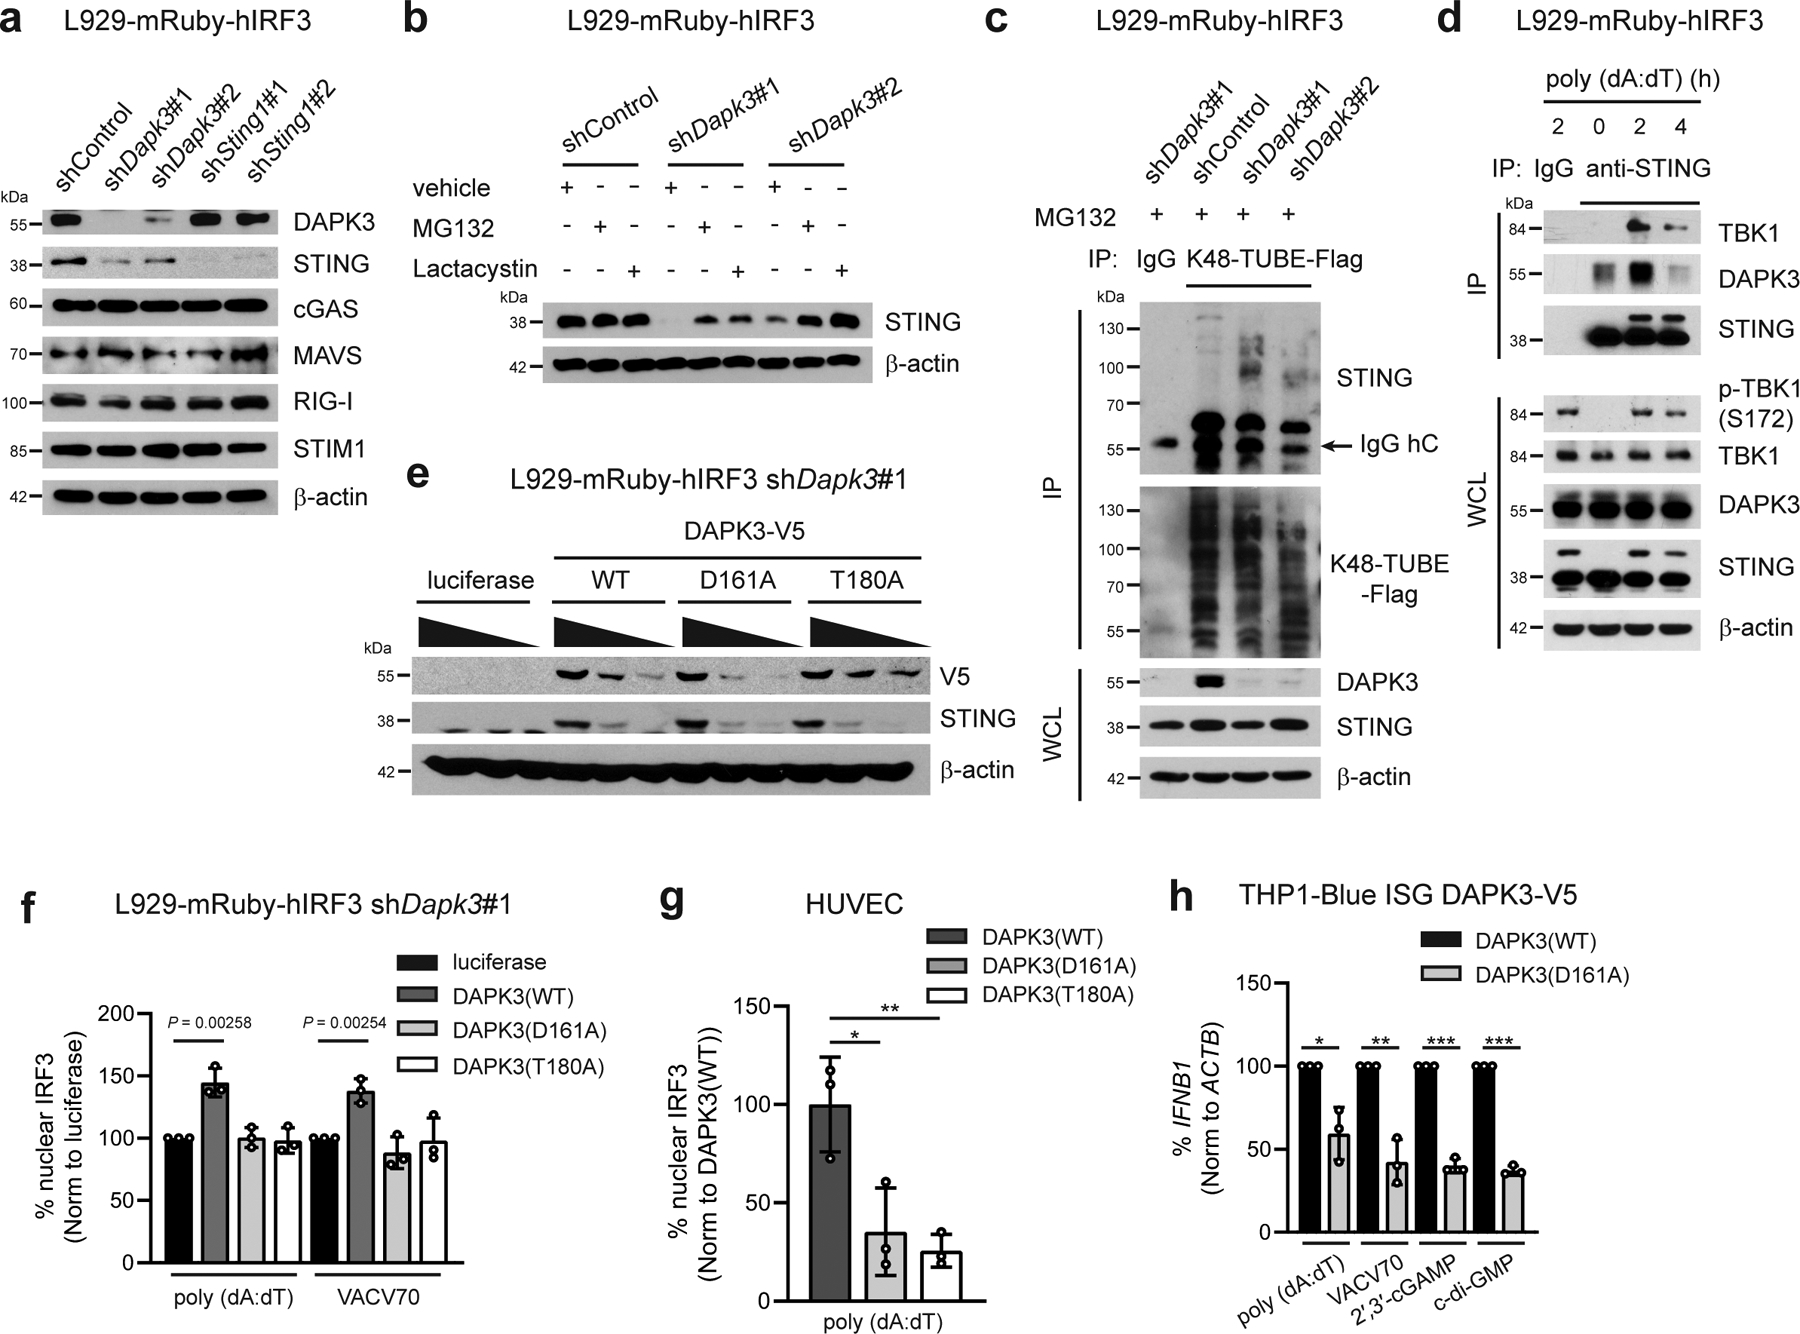
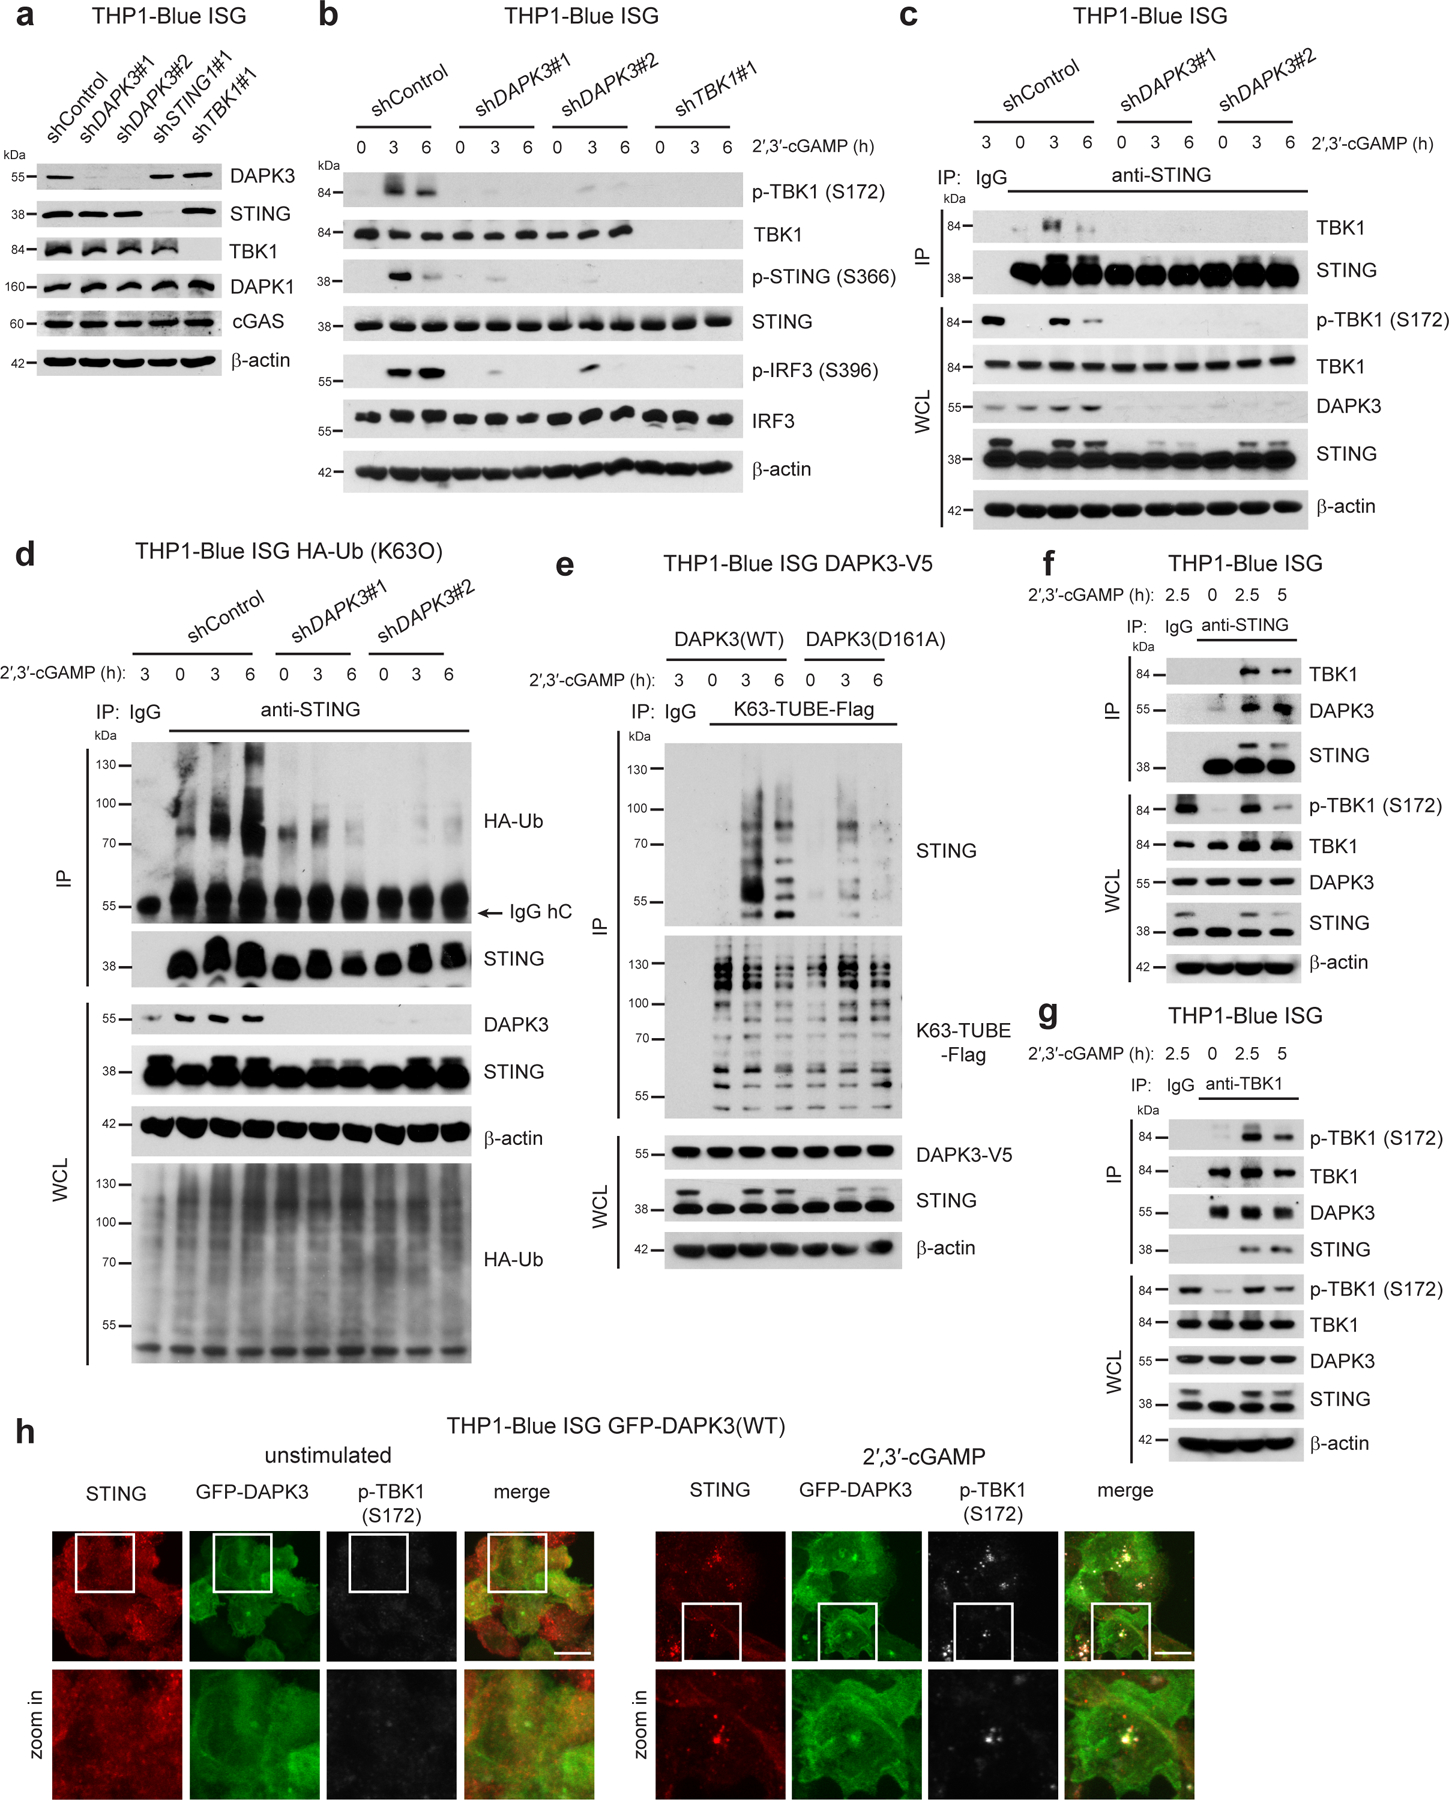
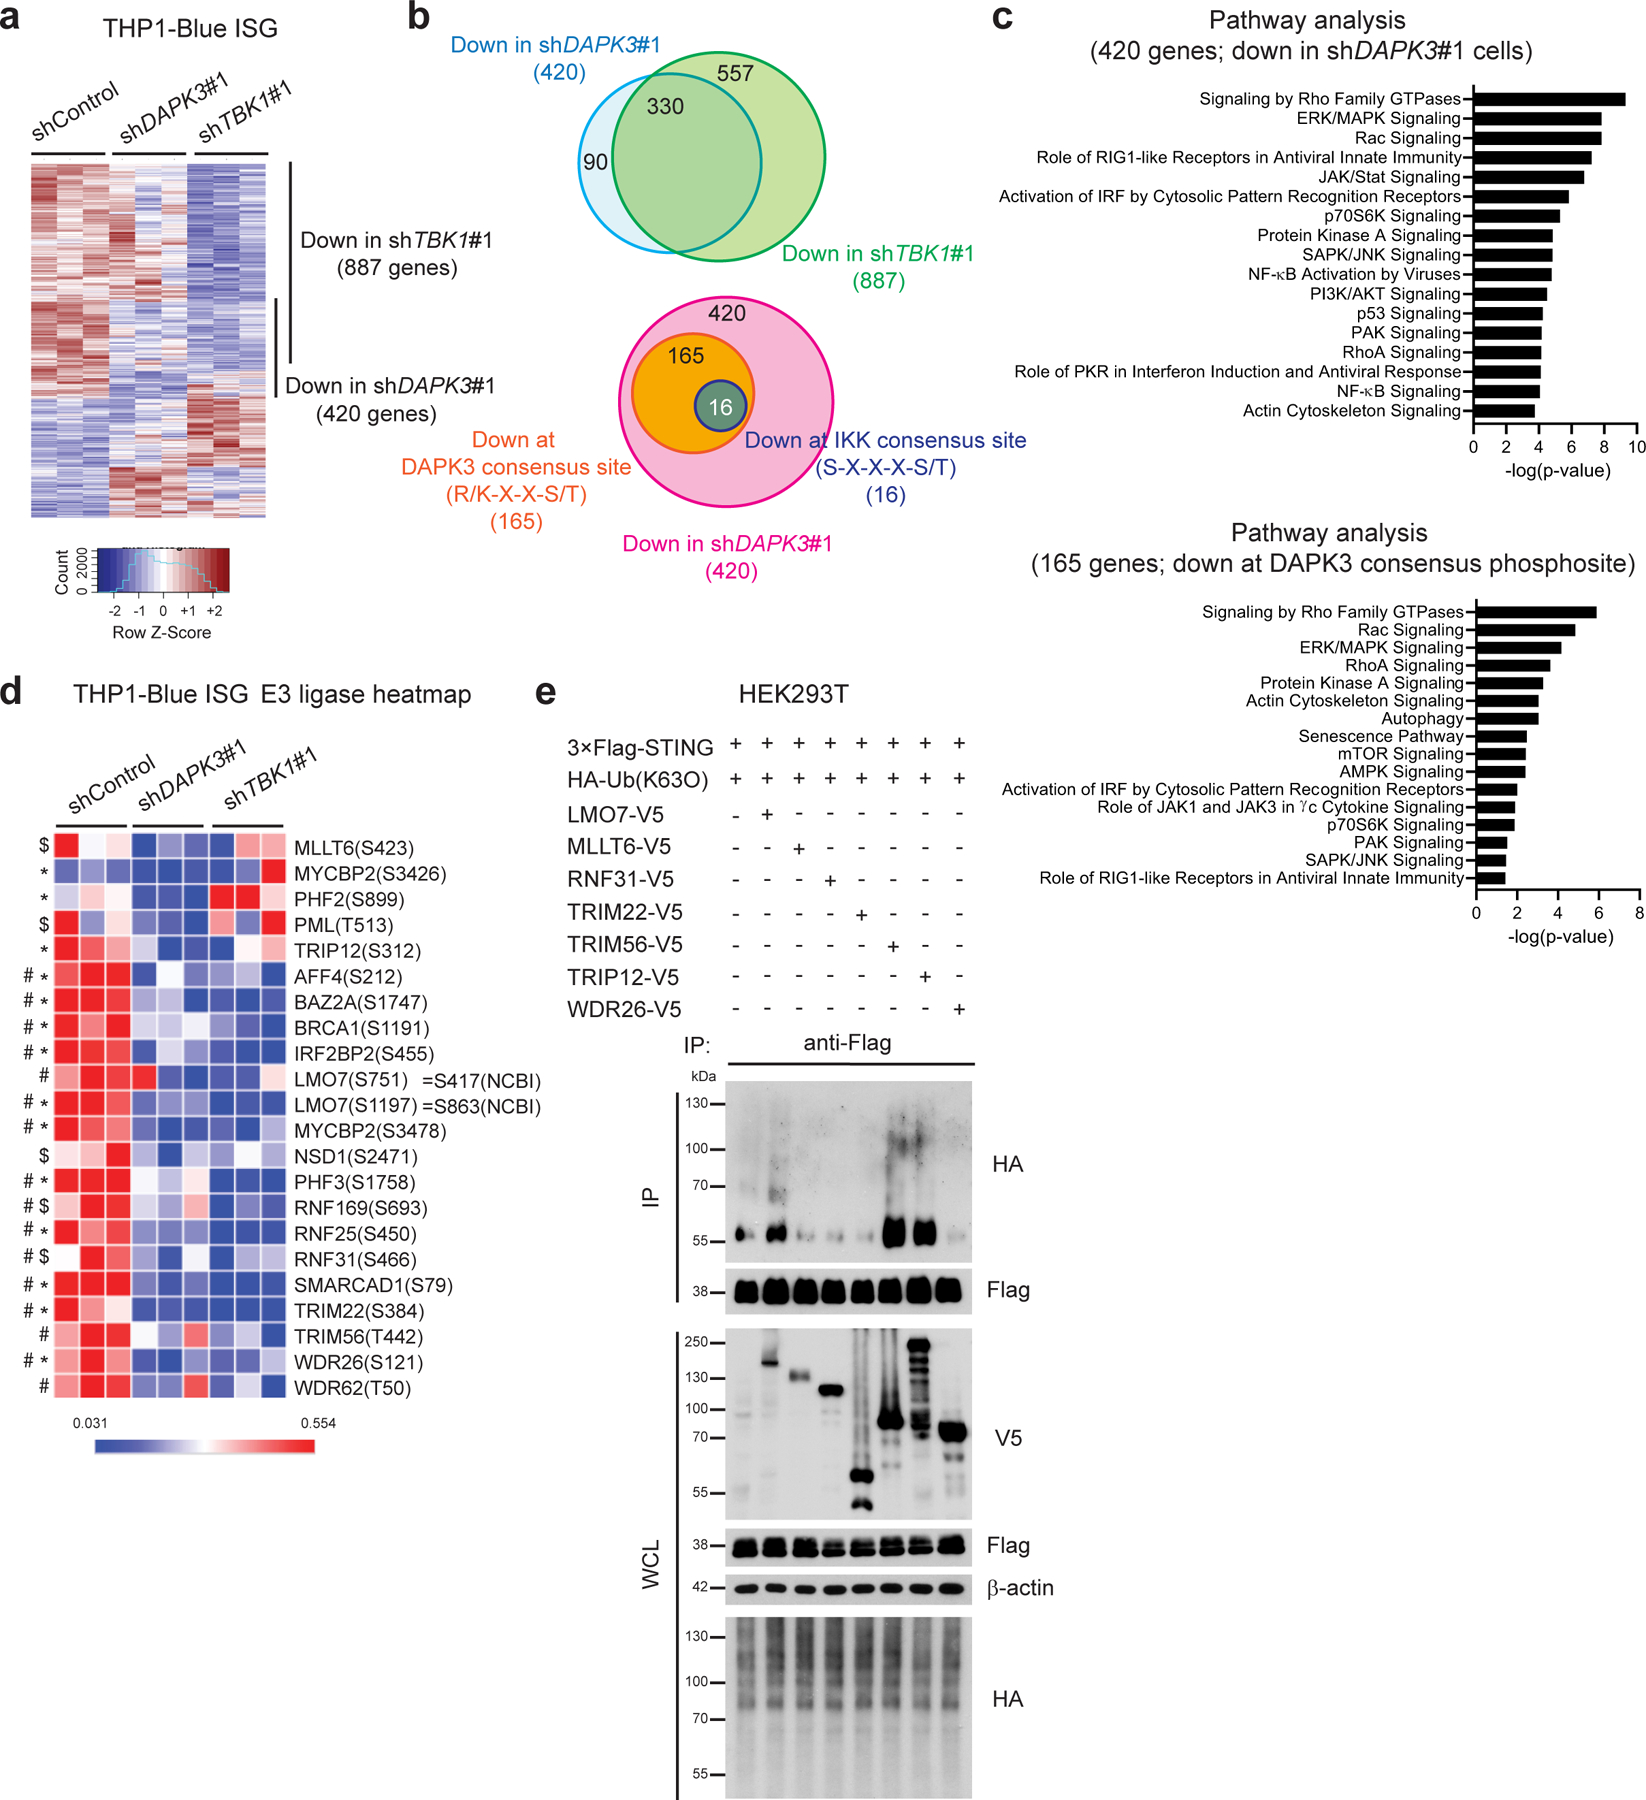
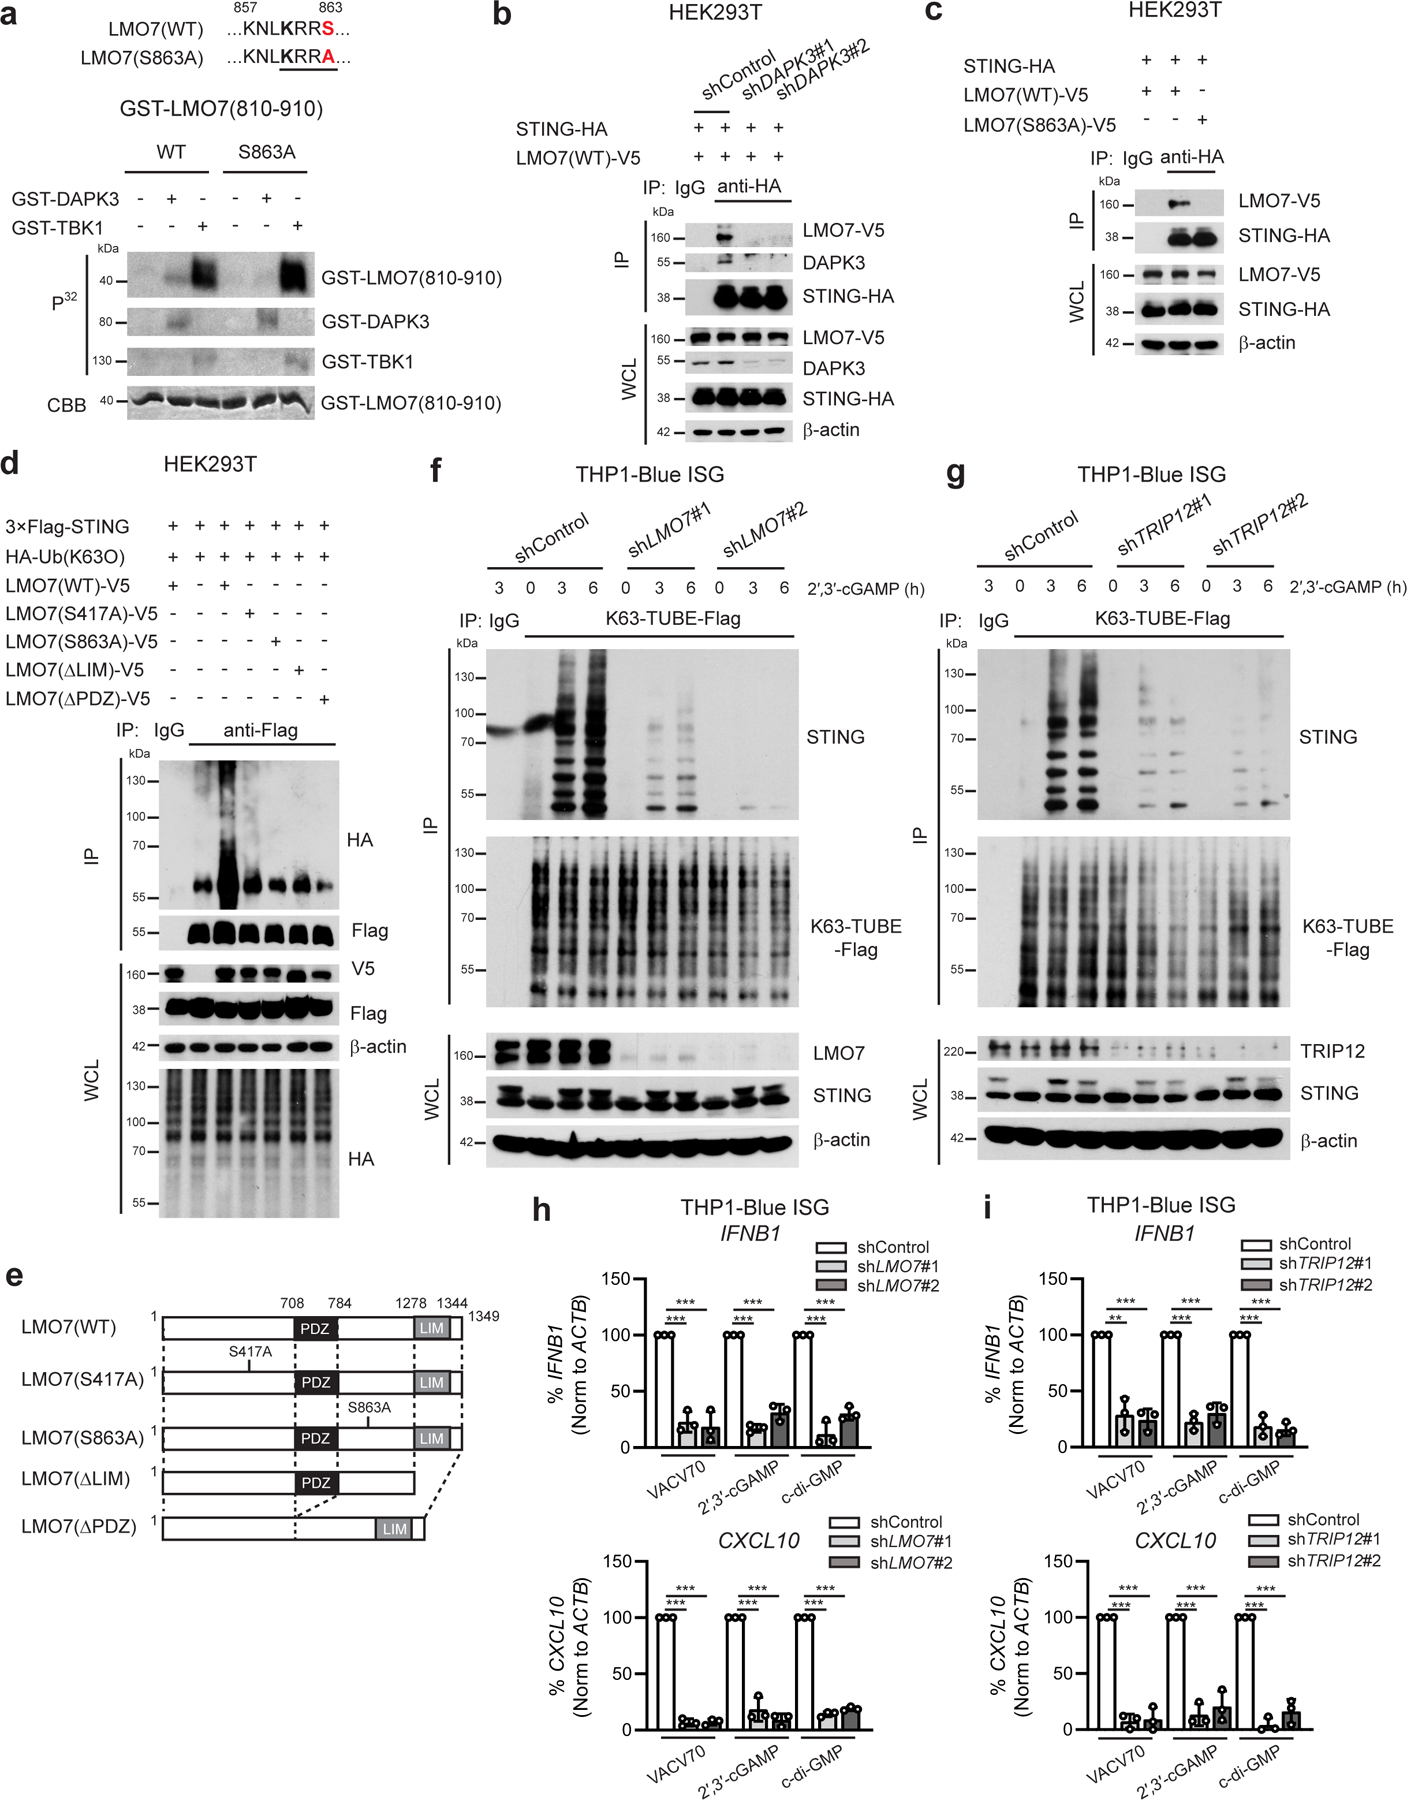
Evasion of host immunity is a hallmark of cancer; however, mechanisms linking oncogenic mutations and immune escape are incompletely understood. Through loss-of-function screening of 1,001 tumor suppressor genes, we identified death-associated protein kinase 3 (DAPK3) as a previously unrecognized driver of anti-tumor immunity through the stimulator of interferon genes (STING) pathway of cytosolic DNA sensing. Loss of DAPK3 expression or kinase activity impaired STING activation and interferon (IFN)-β-stimulated gene induction. DAPK3 deficiency in IFN-β-producing tumors drove rapid growth and reduced infiltration of CD103+CD8α+ dendritic cells and cytotoxic lymphocytes, attenuating the response to cancer chemo-immunotherapy. Mechanistically, DAPK3 coordinated post-translational modification of STING. In unstimulated cells, DAPK3 inhibited STING K48-linked poly-ubiquitination and proteasome-mediated degradation. After cGAMP stimulation, DAPK3 was required for STING K63-linked poly-ubiquitination and STING-TANK-binding kinase 1 interaction. Comprehensive phospho-proteomics uncovered a DAPK3-specific phospho-site on the E3 ligase LMO7, critical for LMO7-STING interaction and STING K63-linked poly-ubiquitination. Thus, DAPK3 is an essential kinase for STING activation that drives tumor-intrinsic innate immunity and tumor immune surveillance.


Conflict of interest statement

Competing interests

The authors state that they have no competing interests. Correspondence and requests for materials should be addressed to S.S. (soniasharma@lji.org).

Figures

Extended Data Fig. 1
Extended Data Fig. 1. DAPK3 is a positive regulator of STING signaling and some TLR pathways.
a, Schematic representation of the RNAi screen for IRF3 nuclear translocation. b, Immunostaining of IRF3 in HUVEC stimulated with poly (dA:dT) (1 μg/ml) (right panel) for 3 h. Scale bar, 100 μm. c, d, qRT-PCR of DAPK1/Dapk1, DAPK2/Dapk2, and DAPK3/Dapk3 in (c) human and (d) mouse cell lines. #, Not detected. e, Images of IRF3 localization in L929-mRuby-hIRF3 stimulated with poly (dA;dT) (1 μg/ml) for 3 h. Scale bar, 100 μm. f, g, (f) qRT-PCR of IFNB1 and (g) immunoblot of HUVEC transfected with indicated siRNA. h, i, (h) qRT-PCR of Ifnb1 and (i) immunoblot of BMDM transfected with indicated siRNA. (f, h) Cells were stimulated with poly (dA:dT) (0.2 μg/ml) for 4 h. j, k, (j) qRT-PCR of Il6 in L929-mRuby-hIRF3 and (k) IL6 inTHP1-Blue ISG transduced with indicated shRNA and stimulated as indicated in Fig. 1g–l. l, m, qRT-PCR of (l) Ifnb1 in L929-mRuby-hIRF3 and (m) IFNB1 inTHP1-Blue ISG transduced with indicated shRNA and transfected with poly (I:C)(LMW) and poly (I:C)(HMW)(0.1 μg/ml for L929-mRuby-hIRF3, 0.5 μg/ml for THP1-Blue ISG). n, o, qRT-PCR of (n) IFNB1 and (o) IL6 in THP1-Blue ISG transduced with indicated shRNA and stimulated with FSL-1(100 ng/ml), naked poly (I:C)(LMW)(10 μg/ml), or LPS(100 ng/ml) for 4 h. p, q, Immunoblot of (p) THP1-Blue ISG and (q) L929-mRuby-hIRF3 transduced with indicated shRNA. Data in (b-e, g, i, p, q) are representative or (f, h, j-o) the mean of three independent experiments. Values represent mean ± s.d. *P<0.05, **P<0.01, and ***P<0.001. Statistical comparisons were conducted using two-tailed t-test (f, h, j-o).
Extended Data Fig. 2
Extended Data Fig. 2. Association of DAPK3 with outcomes in human cancer.
Kaplan-Meier survival analysis of pancreatic adenocarcinoma, uterine corpus endometrial carcinoma, and esophageal carcinoma comparing the top (high) and bottom (low) tertiles of patients with respect to DAPK3 expression levels as reported by TCGA data portal. Statistical comparisons were conducted using two-sided log-rank test.
Extended Data Fig. 3
Extended Data Fig. 3. Teniposide and paclitaxel induce micronuclei formation and anti-tumor immunity to B16F10 tumors in a type I IFN signaling-dependent manner.
a, b, (Left) Immunoblot and (right) in vitro cell growth of (a) MCA205 and (b) B16F10 transduced with indicated shRNA. c, Flow cytometry of tumor-infiltrating CD8+T cells and CD103+CD8α+DCs in MCA205 tumor suspensions isolated from WT or Ifnar1-KO mice on Day 6 (n=6 per group). d, Confocal fluorescence microscopy of MCA205 stably expressing cGAS-Clover. Scale bar, 10 μm. e, qRT-PCR of Ifnb1 in unstimulated MCA205 and B16F10 transduced with indicated shRNA. f, (Left) Immunoblot and (right) qRT-PCR of Ifnb1 in shDapk3#1-transduced MCA205 ectopically expressing V5-tagged DAPK3(WT) or DAPK3(D161A). Cells were stimulated with 2′,3′-cGAMP, 3′,3′-cGAMP, c-di-GMP (20 μg/ml for all three agonists) or DMXAA (50 μg/ml) for 4 h. g, Confocal fluorescence microscopy of B16F10 stably expressing cGAS-Clover. Cells were treated with teniposide (10 μM) for 24 h or paclitaxel (100 nM) for 72 h. Scale bar, 10 μm. h, (Left) Apoptosis measured in shRNA-transduced B16F10 treated with teniposide (10 μM) for 24 h or (right) paclitaxel (100 nM) for 48 h. i, Tumor volume of B16F10 subcutaneously transplanted into WT and Ifnar1-KO mice and treated with teniposide or paclitaxel (n=6 for vehicle, n=7 for teniposide and paclitaxel). Tumor size on Day 15 is represented (right panel). Data are representative (a-d, g-i) or the mean (a, b, e, f) of three independent experiments. Values represented mean ± s.d. *P<0.05, **P<0.01, and ***P<0.001. Statistical comparisons were conducted using two-tailed t-test (a-c, e, f, h, i).
Extended Data Fig. 4
Extended Data Fig. 4. Flow cytometry gating strategy for tumor-infiltrating leukocytes.
Tumor single cell suspensions were stained with different fluorophore-conjugated antibodies and analyzed by flow cytometry.
Extended Data Fig. 5
Extended Data Fig. 5. DAPK3 does not directly phosphorylate STING or TBK1.
a-d, (a) qRT-PCR of Sting1 and Dapk3, (b) immunoblot, (c) IRF3 nuclear translocation, and (d) p65 nuclear translocation in L929-mRuby-hIRF3 transduced with indicated shRNA stimulated with poly (dA:dT) (0.5 μg/ml) or VACV70 (2 μg/ml) for 3 h. e, Immunoblot of L929-mRuby-hIRF3 transfected with indicated siRNA. f, Immunoblot of L929-mRuby-hIRF3 transduced with indicated shRNA stimulated with VACV70 (2 μg/ml) for 2 h and 4 h. g, Immunoblot of HUVEC stably expressing V5-tagged DAPK3(D161A), DAPK3(T180A), or luciferase. Cells were infected at MOI=5, 2, or 1. h, Immunoblot of THP1-Blue ISG stably expressing V5-tagged DAPK3(WT) or DAPK3(D161A). i, qRT-PCR of Ifnb1 in L929-mRuby-hIRF3 pre-treated with DAPK inhibitors for 3 h prior to 2′,3′-cGAMP stimulation (10 μg/ml) for 4 h. j, qRT-PCR of IFNB1 in THP1-Blue ISG pre-treated with DAPK inhibitors (50 μM) for 6 h prior to 2′,3′-cGAMP or c-di-GMP stimulation (10 μg/ml for both) for 4 h. k, l, In vitro kinase assay of (k) GST-tagged human STING C-terminus (aa 149-379) and (l) GST-tagged human TBK1(K38M). Peptides were incubated with GST-tagged DAPK3 or TBK1 in the presence of [γ-32P] ATP. Data in (b, e-h, k, l) are representative or (a, c, d, i, j) mean of three independent experiments. Values represent mean ± s.d. *P<0.05, **P<0.01, and ***P<0.001. Statistical comparisons were conducted using two-tailed t-test (a, c, d, i, j).
Extended Data Fig. 6
Extended Data Fig. 6. DAPK3 is not involved in STING trafficking from ER to Golgi.
a, Confocal fluorescence microscopy of THP1-Blue ISG transduced with indicated shRNA and unstimulated or stimulated with 2′,3′-cGAMP (25 μg/ml) for 3 h. Scale bar, 15 μm. b, (Upper) Co-localization of STING/Calreticulin and (lower) STING/GM130 analyzed using Image J software. Data are pooled from three independent experiments (n>1,500 cells for unstimulated 32 images and cGAMP-stimulated 73 images). c, (Upper) Confocal fluorescence microscopy of THP1-Blue ISG stably expressing GFP-tagged DAPK3(WT) unstimulated or stimulated with 2′,3′-cGAMP (50 μg/ml) for 3 h. Localization of GFP-DAPK3, STING, and TBK1. (Lower) Co-localization of GFP-DAPK3/TBK1, GFP-DAPK3/STING, and TBK1/STING was analyzed using Image J software. Data are pooled from three independent experiments (n>1,500 cells for unstimulated and cGAMP-stimulated 70 images). Scale bars, 15 μm. d, Schematic representation of human STING mutants. e, (Upper) Immunoprecipitation and immunoblot of HEK293T transfected with plasmid encoding HA-tagged human STING (WT, 1-379), phospho-deficient mutant (3S-3A), or C-terminal deletion mutant (aa 1-340) unstimulated or stimulated with 2′,3′-cGAMP (5 μg/ml) for 2 h, and (lower) immunoblot of whole cell lysates (WCL). Values represented as mean ± s.d. Data in (a, c, e) are representative of three independent experiments.
Extended Data Fig. 7
Extended Data Fig. 7. Phosphorylation of TRIP12 on S312 or TRIM56 on T442 are not involved in STING K63-linked poly ubiquitination.
a, Primary RNAi screen of E3 ligases in THP1-Blue ISG transfected with indicated siRNA. SEAP activity was measured after normalization with CellTiter-Glo. Black; siControl, Blue; previously reported E3 ligases for K63-linked poly-ubiquitination of STING, Red; positive control (e.g. siSTING1 and siTBK1). siTRIM56 value was used for determining cut-off. b, Secondary RNAi screen of E3 ligases in THP1-Blue ISG transfected with indicated siRNA. qRT-PCR of IFNB1 was performed. #; candidates for subsequent analysis. c, d, In vitro kinase assay of (c) GST-tagged human TRIP12 peptide (aa 260-360) and (d) GST-tagged human TRIM56 peptide (aa 400-500). Peptides were incubated with GST-tagged DAPK3 or TBK1 in the presence of [γ-32P] ATP. e, Schematic representation of human TRIP12 mutants. f, (Upper) Immunoprecipitation and immunoblot of HEK293T transfected with plasmids encoding HA-tagged human STING and V5-tagged human TRIP12 (WT) or phospho-deficient TRIP12 (S312A), and (lower) immunoblot of whole cell lysates (WCL). g, (Upper) Immunoprecipitation and immunoblot of HEK293T transfected with plasmids encoding 3×Flag-tagged human STING, HA-tagged Ub(K63O), and V5-tagged human TRIP12(WT), phospho-deficient TRIP12(S312A), or HECT domain-deficient TRIP12(ΔHECT), and (lower) immunoblot of WCL. h, (Upper) Immunoprecipitation and immunoblot of HEK293T transfected with plasmids encoding 3×Flag-tagged human STING, HA-tagged Ub(K63O), and V5-tagged human TRIM56(WT), phospho-deficient TRIM56(T442A), or enzyme-inactive TRIM56(C24S), and (lower) immunoblot of WCL. Data in (c, d, f-h) are representative of three independent experiments. Values represent mean ± s.d. *P<0.05, **P<0.01, and ***P<0.001 (compared to siControl) (a, b). Statistical comparisons were conducted using two-tailed t-test (a, b).
Extended Data Fig. 8
Extended Data Fig. 8. DAPK3, LMO7, and TRIP12 are highly mutated in human cancers.
a-c, Genomic alterations of (a) DAPK3, (b) LMO7 and (c) TRIP12 in human cancers from cBioportal.
Extended Data Fig. 9
Extended Data Fig. 9. LMO7 and TRIP12 are positive regulators of STING-IFNβ signaling in THP1 and HUVEC.
a, In vitro kinase assay of GST-tagged human LMO7 (aa 360-460). Peptides were incubated with GST-tagged DAPK3 or TBK1 in the presence of [γ-32P] ATP. b, (Upper) Immunoprecipitation and immunoblot of HEK293T transduced with indicated shRNA prior to transfection with plasmids encoding 3×Flag-tagged human STING, HA-tagged Ub(K63O), and V5-tagged human LMO7(WT) and (lower) immunoblot of whole cell lysates (WCL). c, (Upper) Immunoblot of THP1-Blue ISG transduced with two distinct shLMO7 or (lower) shTRIP12 sequences. d, (Upper) Immunoprecipitation and immunoblot of THP1-Blue ISG transduced with indicated shRNA and stimulated with 2′,3′-cGAMP (10 μg/ml) for 3 h and 6 h, and (lower) immunoblot of WCL. e, f, Immunoblot of THP1-Blue ISG transduced with two distinct (e) shLMO7 or (f) shTRIP12 sequences and stimulated with 2′,3′-cGAMP (10 μg/ml) for 3 h and 6 h. g, h, Immunoblot of (g) THP1-Blue ISG and (h) HUVEC transfected with indicated siRNA. i, j, qRT-PCR of IFNB1 and CXCL10 in (i) THP1-Blue ISG and (j) HUVEC transfected with indicated siRNA stimulated with VACV70 (2 μg/ml), 2′,3′-cGAMP (10 μg/ml), and c-di-GMP (10 μg/ml). Data in (a-h) are representative or (i, j) mean of three independent experiments. Values represent mean ± s.d. *P<0.05, **P<0.01, and ***P<0.001. Statistical comparisons were conducted using two-tailed t-test (i, j).
Extended Data Fig. 10
Extended Data Fig. 10. Schematic model of the DAPK3-STING axis.
In unstimulated cells (L929 and MCA205), DAPK3 maintains steady-state STING levels by inhibiting STING K48-linked poly-ubiquitination and proteasome-mediated degradation. In DNA-stimulated cells (THP1), DAPK3 promotes STING activation by phosphorylating the E3 ligase LMO7 at S863, enabling LMO7-STING interaction, STING K63-linked poly-ubiquitination, and recruitment of TBK1.
Fig. 1 |
Fig. 1 |. DAPK3 regulates DNA-stimulated STING signaling.
a, RNAi screen of 1,001 tumor suppressor genes in HUVEC, represented as ranked mean Z-score for poly (dA:dT)-induced IRF3 nuclear translocation (0.5 μg/ml) for 3 h. b, c, IRF3 nuclear translocation in (b) HUVEC and (c) L929-mRuby-hIRF3 stimulated with poly (dA:dT) (0.5 μg/ml), VACV70 (2 μg/ml), 2′,3′-cGAMP (10 μg/ml) or infected with hCMV (MOI=5) (b) for 3 h. d-f, qRT-PCR of (d) IFNB1, (e) CXCL10 and (f) CCL5 in HUVEC transfected with indicated siRNA and stimulated with poly (dA:dT) (0.5 μg/ml), VACV70 (2 μg/ml), 2′,3′-cGAMP (10 μg/ml), or infected with hCMV (MOI=5) for 4 h. g-i, qRT-PCR of (g) Ifnb1, (h) Cxcl10, and (i) Mx2 in L929-mRuby-hIRF3 transfected with indicated siRNA and stimulated with poly (dA:dT) (0.5 μg/ml), VACV70 (2 μg/ml), 2′,3′-cGAMP (10 μg/ml) for 4 h. j-l, qRT-PCR of (j) IFNB1, (k) CXCL10 and (l) CCL5 in THP1-Blue ISG transduced with indicated shRNA and stimulated with poly (dA:dT) (0.5 μg/ml), VACV70 (2 μg/ml), 2′,3′-cGAMP (10 μg/ml) for 4 h. m, n, qRT-PCR of Ifnb1 in (m) MCA205 and (n) B16F10 transduced with the indicated shRNA and stimulated with 2′,3′-cGAMP (10 μg/ml), 3′,3′-cGAMP (10 μg/ml) or DMXAA (50 μg/ml) for 4 h. mRNA levels were normalized to values of ACTB (human) and Rn18s or Actb (mouse), and percent expression calculated from stimulated control values. Data in (b-n) represent the mean of three independent experiments. Values represent mean ± s.d. *P<0.05, **P<0.01, and ***P<0.001. Statistical comparisons were conducted using two-tailed t-test (b-n).
Fig. 2 |
Fig. 2 |. Tumor-expressed DAPK3 shapes immune surveillance.
a, b, Tumor volume of shRNA-transduced (a) MCA205 and (b) B16F10 subcutaneously transplanted into C57BL/6J wild type (WT) mice (n=8 per group). c, Flow cytometry of tumor-infiltrating leukocytes in MCA205 tumor suspensions isolated from WT mice on Day 6 (n=7 for shControl, n=8 for shDapk3#1 and shSting1#1). d, Tumor volume of shRNA-transduced MCA205 subcutaneously transplanted into WT and Ifnar1-KO mice (n=8 per group). Tumor size on Day 18 is represented (right panel). e, Tumor volume of shDapk3#1-transduced MCA205 rescued with lentiviral DAPK3 (WT) or DAPK3 (D161A) prior to sub-cutaneous transplantation into WT mice and Ifnar1-KO mice (n=8 per group). f, Flow cytometry of intracellular pTBK1 and pIRF3 in MCA205-GFP tumor cells (CD45GFP+) and tumor-infiltrating DCs (CD45+CD11bCD11c+) in MCA205-GFP tumor suspensions isolated from WT mice on Day 6 (n=6 per group). Values represent percentage of each total cell population. Data in (a-f) are representative of three independent experiments. Values represent mean ± s.d. *P<0.05, **P<0.01, and ***P<0.001. Statistical comparisons were conducted using two-tailed t-test (a-f).
Fig. 3 |
Fig. 3 |. DAPK3 regulates response to cancer chemo-immunotherapy.
a, (Left) Tumor volume of shRNA-transduced B16F10 subcutaneously transplanted into WT (n=7 per group) or (right) STINGgt/gt mice (n=6 per group) treated using intratumoral injection of 3′,3′-cGAMP. cGAMP injections were performed on Day 6 in WT mice (5 μg per mouse), and Days 6 and 9 in STINGgt/gt mice (10 μg per mouse). b, c, qRT-PCR of Ifnb1, Cxcl10 or Il6 in shRNA-transduced B16F10 treated with (b) teniposide (10 μM) for 24 h or (c) paclitaxel (100 nM) for 48 h. d, e, Immunoblot of shRNA-transduced B16F10 treated with (d) teniposide (10 μM) for 12 h or (e) paclitaxel (1 μM) for 12 h (p-STAT1, STAT1, DAPK3, and STING) or 72 h (p-p65 and p65). Data from two gels are presented (d, e). f-k, Tumor volume of shRNA-transduced B16F10 subcutaneously transplanted into WT mice and treated with indicated chemical and antibody (n=6 per group). l, (Upper) Flow cytometry of tumor-infiltrating CD8+T cells and (lower) CD103+CD8α+DCs in B16F10 tumor suspensions isolated from WT mice on Day 10 (n=4 for vehicle, n=6 for teniposide-shControl and shDapk3#1, n=7 for teniposide-shSting1#1 and paclitaxel). m, Flow cytometry of intracellular pTBK1 and pIRF3 in B16F10-GFP tumor cells (CD45GFP+) and tumor-infiltrating DCs (CD45+CD11bCD11c+) in B16F10-GFP tumor suspensions isolated from WT mice on Day 10. Values represent percentage of each total cell population. Data in (a, d-m) are representative of or (b, c) are the mean of three independent experiments. Values represent mean ± s.d. *P<0.05, **P<0.01, and ***P<0.001. Statistical comparisons were conducted using two-tailed t-test (a-c, f-m).
Fig. 4 |
Fig. 4 |. DAPK3 inhibits STING K48-linked poly-ubiquitination.
a, Immunoblot of L929-mRuby-hIRF3 transduced with indicated shRNA. Data from two gels are presented. b, Immunoblot of L929-mRuby-hIRF3 transduced with indicated shRNA treated with MG132 (20 μM), Lactacystin (5 μM), or vehicle for 4 h. c, (Upper) Immunoprecipitation and immunoblot of L929-mRuby-hIRF3 transduced with indicated shRNA treated with MG132 (20 μM) for 4 h, and (lower) immunoblot of whole cell lysates (WCL). Endogenous K48-linked poly-ubiquitination chains were immunoprecipitated using K48-TUBE-Flag. d, (Upper) Immunoprecipitation and immunoblot of L929-mRuby-hIRF3 with or without poly (dA:dT) stimulation for 2 h and 4 h and (lower) immunoblot of WCL. e, f, (e) Immunoblot and (f) IRF3 nuclear translocation in shDapk3#1-transduced L929-mRuby-hIRF3 expressing V5-tagged DAPK3(WT), DAPK3(D161A), or DAPK3(T180A). For (e), lentiviral transduction of V5-tagged DAPK3 was performed at MOI=5, 2, or 1. For (f), cells were stimulated with poly (dA:dT) (0.5 μg/ml) and VACV70 (2 μg/ml) for 3 h. g, IRF3 nuclear translocation in HUVEC expressing V5-tagged DAPK3(WT), DAPK3(D161A), and DAPK3(T180A) stimulated with poly (dA:dT) (0.5 μg/ml) for 3 h. Nuclear IRF3-positive cells were counted in >200 V5-positive single-cells in biological replicate wells. h, qRT-PCR of IFNB1 in THP1-Blue ISG ectopically expressing V5-tagged DAPK3(WT) or DAPK3(D161A) stimulated with poly (dA:dT) (0.5 μg/ml), VACV70 (2 μg/ml), 2′,3′-cGAMP (10 μg/ml), or c-di-GMP (10 μg/ml) for 4 h. Data in (a-e, g) are representative of (f, h) or are the mean of three independent experiments. Values represent mean ± s.d. *P<0.05, **P<0.01, and ***P<0.001. Statistical comparisons were conducted using two-tailed t-test (f, h).
Fig. 5 |
Fig. 5 |. DAPK3 promotes STING K63-linked poly-ubiquitination.
a, Immunoblot of THP1-Blue ISG transduced with indicated shRNA. b, Immunoblot of THP1-Blue ISG transduced with indicated shRNA and stimulated with 2′,3′-cGAMP (10 μg/ml) for 3 h and 6 h. c, (Upper) Immunoprecipitation and immunoblot of THP1-Blue ISG transduced with indicated shRNA stimulated with 2′,3′-cGAMP (10 μg/ml) for 3h and 6 h, and (lower) immunoblot of whole cell lysates (WCL). d, (Upper) Immunoprecipitation and immunoblot of shRNA-transduced THP1-Blue ISG stably expressing HA-Ub(K63O) stimulated with 2′,3′-cGAMP (10 μg/ml) for 3 h and 6 h, and (lower) immunoblot of WCL. e, (Upper) Immunoprecipitation and immunoblot of THP1-Blue ISG stably expressing DAPK3(WT) or DAPK3(D161A) stimulated with 2′,3′-cGAMP (10 μg/ml) for 3 h and 6 h, and (lower) immunoblot of WCL. Endogenous K63-linked poly-ubiquitin chains were immunoprecipitated using K63-TUBE-Flag. f, g, (Upper) Immunoprecipitation and immunoblot of THP1-Blue ISG stimulated with 2′,3′-cGAMP (10 μg/ml) for 2.5 h and 5 h, and (lower) immunoblot of WCL. (f) Anti-STING antibody or (g) anti-TBK1 antibody was used for immunoprecipitation. h, Confocal fluorescence microscopy of THP1-Blue ISG stably expressing GFP-tagged DAPK3(WT) unstimulated or stimulated with 2′,3′-cGAMP (50 μg/ml) for 3 h. Localization of GFP-DAPK3, STING, and phospho-TBK1 examined. Scale bars, 10 μm. Data in (a-h) are representative of three independent experiments.
Fig. 6 |
Fig. 6 |. Phospho-proteomic profiling uncovers DAPK3 targets.
a, Heat map of phosphosites in shControl, shDAPK3#1 or shTBK1#1-transduced THP1-Blue ISG upon 2′,3′-cGAMP stimulation (10 μg/ml) for 3 h. b, (Upper) Overlap of hypo-phosphorylated proteins (330) detected in shDAPK3#1 cells (420) and shTBK1#1 cells (887), and (lower) 165 proteins hypo-phosphorylated at DAPK3 consensus phosphorylation site (R/K-X-X-S/T), of which 16 proteins showed overlap hypo-phosphorylation at IKK consensus site (S-X-X-X-S/T). (c) Ingenuity Pathway Analysis (IPA) of (Upper) 420 genes encoding proteins hypo-phosphorylated in shDAPK3#1 cells, and (lower) 165 genes encoding proteins hypo-phosphorylated at DAPK3 consensus phosphorylation site in shDAPK3#1 cells. (d) Heat map of E3 ligases phosphorylated at DAPK3 consensus site. Amino acids numbering is based upon UniProt ID, and S751 and S1197 of LMO7 correspond to S417 and S863, respectively, of the NCBI ID. *P<0.05, log2FC<−0.4 for shDAPK3#1, $P<0.1, log2FC<−0.4 for shDAPK3#1, #P<0.05, log2FC<−0.4 for shTBK1#1. (e) (Upper) Immunoprecipitation and immunoblot of HEK293T transfected with plasmids encoding 3×Flag-tagged human STING, HA-tagged Ub(K63O) and V5-tagged human E3 ligase, and (lower) immunoblot of whole cell lysates (WCL). Data in (e) are representative of four independent experiments. Statistical comparisons were conducted using two-tailed t-test (d).
Fig. 7 |
Fig. 7 |. DAPK3 phosphorylation of LMO7 is necessary for STING K63-linked poly-ubiquitination.
a, In vitro kinase assay of GST-tagged human LMO7 (aa 810-910). Peptides were incubated with GST-tagged DAPK3 or TBK1 in the presence of [γ-32P] ATP. b, (Upper) Immunoprecipitation and immunoblot of HEK293T transduced with indicated shRNA prior to transfection with plasmids encoding HA-tagged human STING and V5-tagged human LMO7(WT) and (lower) immunoblot of whole cell lysates (WCL). c, (Upper) Immunoprecipitation and immunoblot of HEK293T transfected with plasmids encoding HA-tagged human STING and V5-tagged human LMO7(WT) or phosphor-deficient LMO7 (S863A) and (lower) immunoblot of WCL. d, (Upper) Immunoprecipitation and immunoblot of HEK293T transfected with plasmids encoding 3×Flag-tagged human STING, HA-tagged Ub(K63O), and V5-tagged human LMO7 mutants, and (lower) immunoblot of WCL. e, Schematic representation of human LMO7 mutants. f, g, (Upper) Immunoprecipitation and immunoblot of THP1-Blue ISG transduced with two distinct (f) shLMO7 or (g) shTRIP12 and stimulated with 2′,3′-cGAMP (10 μg/ml) for 3 h and 6 h, and (lower) immunoblot of WCL. Endogenous K63-linked poly-ubiquitin chains were immunoprecipitated using K63-TUBE-Flag. h, i, qRT-PCR analysis of IFNB1 and CXCL10 in THP1-Blue ISG transduced with two distinct (h) shLMO7 sequences or (i) shTRIP12 sequences and stimulated with VACV70 (4 μg/ml), 2′,3′-cGAMP (10 μg/ml), or c-di-GMP (10 μg/ml) for 4 h. Data in (a-d, f, g) are representative of or (h, i) the mean of three independent experiments. Values represent mean ± s.d. *P<0.05, **P<0.01, and ***P<0.001. Statistical comparisons were conducted using two-tailed t-test (h, i).

References

    1. Zitvogel L, Galluzzi L, Kepp O, Smyth MJ & Kroemer G Type I interferons in anticancer immunity. Nat Rev Immunol 15, 405–414 (2015). - PubMed
    1. Vanpouille-Box C, Demaria S, Formenti SC & Galluzzi L Cytosolic DNA Sensing in Organismal Tumor Control. Cancer Cell 34, 361–378 (2018). - PubMed
    1. Kwon J & Bakhoum SF The Cytosolic DNA-Sensing cGAS-STING Pathway in Cancer. Cancer Discov 10, 26–39 (2020). - PMC - PubMed
    1. Chen Q, Sun L & Chen ZJ Regulation and function of the cGAS-STING pathway of cytosolic DNA sensing. Nat Immunol 17, 1142–1149 (2016). - PubMed
    1. Corrales L, McWhirter SM, Dubensky TW Jr. & Gajewski TF The host STING pathway at the interface of cancer and immunity. The Journal of Clinical Investigation 126, 2404–2411 (2016). - PMC - PubMed

Publication types

MeSH terms