. 2021 May;18(5):1235-1248.
doi: 10.1038/s41423-021-00668-x. Epub 2021 Mar 25.

miR-23a/b suppress cGAS-mediated innate and autoimmunity

Affiliations

miR-23a/b suppress cGAS-mediated innate and autoimmunity

Qiuya Yu et al. Cell Mol Immunol. 2021 May.

Abstract

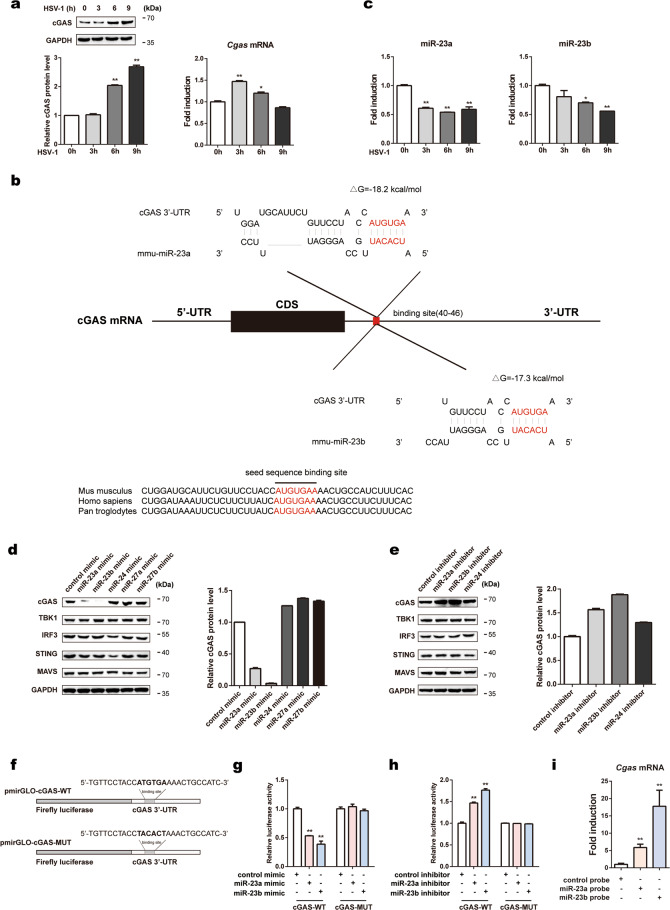
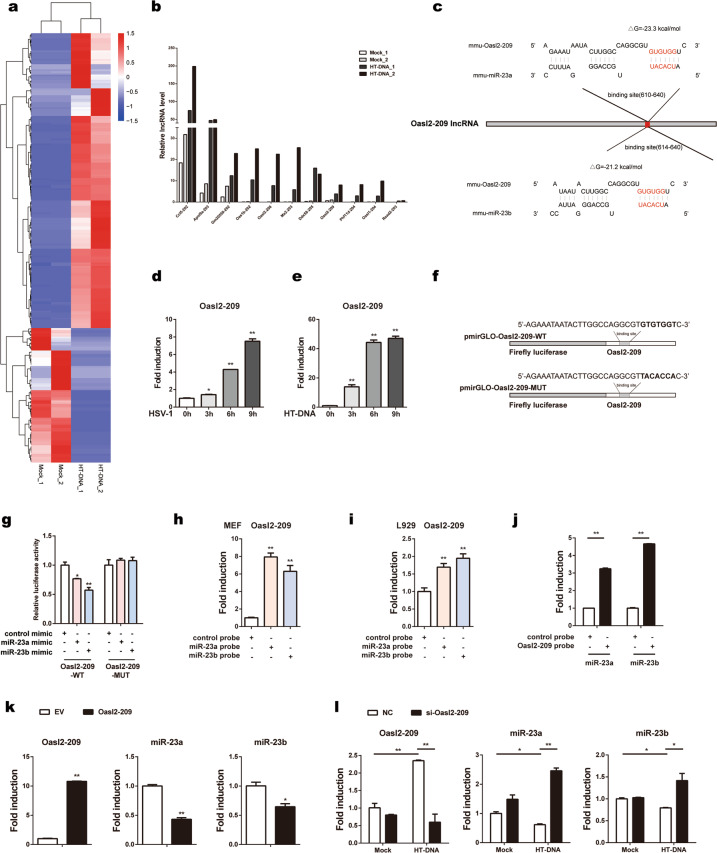
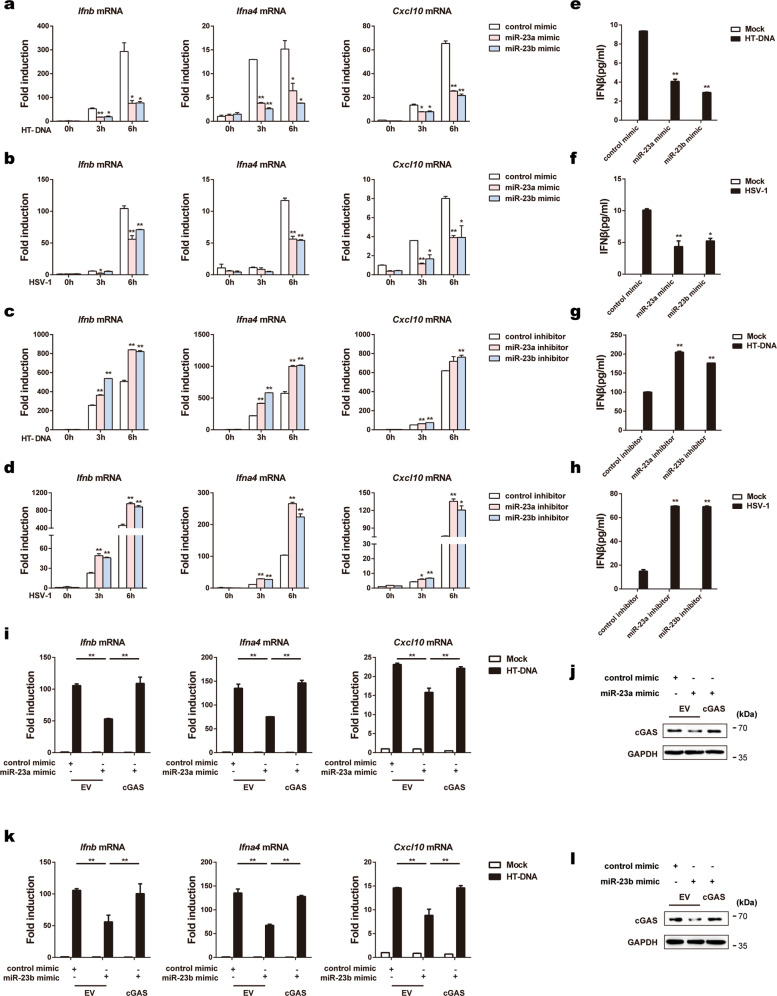
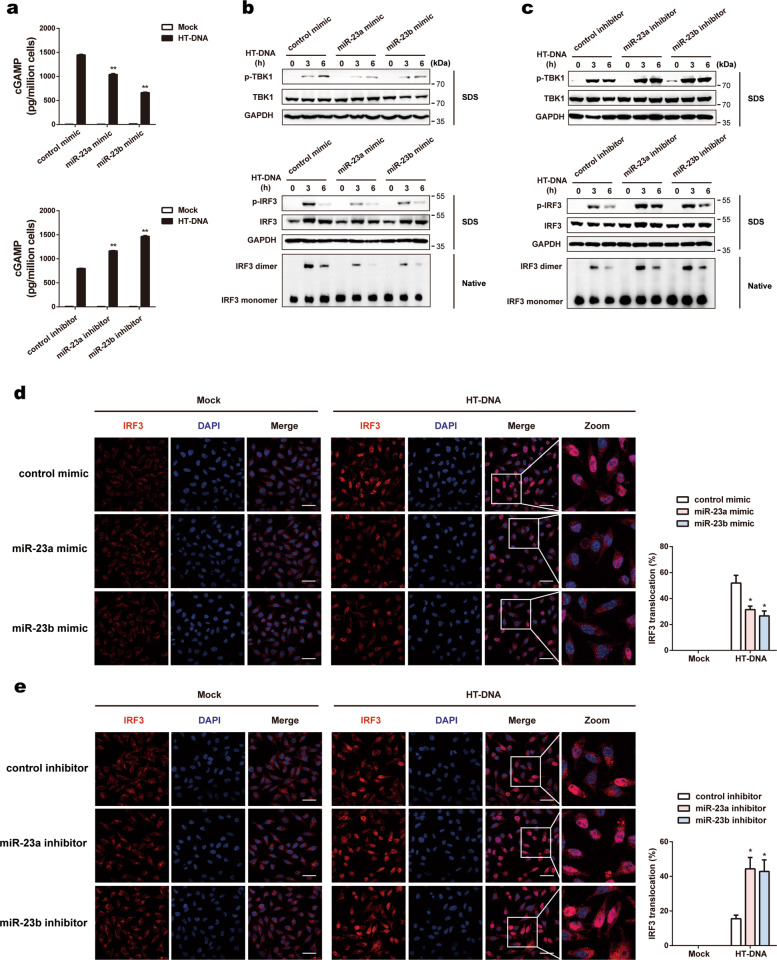
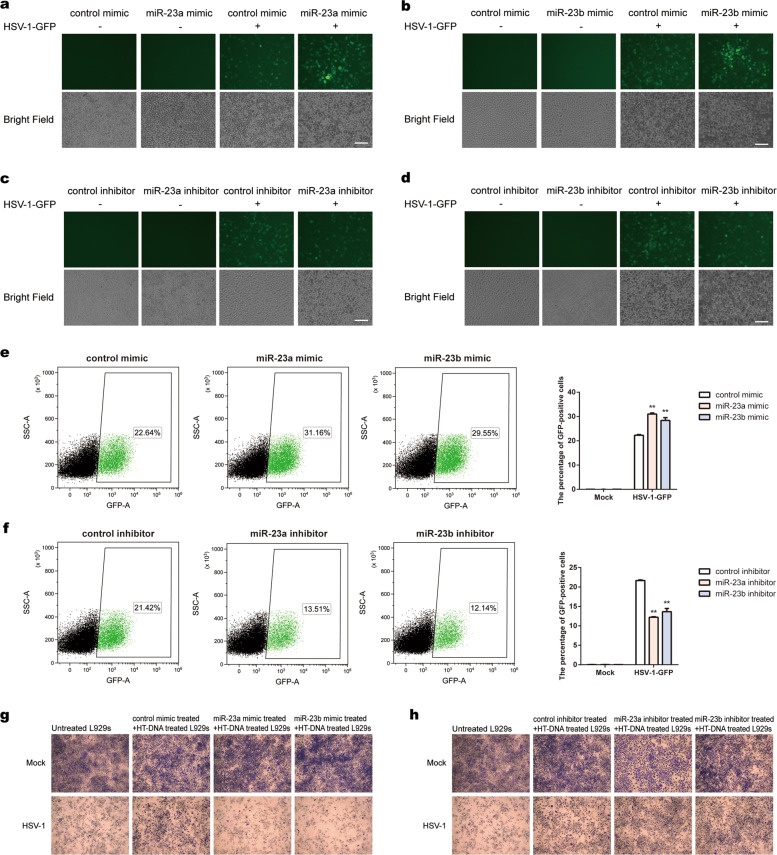
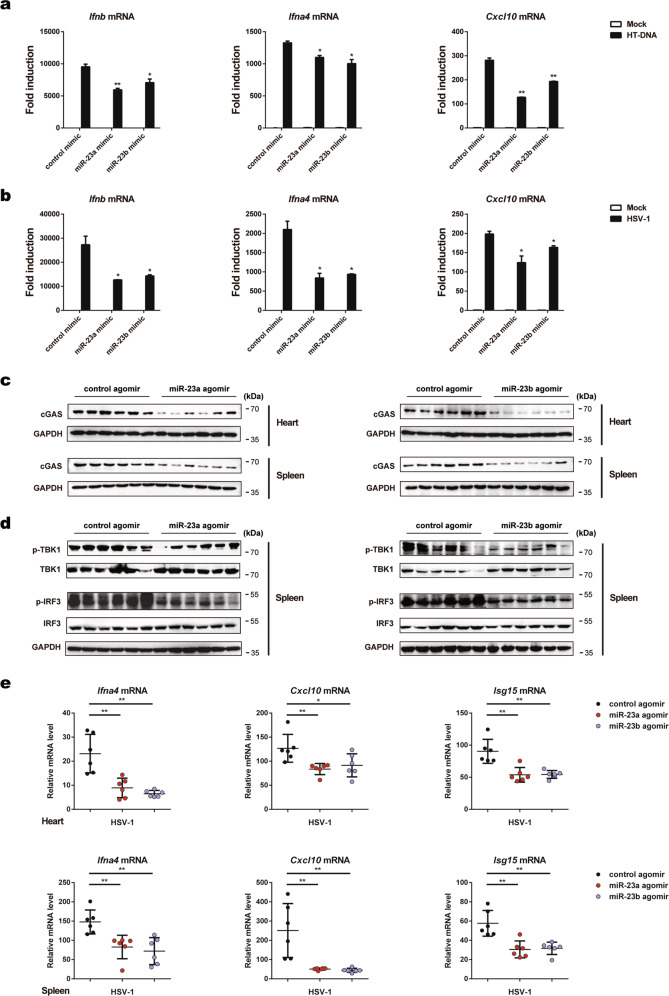
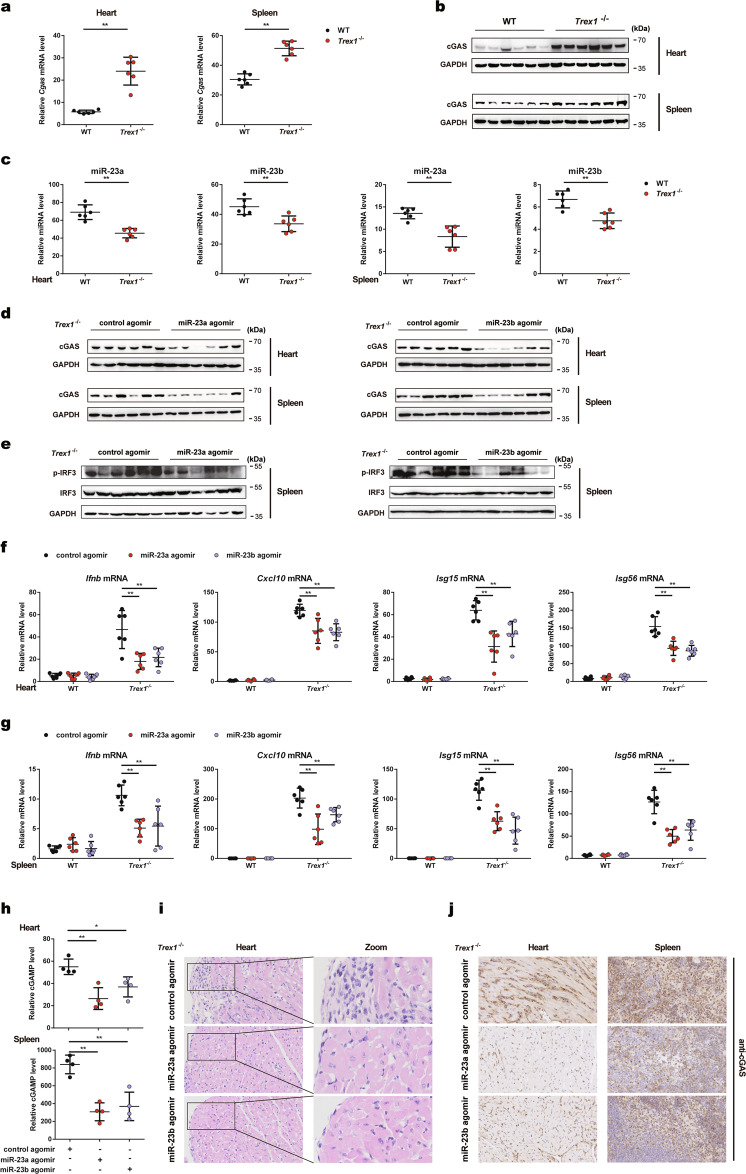
Cyclic GMP-AMP synthase (cGAS), a key sensor of intracellular DNA, is essential for eliciting innate immunity against infection, whereas aberrant activation of cGAS by endogenous DNA promotes severe autoimmune diseases. However, it is largely unknown how cGAS expression is regulated during pathogen infection and autoimmunity. Here, we report that during herpes simplex virus type 1 (HSV-1) infection, two microRNAs (miR-23a and miR-23b) whose levels significantly decrease due to their interaction with the lncRNA Oasl2-209 directly regulate the expression of cGAS. Overexpression of miR-23a/b markedly dampens cytosolic DNA-induced innate immune responses, whereas inhibition of miR-23a/b enhances these responses. Mice treated with miR-23a/b agomirs exhibit increased susceptibility to HSV-1 infection. Moreover, cGAS is significantly upregulated in the Trex1-/- mouse autoimmune disease model. Administration of miR-23a/b blunts self DNA-induced autoinflammatory responses in Trex1-/- mice. Collectively, our study not only reveals a novel regulatory mechanism of cGAS expression by miRNAs but also identifies a potential therapy for cGAS-related autoimmune diseases.

Keywords: Autoimmune disease; DNA virus; Innate immunity; cGAS; miR-23a; miR-23b.


Conflict of interest statement

The authors declare no competing interests.

Figures

Fig. 1
Fig. 1
miR-23a/b directly regulate cGAS expression. a L929 cells were infected with HSV-1 (MOI = 1) for the indicated times. Then, the cGAS protein level was analyzed by western blotting, and the relative band intensity was quantified by ImageJ (left panel). The cGAS mRNA level was measured by qPCR (right panel). b Schematic description of the predicted interactions between miR-23a/b and their binding site in the cGAS 3'-UTR. The binding site and miR-23a/b seed sequences are marked in red, and the predicted minimum free energy values of the hybridizations are shown. c L929 cells were infected with HSV-1 (MOI = 1) for the indicated times. The levels of miR-23a/b were then measured by qPCR. L929 cells were transfected with the indicated mimics (d) or inhibitors (e), and the protein levels of cGAS, TBK1, IRF3, STING, and MAVS were then analyzed by western blotting. The relative band intensity of cGAS was quantified by ImageJ. f Fragments of the cGAS 3'-UTR were cloned into pmirGLO reporter plasmids. The mutated nucleotides are marked in bold. HEK293 cells were transfected with miR-23a/b mimics (g) or inhibitors (h) along with the indicated reporter plasmids for 24 h. Then, the relative luciferase activities were analyzed. i MEFs were transfected with biotinylated miR-23a/b probes for 48 h and were then harvested for a biotin-avidin pulldown assay. RNA was extracted, and the cGAS mRNA levels were measured by qPCR. The data are representative of three independent experiments (mean ± SD). *p < 0.05, **p < 0.01
Fig. 2
Fig. 2
LncRNA Oasl2-209 directly binds to miR-23a/b and regulates miR-23a/b expression. a L929 cells were treated with or without HT-DNA (5 µg ml−1) for 6 h, and total RNA was then extracted and subjected to high-throughput sequencing. Heat map showing the differentially enriched lncRNAs with adjusted p values of less than 0.05 (padj < 0.05). b qPCR validation of eleven elevated lncRNAs in L929 cells treated as described in a. c Schematic description of the predicted interactions between the binding site of Oasl2-209 and miR-23a/b. The binding site sequence is marked in red, and the predicted minimum free energy values of the hybridizations are shown. L929 cells were infected with HSV-1 (MOI = 1) (d) or stimulated with HT-DNA (5 µg ml−1) (e) for the indicated times. Then, the level of Oasl2-209 was measured by qPCR. f Fragments of Oasl2-209 harboring wild-type (Oasl2-209-WT) or mutant (Oasl2-209-MUT) miR-23a/b target sequences were cloned into pmirGLO reporter plasmids. The mutated nucleotides are marked in bold. g HEK293 cells were transfected with miR-23a/b mimics or control mimics along with the indicated reporter plasmids for 24 h. Then, the relative luciferase activities were analyzed. MEFs (h) and L929 cells (i) were transfected with biotinylated miR-23a/b probes for 48 h and were then harvested for a biotin-avidin pulldown assay. RNA was extracted, and the level of Oasl2-209 was measured by qPCR. j L929 cells were harvested and incubated with Oasl2-209 probe-coated streptavidin beads for a pulldown assay. RNA was extracted, and the levels of miR-23a/b were measured by qPCR. k L929 cells were transfected with the indicated plasmids, and the levels of Oasl2-209 and miR-23a/b were measured by qPCR. l L929 cells transfected with the indicated siRNAs were stimulated with HT-DNA for 6 h, and the levels of Oasl2-209 and miR-23a/b were then measured by qPCR. The data are representative of three independent experiments (mean ± SD). *p < 0.05, **p < 0.01
Fig. 3
Fig. 3
miR-23a/b regulate cGAS-mediated type I IFN production. L929 cells transfected with the indicated mimics were stimulated with HT-DNA (5 µg ml−1) (a) or HSV-1 (MOI = 1) (b) for the indicated times. Induction of Ifnb, Ifna4, and Cxcl10 mRNA expression was then measured by qPCR. L929 cells transfected with the indicated inhibitors were stimulated with HT-DNA (5 µg ml−1) (c) or HSV-1 (MOI = 1) (d) for the indicated times. Induction of Ifnb, Ifna4, and Cxcl10 mRNA expression was then measured by qPCR. eh L929 cells were treated as described in ad for 6 h, and the amounts of IFNβ in the supernatants were then determined by ELISA. il MEFs were transfected with the indicated mimics together with the empty vector (EV) or the cGAS expression plasmid (cGAS) and were then stimulated with HT-DNA (5 µg ml−1) for 6 h. Then, the mRNA levels of Ifnb, Ifna4, and Cxcl10 were analyzed by qPCR (i, k), and the protein level of cGAS was examined by western blot analysis (j, l). The data are representative of three independent experiments (mean ± SD). *p < 0.05, **p < 0.01
Fig. 4
Fig. 4
miR-23a/b suppress cytosolic DNA-induced cGAS-STING signaling activation. a L929 cells transfected with the indicated mimics (upper panel) or inhibitors (lower panel) were stimulated with HT-DNA (5 µg ml−1) for 6 h. Then, the amounts of cGAMP in cell extracts were measured by ELISA. L929 cells transfected with the indicated mimics (b) or inhibitors (c) were stimulated with HT-DNA (5 µg ml−1) for the indicated times. Then, the cell extracts were analyzed for TBK1 and IRF3 phosphorylation by SDS-PAGE or for IRF3 dimerization by native PAGE. L929 cells transfected with the indicated mimics (d) or inhibitors (e) were stimulated with HT-DNA (5 µg ml−1) for 3 h, stained with an antibody against IRF3 (red) and imaged by confocal microscopy. Cells with nuclear IRF3 staining were counted as a percentage of total cells (n = 100 cells per sample). The scale bars represent 50 μm. The data are representative of three independent experiments (mean ± SD). *p < 0.05, **p < 0.01
Fig. 5
Fig. 5
miR-23a/b promote HSV-1 infection in vitro. L929 cells transfected with the indicated mimics (a, b) or inhibitors (c, d) were infected with HSV-1-GFP (MOI = 0.3) for 16 h. Then, HSV-1-GFP replication was visualized by fluorescence microscopy. The scale bars represent 100 μm. L929 cells transfected with the indicated mimics (e) or inhibitors (f) were infected with HSV-1-GFP (MOI = 0.3) for 16 h. Then, the proportions of GFP-positive cells were determined by flow cytometry. L929 cells transfected with the indicated mimics (g) or inhibitors (h) were stimulated with HT-DNA (5 µg ml−1). Fresh L929 cells were incubated overnight with equal volumes of culture supernatants from these treatments and were then infected with HSV-1. Cell proliferation was examined by crystal violet staining. The scale bars represent 250 μm
Fig. 6
Fig. 6
miR-23a/b suppress host defense against HSV-1 infection in vivo. BMDMs from WT mice transfected with the indicated mimics were stimulated with HT-DNA (5 µg ml−1) (a) or HSV-1 (MOI = 1) (b) for 6 h. Then, induction of Ifnb, Ifna4, and Cxcl10 mRNA expression was measured by qPCR. c WT mice (n = 6 per group) were injected intravenously with the indicated agomirs for 48 h and were then infected with HSV-1 (5 × 107 pfu per mouse) for 12 h. Then, the cGAS protein levels in the hearts and spleens were analyzed by western blotting. d WT mice (n = 6 per group) were treated as described in c, and the levels of TBK1/IRF3 phosphorylation in the spleens were then analyzed by western blotting. e WT mice (n = 6 per group) were treated as described in c, and the mRNA levels of Ifna4, Cxcl10, and Isg15 in the hearts and spleens were then analyzed by qPCR. The data are representative of three independent experiments (mean ± SD). *p < 0.05, **p < 0.01
Fig. 7
Fig. 7
miR-23a/b suppress cGAS-mediated autoimmunity in mice. qPCR analysis of Cgas mRNA levels (a) and immunoblot analysis of cGAS protein levels (b) in the hearts and spleens of WT or Trex1−/− mice (n = 6 per group). c qPCR analysis of miR-23a/b levels in the hearts and spleens of WT and Trex1−/− mice (n = 6 per group). d Trex1−/− mice (n = 6 per group) were injected intraperitoneally with the indicated agomirs for 6 days, and the cGAS protein levels in the hearts and spleens were then analyzed by western blotting. e Trex1−/− mice (n = 6 per group) were treated as described in d, and the level of IRF3 phosphorylation in the spleens was then analyzed by western blotting. Trex1−/− mice (n = 6 per group) were treated as described in d, and the levels of Ifnb, Cxcl10, Isg15, and Isg56 mRNA in the hearts (f) and spleens (g) were then measured by qPCR. h Trex1−/− mice (n = 4 per group) were treated as described in d, and the amounts of cGAMP in the hearts and spleens were then measured by ELISA. i Representative H&E-stained heart sections of Trex1−/− mice treated as described in d. The images in the panels are at ×40 magnification. j Representative IHC staining for cGAS in heart and spleen sections of Trex1−/− mice treated as described in d. The images in the panels are at ×40 magnification. The data are representative of three independent experiments (mean ± SD). *p < 0.05, **p < 0.01

References

    1. Takeuchi O, Akira S. Pattern recognition receptors and inflammation. Cell. 2010;140:805–820. - PubMed
    1. Paludan SR, Bowie AG. Immune sensing of DNA. Immunity. 2013;38:870–880. - PMC - PubMed
    1. Sun L, Wu J, Du F, Chen X, Chen ZJ. Cyclic GMP-AMP synthase is a cytosolic DNA sensor that activates the type I interferon pathway. Science. 2013;339:786–791. - PMC - PubMed
    1. Ablasser A, Goldeck M, Cavlar T, Deimling T, Witte G, Rohl I, et al. cGAS produces a 2'-5'-linked cyclic dinucleotide second messenger that activates STING. Nature. 2013;498:380–384. - PMC - PubMed
    1. Gao P, Ascano M, Wu Y, Barchet W, Gaffney BL, Zillinger T, et al. Cyclic [G(2',5')pA(3',5')p] is the metazoan second messenger produced by DNA-activated cyclic GMP-AMP synthase. Cell. 2013;153:1094–1107. - PMC - PubMed

Publication types

MeSH terms

LinkOut - more resources