. 2021 May;593(7859):440-444.
doi: 10.1038/s41586-021-03468-5. Epub 2021 Mar 25.

Neuronal enhancers are hotspots for DNA single-strand break repair

Affiliations

Neuronal enhancers are hotspots for DNA single-strand break repair

Wei Wu et al. Nature. 2021 May.

Abstract

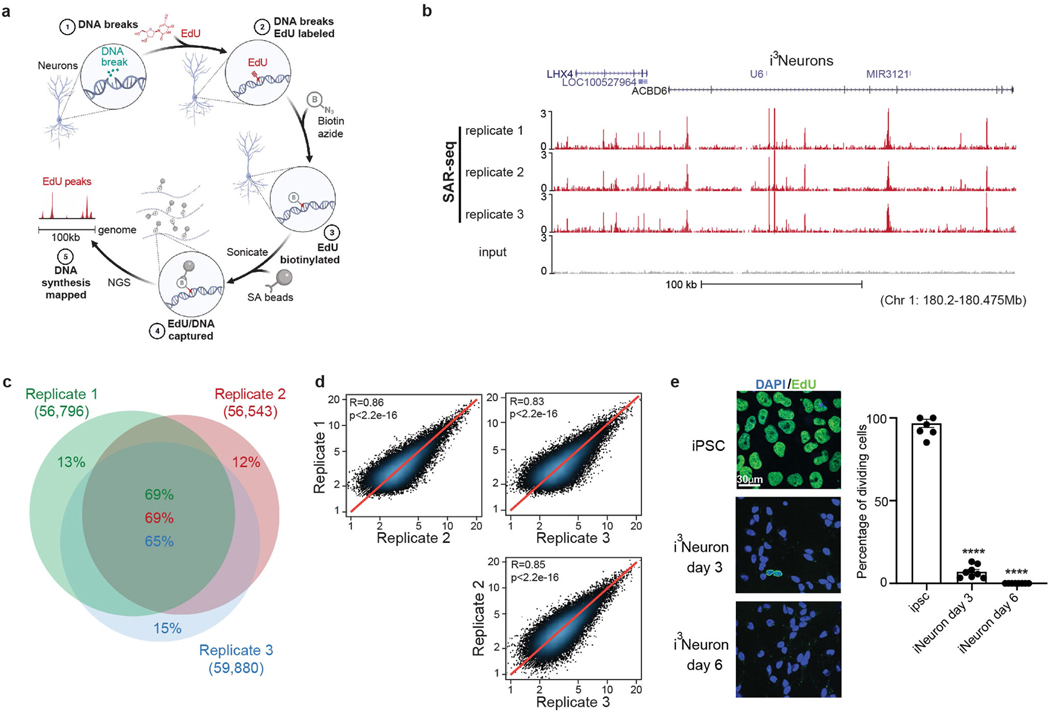
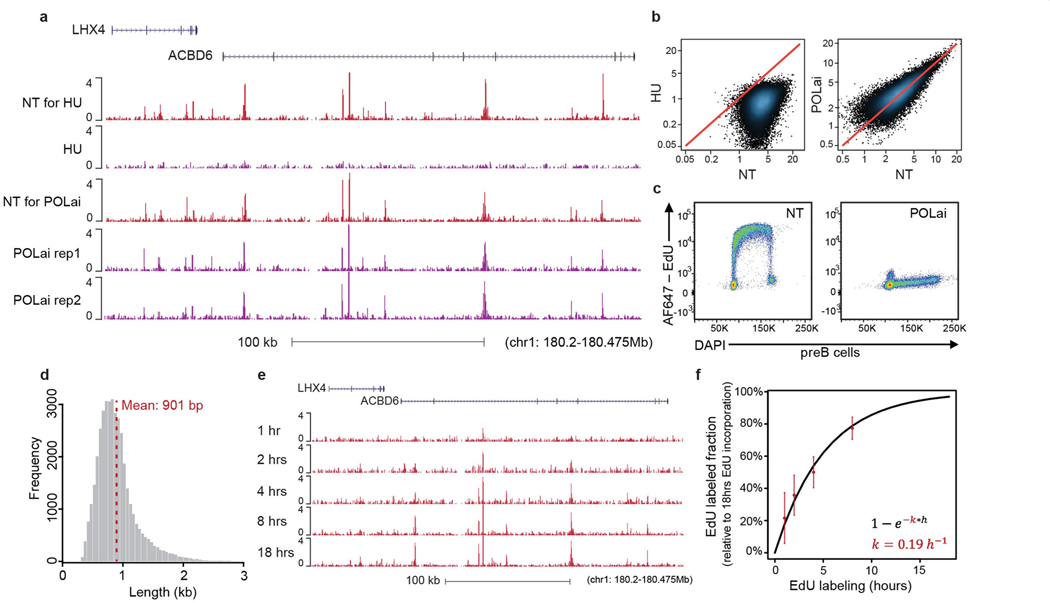
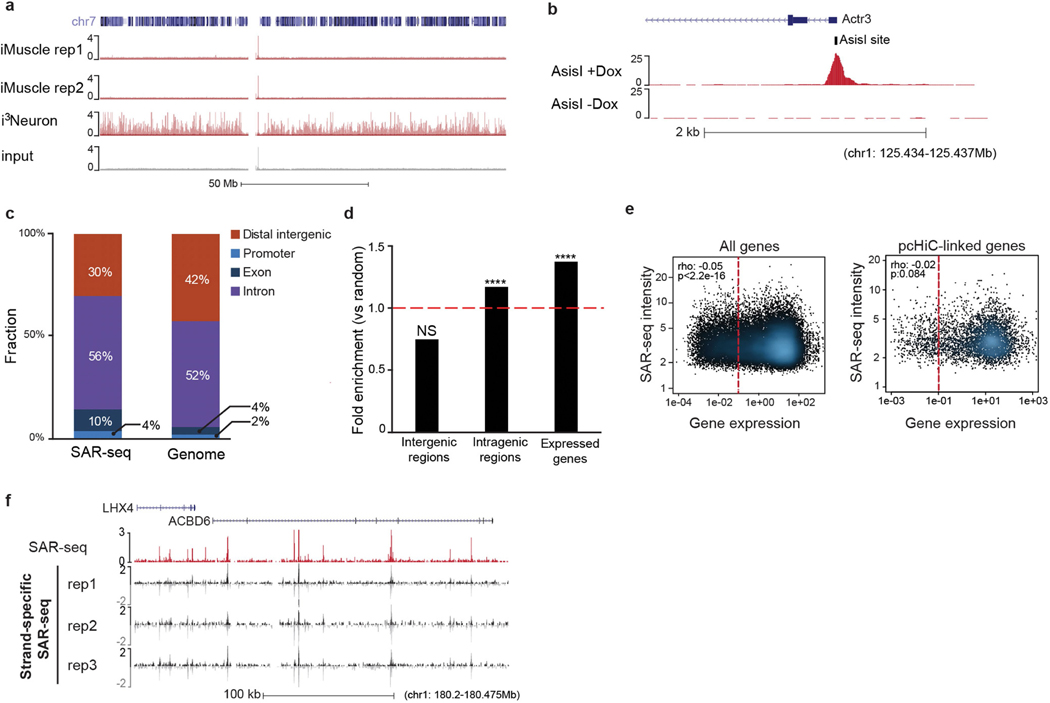
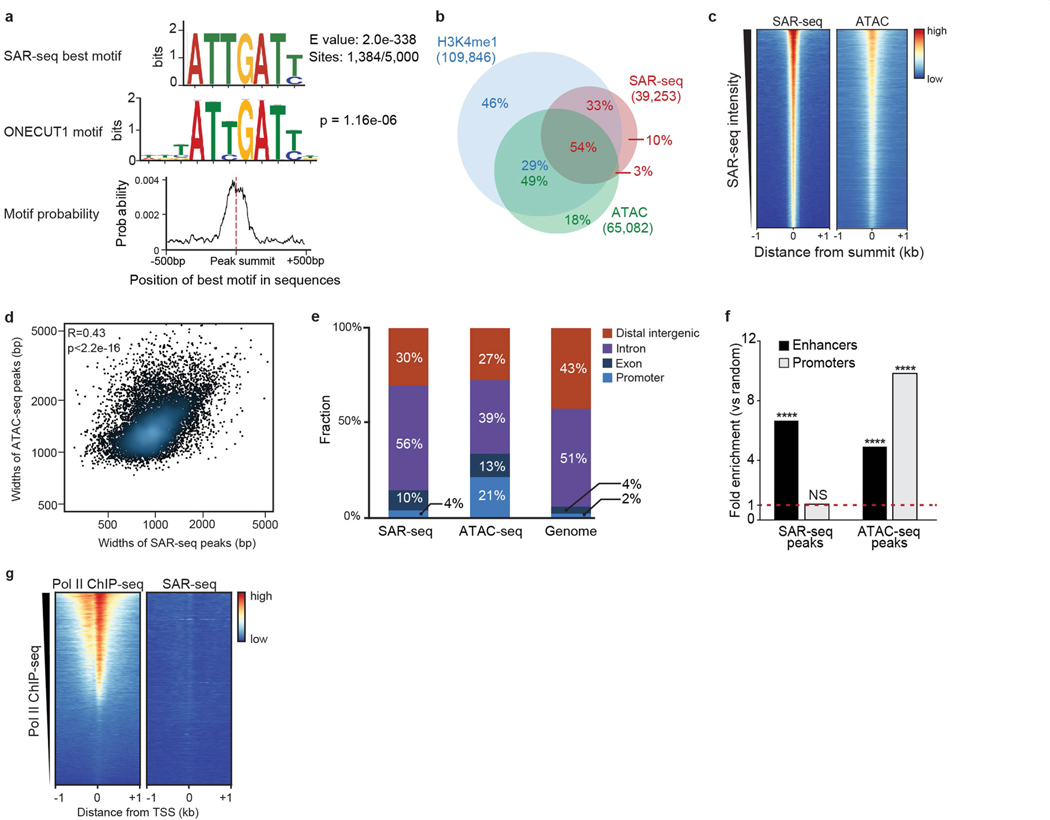
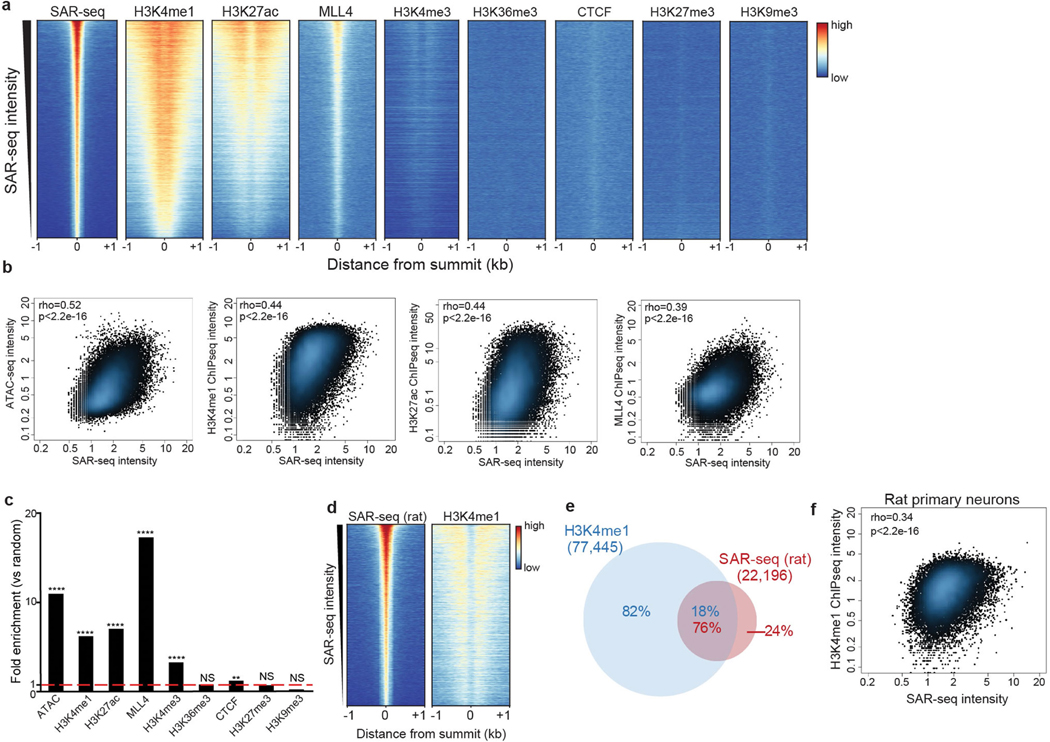
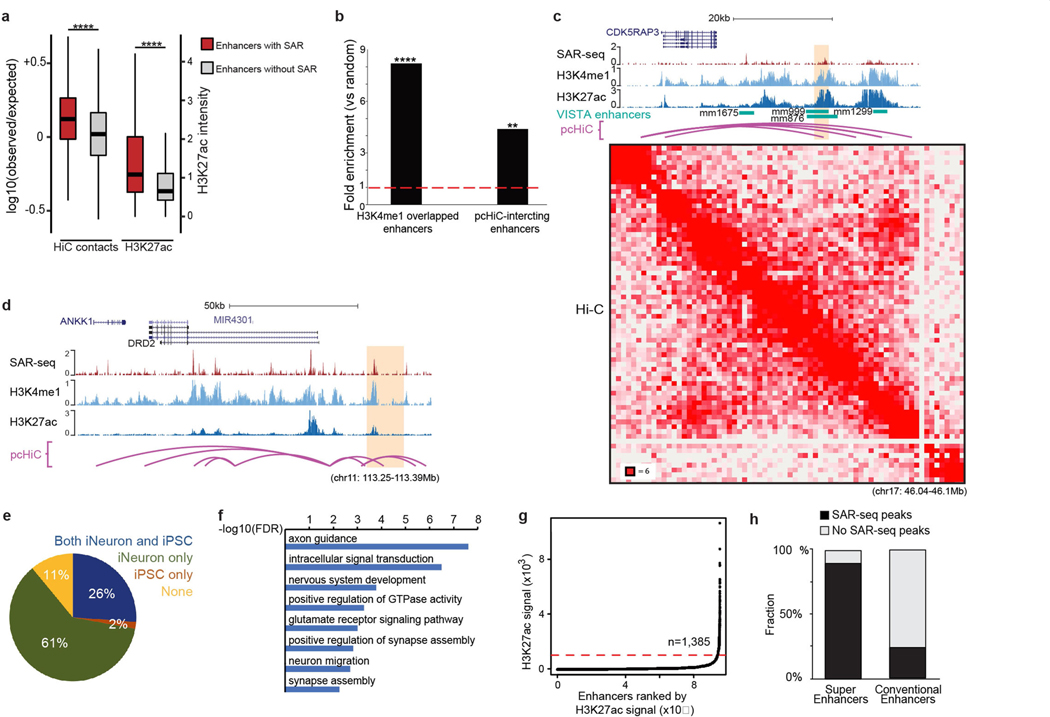
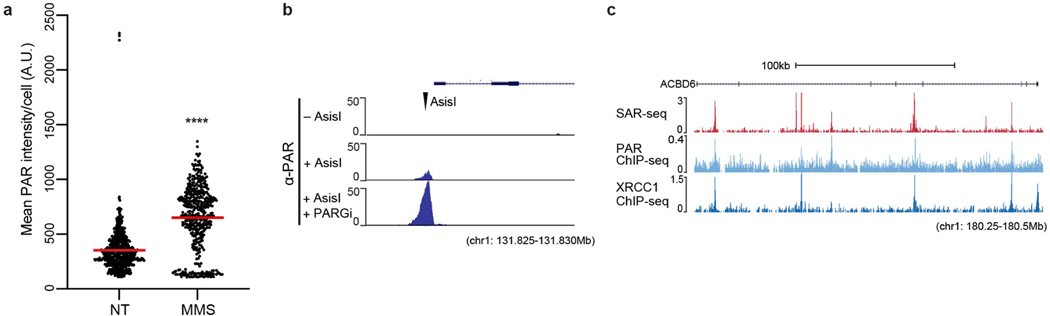
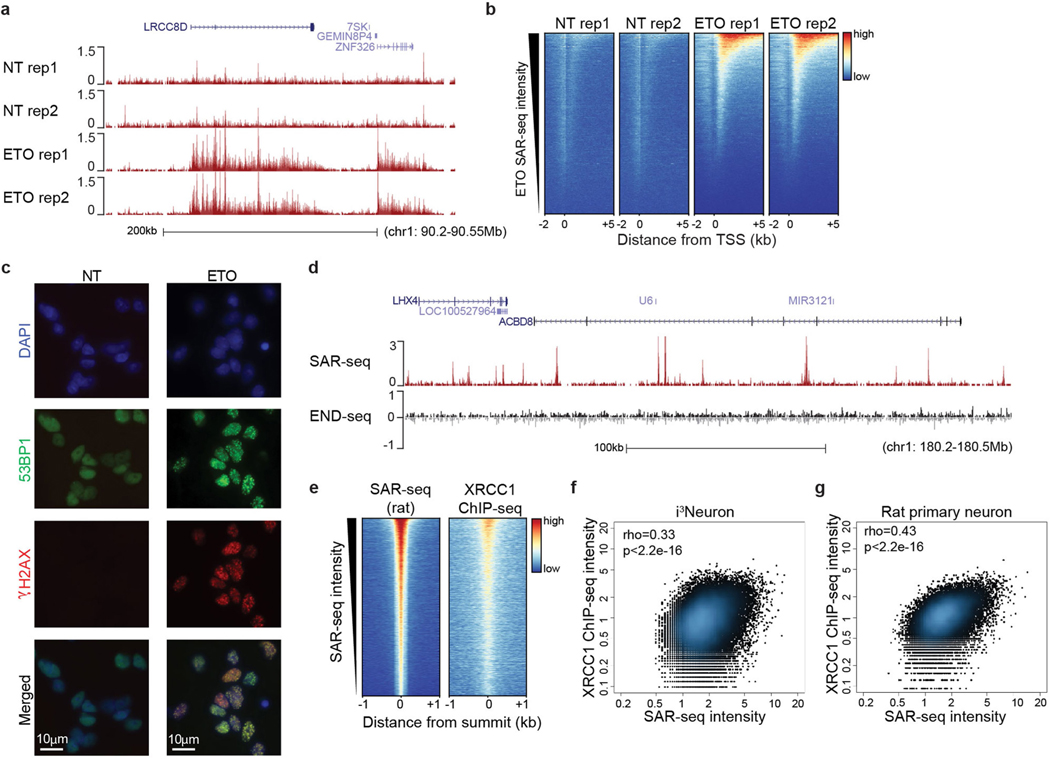
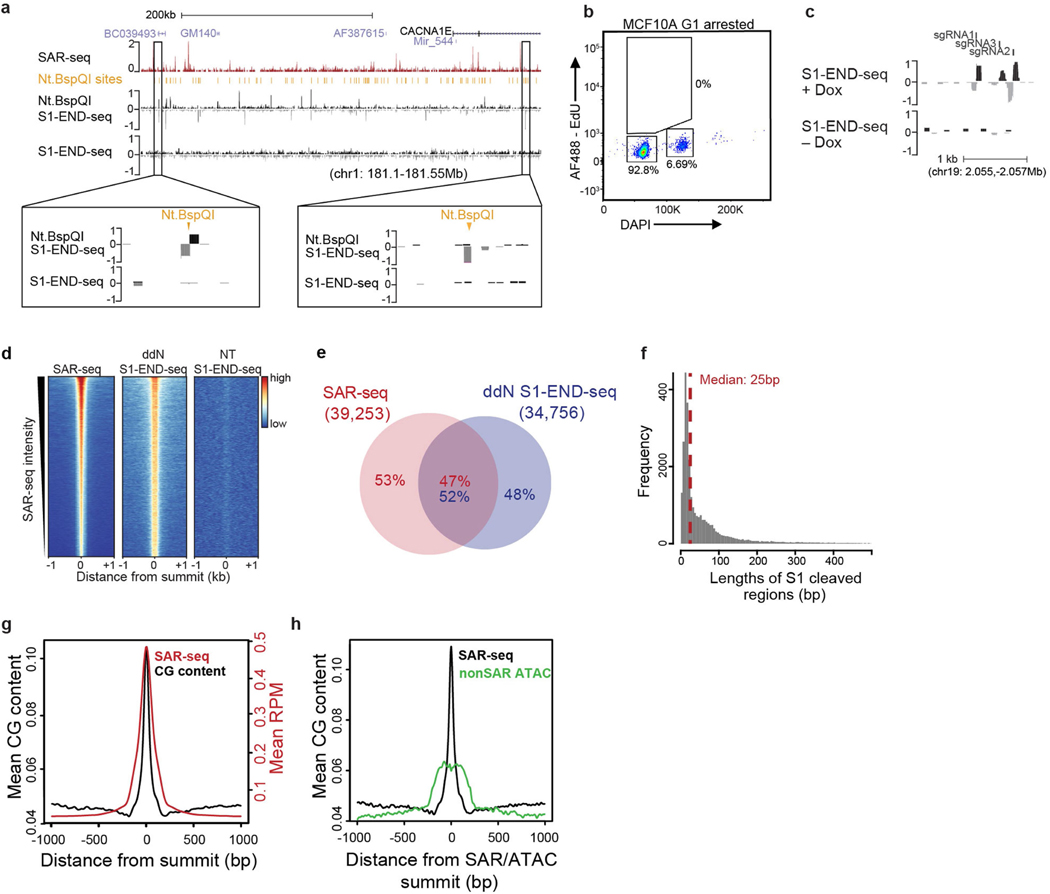
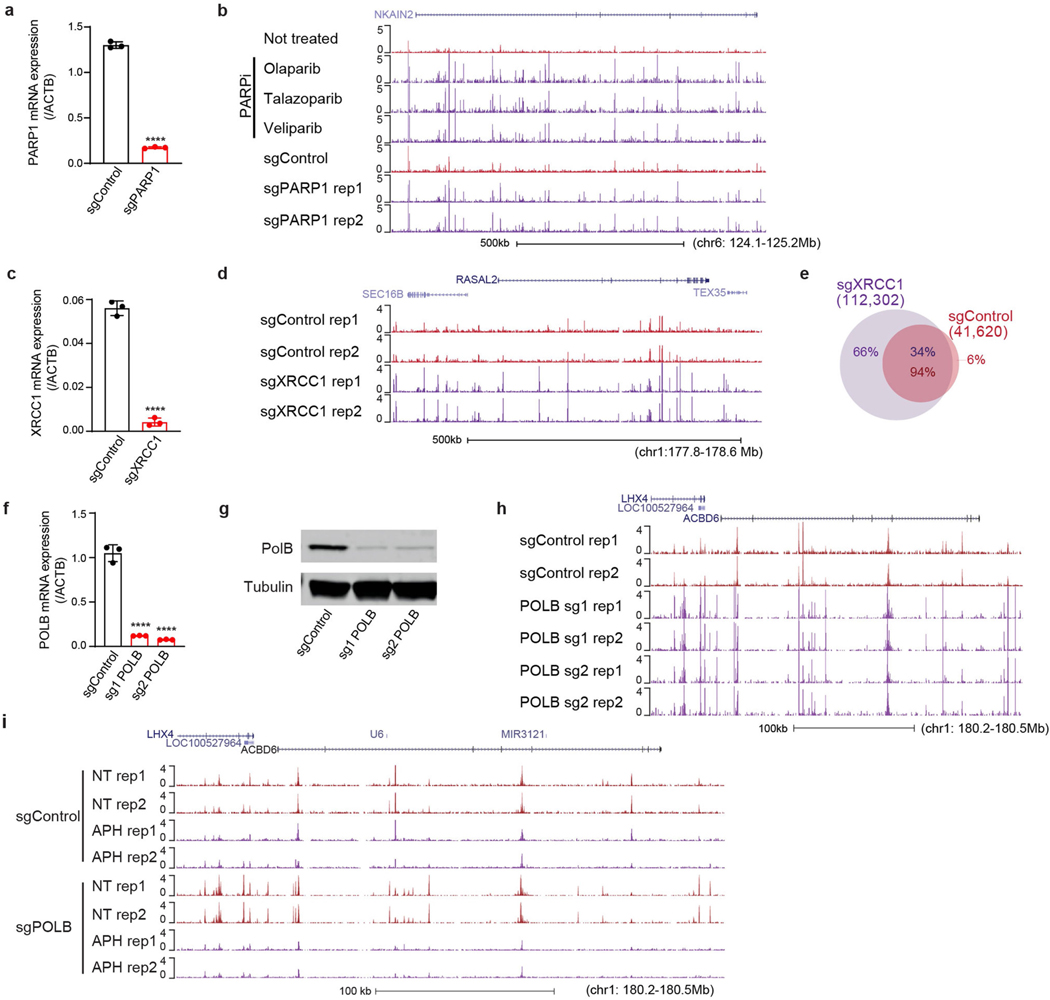
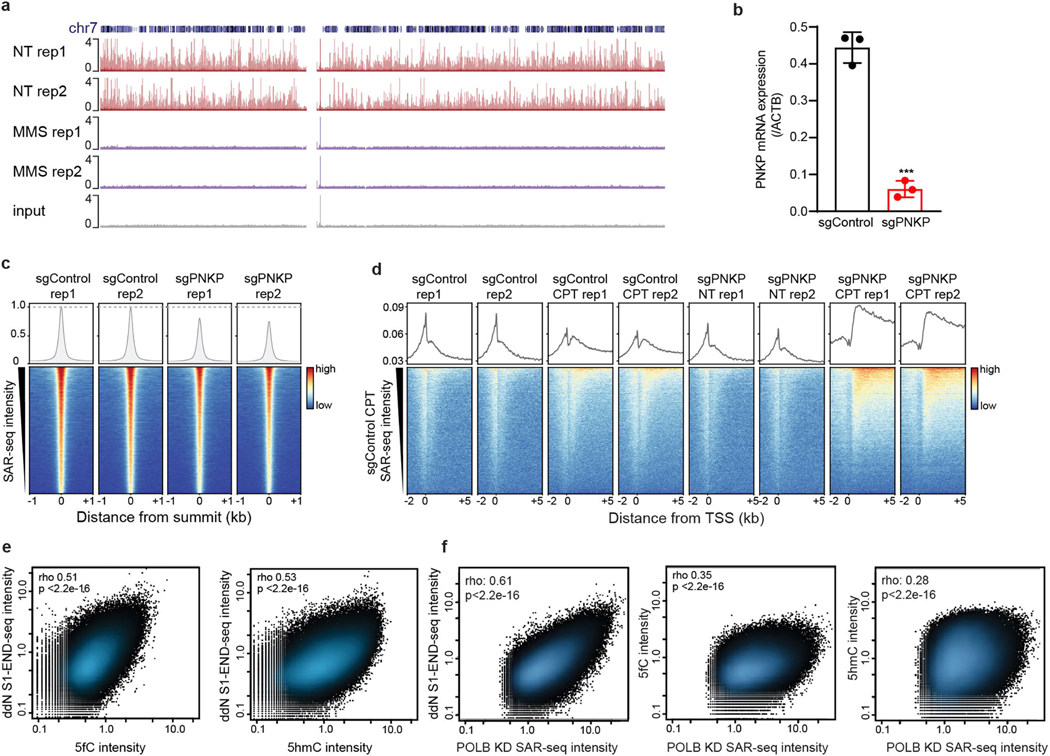
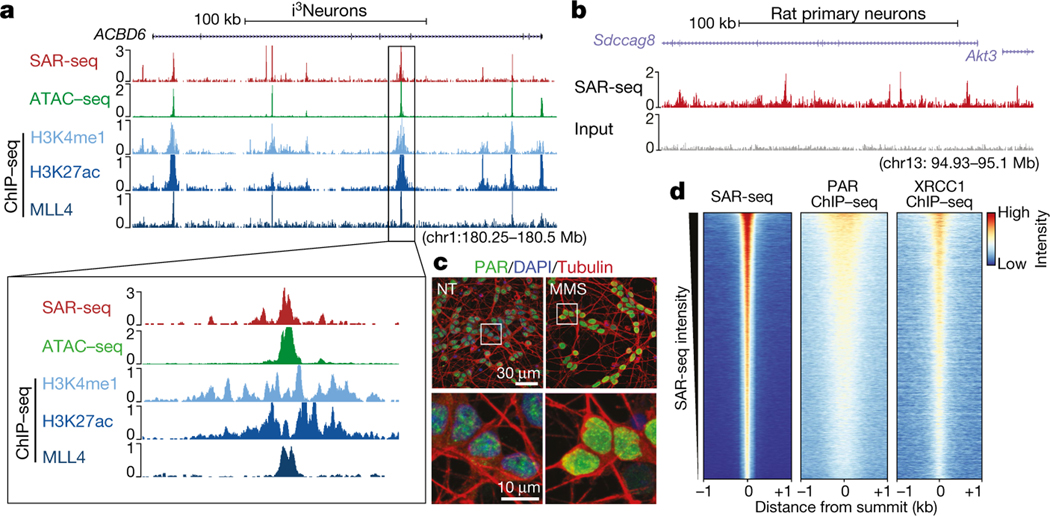
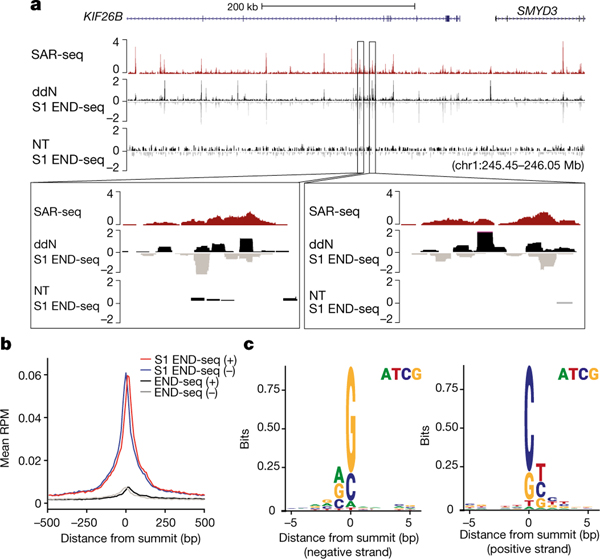
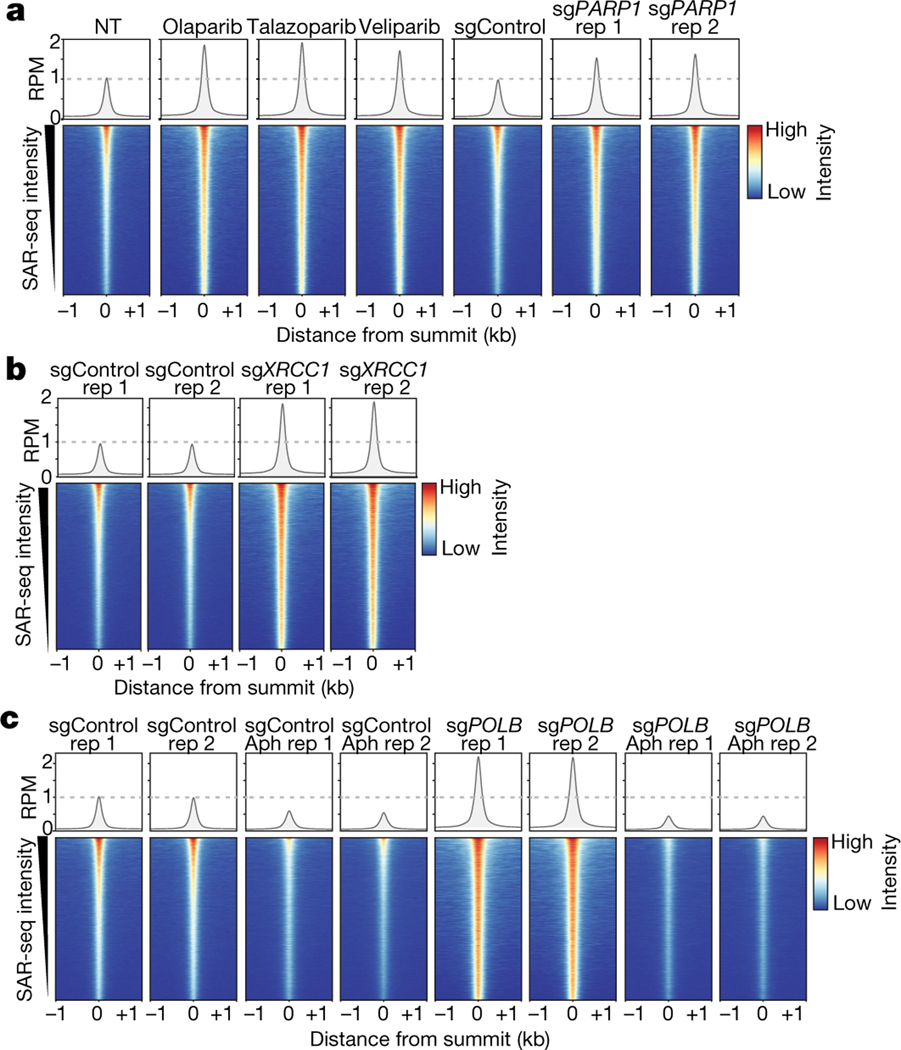
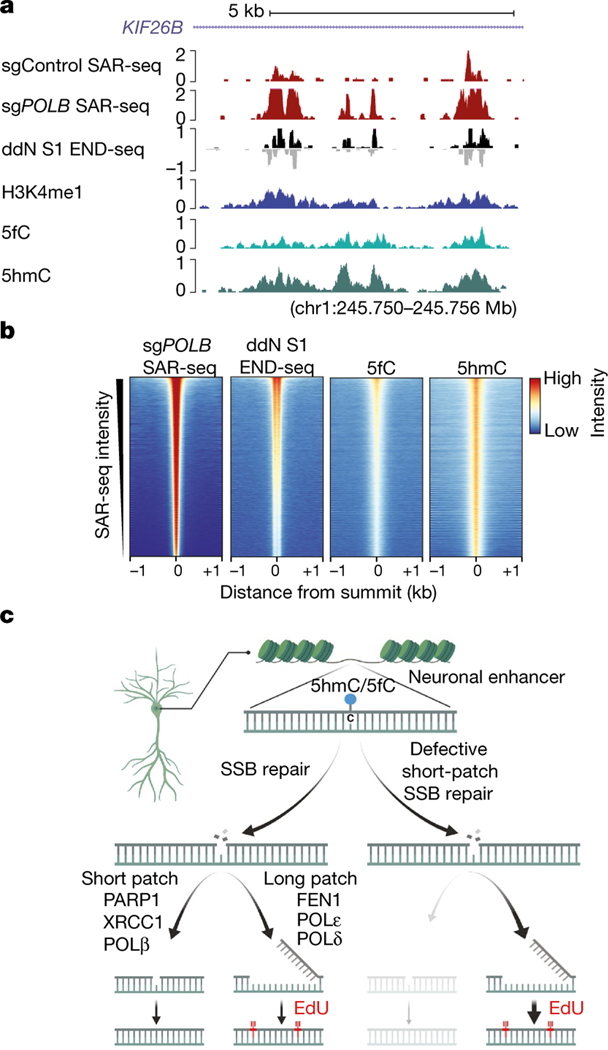
Defects in DNA repair frequently lead to neurodevelopmental and neurodegenerative diseases, underscoring the particular importance of DNA repair in long-lived post-mitotic neurons1,2. The cellular genome is subjected to a constant barrage of endogenous DNA damage, but surprisingly little is known about the identity of the lesion(s) that accumulate in neurons and whether they accrue throughout the genome or at specific loci. Here we show that post-mitotic neurons accumulate unexpectedly high levels of DNA single-strand breaks (SSBs) at specific sites within the genome. Genome-wide mapping reveals that SSBs are located within enhancers at or near CpG dinucleotides and sites of DNA demethylation. These SSBs are repaired by PARP1 and XRCC1-dependent mechanisms. Notably, deficiencies in XRCC1-dependent short-patch repair increase DNA repair synthesis at neuronal enhancers, whereas defects in long-patch repair reduce synthesis. The high levels of SSB repair in neuronal enhancers are therefore likely to be sustained by both short-patch and long-patch processes. These data provide the first evidence of site- and cell-type-specific SSB repair, revealing unexpected levels of localized and continuous DNA breakage in neurons. In addition, they suggest an explanation for the neurodegenerative phenotypes that occur in patients with defective SSB repair.


Figures

Extended Data Fig. 1 |
Extended Data Fig. 1 |. Discrete genomic loci in neurons are associated with ongoing DNA synthesis.
a, Schematic of SAR-seq (DNA synthesis associated with repair sequencing) methodology. Neurons grown in culture (1) are incubated with EdU to label sites of DNA repair synthesis (2). The incorporated genomic EdU is then conjugated to biotin via click chemistry (3), sheared by sonication to fragments of 150–200 bp and captured with streptavidin beads (4). Enriched DNA sequences are then PCR-amplified and subjected to next-generation sequencing (5). b, Genome browser screenshot displaying SAR-seq profiles as normalized read density (RPM) for i3Neurons. Three independent biological replicates are shown as well as input. Neurons were labelled with EdU for 18 h and collected on day 7 after induction of neuronal differentiation. All coordinates provided are from the hg19 reference genome for i3Neurons. c, Venn diagram showing the overlap of SAR-seq peaks in i3Neurons for three independent biological replicates. d, Scatter plots showing correlations of SAR-seq intensities (RPKM) between three replicates in i3Neurons. Pearson correlation coefficients and P values are indicated. e, Left, representative images of EdU–biotin staining (green) showing cell proliferation in iPS cells, but not in post-mitotic i3Neurons. i3Neurons were treated with EdU on day 3 or day 6 and fixed on day 7. iPS cells were treated with EdU for 24 h and fixed. Cells were counterstained with DAPI (blue). Different imaging conditions were used for iPS cells and i3Neurons in the representative images. Right, quantification of EdU-positive cells. Each dot represents the percentage of dividing cells in one image (iPS cell: n = 8 images, n = 397/410 cells EdU-positive; i3Neuron day 3: n = 8 images, n = 35/483 cells EdU-positive; i3Neuron day 7: n = 8 images, n = 0/523 cells EdU-positive). Data are mean ± s.e.m. and are representative of three independent experiments.
Extended Data Fig. 2 |
Extended Data Fig. 2 |. Genomic characteristics of SAR-seq peaks.
a, Genome browser screenshot showing SAR-seq in i3Neurons treated with hydroxyurea (HU, n = 1) or polymerase-α inhibitor (POLαi, n = 2). NT, non-treated. b, Scatter plots showing SAR-seq intensities (RPKM) for HU- (left) and POLαi- (right) treated compared to non-treated (NT) samples. c, Flow cytometry cell cycle profile of pre-B cells treated or non-treated (NT) with POLαi. Cells were pulsed with EdU for 30 min before being collected for flow cytometry. Cells were counterstained with DAPI (n = 1). For an example of the gating strategy used for flow cytometry in c and in Extended Data Fig. 9b, see Supplementary Fig. 1. d, Histogram of individual SAR-seq peak widths, revealing a mean peak width of 901 bp. e, Genome browser screenshot showing SAR-seq in i3Neurons collected after 1, 2, 4, 8, or 18 h of EdU incubation (n = 2 for each). f, Fraction of EdU labelling in i3Neurons (relative to maximum labelling at 18 h) as a function of time, calculated from the top 2,000 peaks. Red points and error bars represent mean and s.d. of the relative levels of EdU measured from experimental data. Black line represents the theoretical model after fitting, with k being the rate of EdU labelling.
Extended Data Fig. 3 |
Extended Data Fig. 3 |. SAR-seq enrichment at neuronal intragenic regions.
a, Genome browser screenshot of chromosome 7 showing lack of localized DNA synthesis in two independent biological replicates of SAR-seq performed in iMuscle cells (n = 2) incubated with EdU for 18 h compared to SAR-seq in i3Neurons as well as input DNA. b, Genome browser screenshot displaying SAR-seq peak at a representative AsiSI restriction enzyme site (tick mark). AsiSI expression was induced for 18 h (+Dox, n = 1) compared with non-treated (−Dox, n = 1) conditions in G0-arrested, Abelson virus-transformed mouse pre-B cells as described. c, Distribution of SAR-seq peaks with respect to different genomic features compared to genome-wide distribution of the hg19 human reference genome. Promoters are defined as 1 kb upstream of transcription start sites. Distal intergenic represents promoter-excluded intergenic regions. d, Fold enrichment of SAR-seq peaks in intergenic regions, intragenic regions and expressed genes compared to 1,000 sets of randomly shuffled regions of the same sizes and chromosome distribution (one-sided Fisher’s exact test, ****P < 2.2 × 10⁻¹⁶; NS, not significant). e, Left, scatterplot showing correlation of SAR-seq intensity (RPKM) with transcript level of genes containing SAR-seq peaks measured by RNA-seq (FPKM; n = 3) in i3Neurons. Seventy-one per cent of SAR-seq peaks are at expressed genes (FPKM ≥ 0.1; red dashed line, FPKM = 0.1). Right, correlation of SAR-seq intensity with transcript levels of linked genes determined by pcHiC in i3Neurons (red dashed line, FPKM = 0.1). Spearman correlation coefficients and P values are indicated. f, Genome browser screenshot comparing SAR-seq with strand-specific SAR-seq (n = 3), which discriminates which strand is labelled with EdU in i3Neurons. Both strands show labelling in three biological replicates. Strand-specific SAR-seq reads are separated into positive (black) and negative (grey) strands.
Extended Data Fig. 4 |
Extended Data Fig. 4 |. Motif discovery of SAR peaks and comparison with ATAC–seq peaks.
a, Motif analysis for sequences within 500 bp of the summit of the top 5,000 SAR-seq peaks in i3Neurons. Top, the best motif discovered by the MEME suite (1,384 out of 5,000 sites have this motif). Middle, TOMTOM motif tool used to compare SAR-seq motif shown above with databases of known motifs. The transcription factor ONECUT1 was identified as the most similar motif and its consensus sequence is shown. P value for motif comparison with ONECUT1 motif is indicated. Bottom, position distribution of the best motif (top) within 500 bp of the SAR-seq peak summit. The best motif is centred on the SAR-seq peak summit. b, Venn diagram illustrating the overlap between H3K4me1 ChIP–seq, ATAC–seq and SAR-seq peaks in i3Neurons. The statistical significance of the overlaps between SAR-seq, H3K4me1 ChIP–seq and ATAC–seq peaks was determined using randomly shuffled data sets (n = 1,000) by one-sided Fisher’s exact test (the P value for overlap between H3K4me1 ChIP–seq and SAR-seq peaks is P < 2.2 × 10⁻¹⁶, and for ATAC–seq/SAR-seq peaks is P < 2.2 × 10⁻¹⁶). Fraction of different overlapping groups are labelled in red for SAR-seq peaks, green for ATAC–seq peaks and blue for H3K4me1 ChIP–seq peaks. c, Heat maps of SAR-seq and ATAC–seq signals within 1 kb of SAR-seq peak summits in i3Neurons, ordered by SAR-seq intensity. d, Scatter plot comparing widths of ATAC–seq peaks and SAR-seq peaks for the top 10,000 overlapping peaks in i3Neurons. Pearson correlation coefficient and P value are indicated. e, Distribution of SAR-seq and ATAC–seq peaks with respect to different genomic features compared to genome-wide distribution on the hg19 human reference genome. Promoters are defined as 1 kb upstream of transcription start sites and distal intergenic represents promoter-excluded intergenic regions. f, Fold enrichment of SAR-seq and ATAC–seq peaks located at enhancers (black) and promoters (grey) compared to 1,000 sets of randomly shuffled regions of the same sizes and chromosome distributions, respectively (one-sided Fisher’s exact test, ****P < 2.2 × 10⁻¹⁶, NS: P = 0.0783, not significant). g, Heat map of RNA Pol II (n = 1) ChIP–seq and SAR-seq in i3Neurons for 1 kb on either side of the transcription start site (TSS) in i3Neurons, ordered by Pol II ChIP–seq intensity.
Extended Data Fig. 5 |
Extended Data Fig. 5 |. The correlation between SAR-seq and chromatin features.
a, Heat maps of SAR-seq and ChIP–seq data for enhancer markers (H3K4me1, H3K27ac and MLL4), other chromatin markers at accessible regions (H3K4me3, H3K36me3 and CTCF) and chromatin silencing markers (H3K27me3 and H3K9me3) for 1 kb on either side of the SAR-seq peak summit in i3Neurons, ordered by SAR-seq intensity. b, Scatter plots showing the correlation between SAR-seq intensity and ATAC–seq, H3K4me1, H3K27ac and MLL4 ChIP–seq intensities (RPKM) for 1 kb on either side of the SAR-seq peak summits in i3Neurons. Spearman correlation coefficients and P values are indicated. c, Fold enrichment of SAR-seq peaks at ATAC–seq peaks, ChIP–seq peaks of enhancer-related marks (H3K4me1, H3K27ac and MLL4), additional chromatin marks at accessible regions (H3K4me3, H3K36me3 and CTCF) (all n = 1) and chromatin silencing marks (H3K27me3 and H3K9me3) (both n = 1) in i3Neurons. n = 1,000 randomly shuffled data sets were generated to test the significance using one-sided Fisher’s exact test (P < 2.2 × 10⁻¹⁶ for H3K4me1, H3K27ac, ATAC–seq and MLL4; P = 1.85 × 10−316 for H3K4me3; P = 0.00116 for CTCF; **P < 0.001, ****P < 0.00001, NS, not significant). d, Heat maps of SAR-seq and H3K4me1 ChIP–seq signal for 1 kb on either side of the SAR-seq peak summit in primary rat cortical neurons, ordered by SAR-seq intensity. e, Venn diagram showing the overlap between H3K4me1 and SAR-seq peaks in rat primary neurons. n = 1,000 randomly shuffled data sets were generated to test the significance using one-sided Fisher’s exact test: P < 2.2 × 10⁻¹⁶. f, Scatter plot showing the correlation between SAR-seq and H3K4me1 ChIP–seq intensities (RPKM) for 1 kb on either side of the SAR-seq peak summits in rat primary neurons. Spearman correlation coefficient and P values are indicated.
Extended Data Fig. 6 |
Extended Data Fig. 6 |. SAR-seq enrichment at neuronal enhancers.
a, Box plot showing Hi-C contacts (left, n = 4) and H3K27ac (right, n = 1) levels at enhancers with (red) or without (grey) SAR-seq peaks. Contacts were defined as Hi-C interactions between an H3K27ac+ enhancer (with and without SAR) and its closest promoter within the TAD domain. For comparative purposes, observed contacts were normalized to expected contacts. Centre line, median; box limits, 25th and 75th percentiles; whisker indicates 1.5× interquartile range. Statistical significance was determined using the one-sided Wilcoxon rank-sum test. P = 1.64 × 10−225 for HiC contacts and P < 2.2 × 10⁻¹⁶ for H3K27ac intensity (****P < 0.00001). b, Fold enrichment of SAR-seq peaks at in vivo-validated enhancers from the VISTA Enhancer Browser database that overlap with H3K4me1 ChIP–seq peaks (left, P = 1.42 × 10−53) or at promoter-interacting regions determined by pcHiC (right, P = 1.574 × 10⁻⁹). n = 1,000 randomly shuffled datasets were generated to test significance using one-sided Fisher’s exact test (**P < 0.001, ****P < 0.00001). c, d, Genome browser screenshots showing SAR-seq, H3K4me1 and H3K27ac ChIP–seq, and pcHiC and Hi-C profiles at representative enhancers (highlighted in orange) interacting with the CDK5RAP3 promoter (c) and the DRD2 promoter (d). Both enhancers have been validated to promote transcription of their respective genes using CRIPSR techniques in i3Neurons. The CDK5RAP3 enhancer also overlaps with in vivo-validated enhancers from the VISTA Enhancer Browser database. In the Hi-C contact matrix (c, bottom) the intensity of each pixel represents the normalized number of contacts between a pair of loci. The maximum intensity is indicated at the lower left corner. e, Pie chart showing distribution of i3Neuron SAR-seq peaks in iPS cell-specific, i3Neuron-specific and shared iPS cell and i3Neuron enhancers. Approximately 56 million and 49 million single end reads were sequenced for the H3K4me1 ChIP–seq in iPS cell and i3Neurons, respectively, with approximately 100,000 peaks called in both cell types. f, Top biological processes enriched for genes containing the 2,000 most intense SAR-seq peaks determined by GO analysis. The x-axis represents the enrichment value as the logarithm of FDR. G, H3K27ac signal at enhancers in i3Neurons ranked by H3K27ac ChIP–seq intensity. Red dashed line indicates the inflection point of the H3K27ac signal used to identify super-enhancers (cutoff 1,000). Accordingly, 1,385 enhancers were defined as super-enhancers. h, Bar graph showing the fraction of super-enhancers (left) and conventional enhancers (right) that overlap with SAR-seq peaks. The super-enhancers in the i3Neurons were defined by H3K27ac ChIP–seq intensity in g.
Extended Data Fig. 7 |
Extended Data Fig. 7 |. PARP and XRCC1 recruited to DNA repair sites.
a, Quantification of PAR levels with (n = 422 cells) and without (n = 541 cells) MMS treatment (red line, mean). Each dot represents one cell. Statistical significance was determined using two sided Mann–Whitney test (****P < 0.0001). Data are representative of three independent experiments. b, Anti-ADP-ribose ChIP–seq signal (n = 1) at an AsiSI restriction enzyme cut site (tick mark) in Abelson virus-transformed mouse pre-B cells. Cells were arrested in G0, and AsiSI double-strand breaks were induced for 18 h before ChIP. ADP-ribose is enriched at cleaved AsiSI sites and is increased by 20 min treatment with PARGi before fixation (AsiSI + PARGi), which is indicative of the presence of PAR. c, Genome browser screenshot illustrating the overlap between SAR-seq (n = 3), PAR (n = 1) and XRCC1 (n = 1) ChIP–seq signals in i3Neurons. Cells for PAR ChIP–seq were incubated with PARGi for 20 min before fixation.
Extended Data Fig. 8 |
Extended Data Fig. 8 |. Mapping regions of DNA damage and repair in neurons.
a, Genome browser example of SAR-seq profiles in non-treated (NT) or etoposide (ETO)-treated (18 h, 50 μM) i3Neurons. Data are from two biological replicates. b, Heat maps for SAR-seq in nontreated (NT) or etoposide- (ETO) treated (18 h, 50 μM) i3Neurons at −2 kb to +5 kb from the transcription start sites (TSS), ordered by ETO SAR-seq intensity. c, Immunofluorescence staining of the DSB markers γH2AX (red) and 53BP1 (green) in non-treated or ETO-treated (1 h) i3Neurons. Data are representative of three independent experiments. d, Genome browser showing SAR-seq and END-seq profiles in non-treated i3Neurons. END-seq, which detects DSBs specifically, does not detect any enriched signal (that is, above background) at SAR-seq peaks. END-seq signals are separated into positive (black) and negative (grey) strands. END-seq data are representative of two independent experiments. e, Heat maps of SAR-seq and XRCC1 ChIP–seq (n = 1) for 1 kb on either side of SAR-seq peak summits in cultured rat primary neurons, ordered by SAR-seq intensity. f, g, Scatter plots showing the correlation between SAR-seq and XRCC1 ChIP–seq intensities (RPKM) for 1 kb before and after SAR-seq peak summits in i3Neurons (f) and rat primary neurons (g). Spearman correlation coefficients and P values are indicated.
Extended Data Fig. 9 |
Extended Data Fig. 9 |. S1 END-seq mapping of SSBs.
a, Top, genome browser screenshot showing profiles of SAR-seq and S1 END-seq. Agarose plugs were incubated with or without the restriction enzyme Nt.BspQI before S1 treatment (n = 1). Bottom, expanded views of Nt.BspQI sites (tick mark) show detection of S1 END-seq upon Nt.BspQI treatment. S1 END-seq reads are separated into positive (black) and negative (grey) strands. b, Flow cytometry profile of G1-arrested MCF10A cells pulsed with EdU. MCF10A cells were treated with palbociclib (1 μM) for 48 h to arrest cells in G1. Doxycycline was added in the last 24 h to induce nickase expression. Data are representative of three independent experiments. For an example of the gating strategy used for flow cytometry in b and Extended Data Fig. 2c, see Supplementary Fig. 1. c, Genome browser screenshot showing S1 END-seq profiles at three Cas9 nickase targeting sites (tick marks: sgRNAs 1–3) in G1-arrested MCF10A cells treated with doxycycline (+Dox) to induce Cas9 expression (n = 1). S1 END-seq signals are separated into positive (black) and negative (grey) strands. d, Heat maps of SAR-seq and S1 END-seq signals in i3Neurons with ddN or without incubation (NT) for 1 kb on either side of the SAR-seq peak summits, ordered by SAR-seq intensity. e, Venn diagram showing the overlap between S1 END-seq peaks incubated with ddN and SAR-seq peaks in i3Neurons. n = 1,000 randomly shuffled datasets were generated to test the significance using one-sided Fisher’s exact test: P < 2.2 × 10⁻¹⁶. f, Distribution of the size of the gaps between positive- and negative-strand S1 END-seq peak summits in i3Neurons incubated with ddN. The median gap size is 25 bp (red dashed line). The positive-strand peak represents the right end and the negative-strand peak represents the left end of a detected DSB. g, Aggregate plot showing the distribution of CG dinucleotides (black) for 1 kb on either side of SAR-seq peak summits overlaid with SAR-seq signal (red). h, Aggregate plot showing the distribution of CG dinucleotides (black) for 1 kb on either side of SAR-seq peak summits or summits of ATAC–seq peaks (green) that are H3K4me1 positive but do not overlap with SAR-seq.
Extended Data Fig. 10 |
Extended Data Fig. 10 |. PARP, XRCC1 or POLB deficiency increases SAR.
a, Quantitative RT–PCR analysis showing the PARP1 mRNA transcript level in i3Neurons after CRISPRi knockdown (sgControl, control non-targeting sgRNA; sgPARP1, an sgRNA targeting PARP1), cultured in parallel with samples used for SAR-seq. P = 7.72 × 10⁻⁷ by unpaired two-tailed Student’s t-test; ****P < 0.00001 (n = 3). b, Genome browser screenshot displaying SAR-seq profiles from two biological replicates of i3Neurons treated with the PARP inhibitors olaparib, talazoparib, or veliparib, or using CRISPRi-mediated knockdown with sgControl or sgPARP1, in duplicates. NT, not treated. c, Quantitative RT–PCR analysis showing XRCC1 mRNA transcript level in i3Neurons after CRISPRi knockdown, cultured in parallel with samples used for SAR-seq. P = 1.88 × 10⁻⁵ by unpaired two-tailed Student’s t-test; ****P < 0.00001 (n = 3). d, Genome browser screenshots of SAR-seq profiles in i3Neurons expressing sgControl or sgXRCC1, in duplicate. e, Venn diagram showing the overlap of SAR-seq peaks between i3Neurons expressing sgControl and those expressing sgXRCC1. n = 1,000 random datasets were generated to test the significance of overlap (one-sided Fisher’s exact test: P < 2.2 × 10⁻¹⁶). f, Quantitative RT–PCR analysis showing POLB mRNA transcript levels in i3Neurons after CRISPRi knockdown, cultured in parallel with samples used for SAR-seq. P = 6.98 × 10⁻⁵ for sgPOLB1 and 5.82 × 10⁻⁵ for sgPOLB2 by unpaired two-tailed Student’s t-test; ****P < 0.00001 (n = 3). g, Western blot showing POLB protein levels in i3Neurons after CRISPRi knockdown, cultured in parallel with samples used for SAR-seq (n = 1). For gel source data, see Supplementary Fig. 2. h, Genome browser screenshots of SAR-seq profiles from two biological replicates of i3Neurons expressing sgControl or sgPOLB, in duplicate. i, Genome browser screenshots of SAR-seq profiles from two biological replicates of i3Neurons expressing sgControl or sgPOLB. Cells were pre-treated or not treated (NT) with 50 μM Aph for 24 h, and then also during incubation with EdU.
Extended Data Fig. 11 |
Extended Data Fig. 11 |. Localized SSB repair in neurons correlates with sites of oxidized 5-methylcytosine.
a, Genome browser screenshot of chromosome 7 showing SAR-seq profiles from two biological replicates and input DNA in i3Neurons without MMS treatment (NT, n = 2) or after treatment with 0.1 mg ml MMS (n = 2) for the final 15 min of an 18-h incubation with EdU. After streptavidin pull-down and PCR amplification, total DNA was quantified (NT rep 1: 0.95 μg; NT rep 2: 1.7 μg; MMS rep 1: 3.8 μg; MMS rep 2: 4.5 μg). Stochastic DNA damage results in loss of DNA synthesis at recurrent sites. b, Quantitative RT–PCR analysis showing PNKP mRNA transcript level in i3Neurons after CRISPRi knockdown, cultured in parallel with samples used for SAR-seq. P = 0.00015 by unpaired two-tailed Student’s t-test; ***P < 0.0001 (n = 3). c, Bottom, heat maps of SAR-seq intensities for 1 kb on either side of SAR-seq peak summits for i3Neurons expressing sgControl (n = 2) or sgPNKP (n = 2). Top, aggregate plots of SAR-seq intensity. d, Bottom, heat map of SAR-seq intensity for 1 kb on either side of the transcription start site in i3Neurons, ordered by SAR-seq intensity. i3Neurons expressing sgControl or sgPNKP were either not treated (NT, n = 2) or treated with 25 μM camptothecin (CPT, n = 2) during incubation with EdU. Top, aggregate plots of SAR-seq intensity. e, Scatter plots showing correlations of intensities (RPKM) between SSBs (ddN S1 END-seq) and 5fC or 5hmC, respectively, for 1 kb on either side of SAR-seq peak summits for i3Neurons. Spearman correlation coefficients and P values are indicated. f, Scatter plots showing correlations of intensities (RPKM) between SAR-seq for i3Neurons expressing sgPOLB and ddN S1 END-seq, 5fC, or 5hmC for 1 kb on either side of SAR-seq peak summits. Spearman correlation coefficients and P values are indicated.
Fig. 1 |
Fig. 1 |. SAR-seq peaks occur within enhancers and are associated with PARP activation.
a, Genome browser screenshots of SAR-seq (n = 3), ATAC–seq (n = 1), and ChIP–seq for H3K4me1 (n = 2), H3K27ac (n = 1), and MLL4 (n = 1) in i3Neurons. Below, expanded view of the indicated region to show overlapping peaks. b, Genome browser screenshot of SAR-seq performed in rat primary neurons (n = 1) as well as input. The culture was co-incubated with 5 μM aphidicolin to block DNA replication of S-phase glial cells. c, Representative images of i3Neurons with immunofluorescence staining for PAR (green) and the neuronal marker tubulin-β3 (red), counterstained with 4′,6-diamidino2-phenylindole (DAPI) (blue) (data are representative of three independent experiments). As a positive control, cells were treated with 0.1 mg ml−1 MMS for 15 min; NT, not treated. Boxed regions in top row are enlarged below. d, Heat maps of SAR-seq signal and ChIP–seq signals for XRCC1 and PAR for 1 kb on either side of SAR-seq peak summits in i3Neurons, ordered by SAR-seq
Fig. 2 |
Fig. 2 |. Single-strand breaks detected by S1 END-seq after incubation with ddN.
a, Top, genome browser screenshots illustrating the overlap in i3Neurons between sites of SAR-seq and SSBs (S1 END-seq) detected in the presence of ddN (n = 1) to block DNA ligation, or in its absence (NT, n = 1). The S1 END-seq signal is separated for positive (black) and negative (grey) strands. Bottom, expanded views demonstrating the presence of multiple SSBs within one SAR-seq peak. b, Aggregate plots of S1 END-seq signal (red, positive strand; blue, negative strand) and END-seq signal in the presence of ddN (n = 1) (black, positive strand; grey, negative strand) for 500 bp on either side of SAR-seq peak summits. RPM, reads per million. c, Composite DNA sequence motif for 5 bp on either side of SSB summits on the positive strand (right) and on the negative strand (left) of the 10,000 most prominent S1 END-seq peaks.
Fig. 3 |
Fig. 3 |. Localized SSB repair in neurons comprises short-patch and long-patch sub-pathways.
a, Bottom, heat maps of SAR-seq intensities for 1 kb on either side of SAR-seq peak summits for i3Neurons treated with the indicated PARP inhibitors (n = 3) or expressing non-targeted control (sgControl, n = 1) or PARP1-targeted (sgPARP1, n = 2) CRISPRi plasmids. Top, aggregate plots of SAR-seq intensity. Rep, replicate. b, Heat maps of SAR-seq intensities for 1 kb on either side of SAR-seq peak summits for i3Neurons expressing non-targeted control (sgControl, n = 2) or XRCC1-targeted (sgXRCC1, n = 2) CRISPRi plasmids. c, Heat maps of SAR-seq intensities for 1 kb on either side of SAR-seq peak summits for i3Neurons expressing non-targeted (sgControl, n = 2) or POLB-targeted (sgPOLB, n = 2) CRISPRi plasmids, either untreated or treated with 50 μM aphidicolin (Aph) for 24 h before and during EdU incorporation.
Fig. 4 |
Fig. 4 |. Localized SSB repair in neurons correlates with sites of oxidized 5-methylcytosine.
a, Genome browser screenshot illustrating the overlap in i3Neurons between sites of 5hmC (5hmC-Seal, n = 2),, 5fC (5fC-Seal, n = 2),, SSBs (ddN S1 END-seq), DNA repair synthesis (SAR-seq), and H3K4me1 ChIP– seq. Both positive (black) and negative (grey) S1 END-seq signal are shown. b, Heat maps of signals for DNA repair synthesis (SAR-seq), SSBs (ddN S1 END-seq), 5fC (5fC-Seal), and 5hmC (5hmC-Seal) in i3Neurons, for 1 kb on either side of the summits of the SAR-seq peaks and ordered by SAR-seq intensity. c, Model depicting the balance between short-patch and long-patch SSB repair at neuronal enhancers. Although our data suggest that SSBs arise during the base excision repair of modified cytosine residues within enhancers, we do not exclude the occurrence of other sites and sources of SSBs.

Comment in

References

    1. Caldecott KW Single-strand break repair and genetic disease. Nat. Rev. Genet. 9, 619– 631 (2008). - PubMed
    1. McKinnon PJ Genome integrity and disease prevention in the nervous system. Genes Dev. 31, 1180–1194 (2017). - PMC - PubMed
    1. Tubbs A. & Nussenzweig A. Endogenous DNA damage as a source of genomic instability in cancer. Cell 168, 644–656 (2017). - PMC - PubMed
    1. Miller MR & Chinault DN The roles of DNA polymerases alpha, beta, and gamma in DNA repair synthesis induced in hamster and human cells by different DNA damaging agents. J. Biol. Chem. 257, 10204–10209 (1982). - PubMed
    1. Fernandopulle MS et al. Transcription factor-mediated differentiation of human iPSCs into neurons. Curr. Protoc. Cell Biol. 79, e51 (2018). - PMC - PubMed

Publication types