. 2021 Apr;28(4):337-346.
doi: 10.1038/s41594-021-00572-y. Epub 2021 Mar 25.

A first exon termination checkpoint preferentially suppresses extragenic transcription

Affiliations

A first exon termination checkpoint preferentially suppresses extragenic transcription

Liv M I Austenaa et al. Nat Struct Mol Biol. 2021 Apr.

Abstract

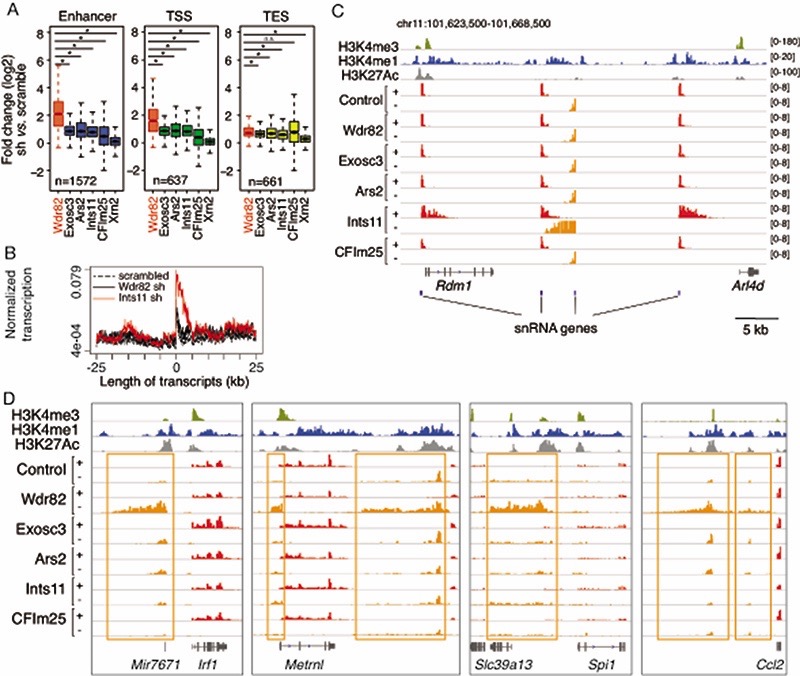
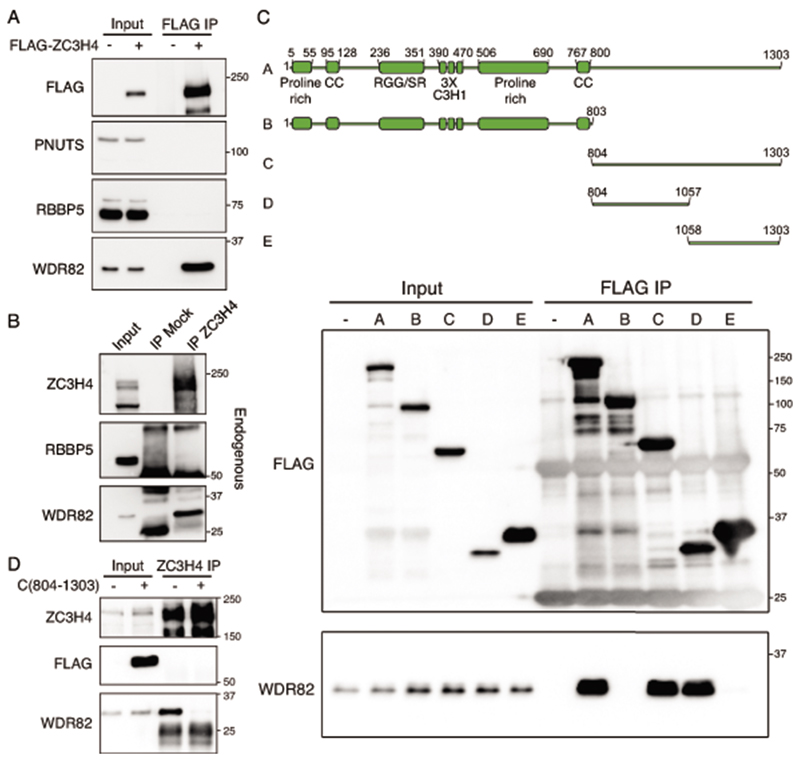
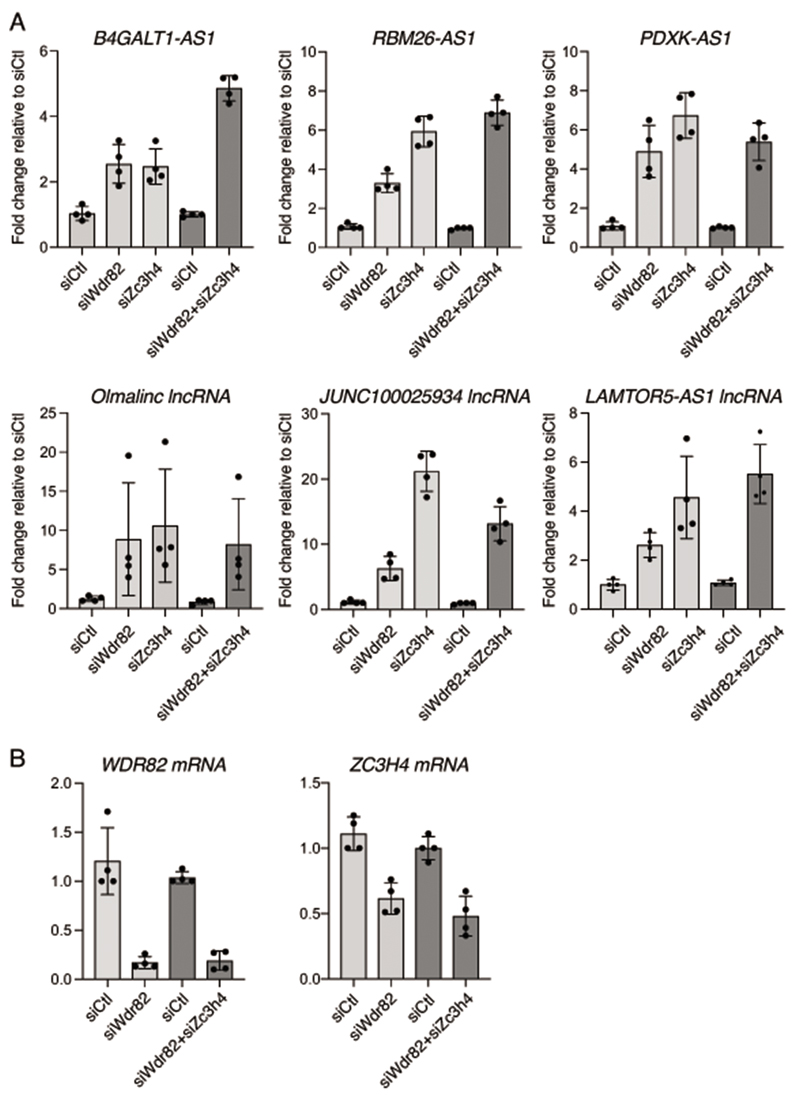
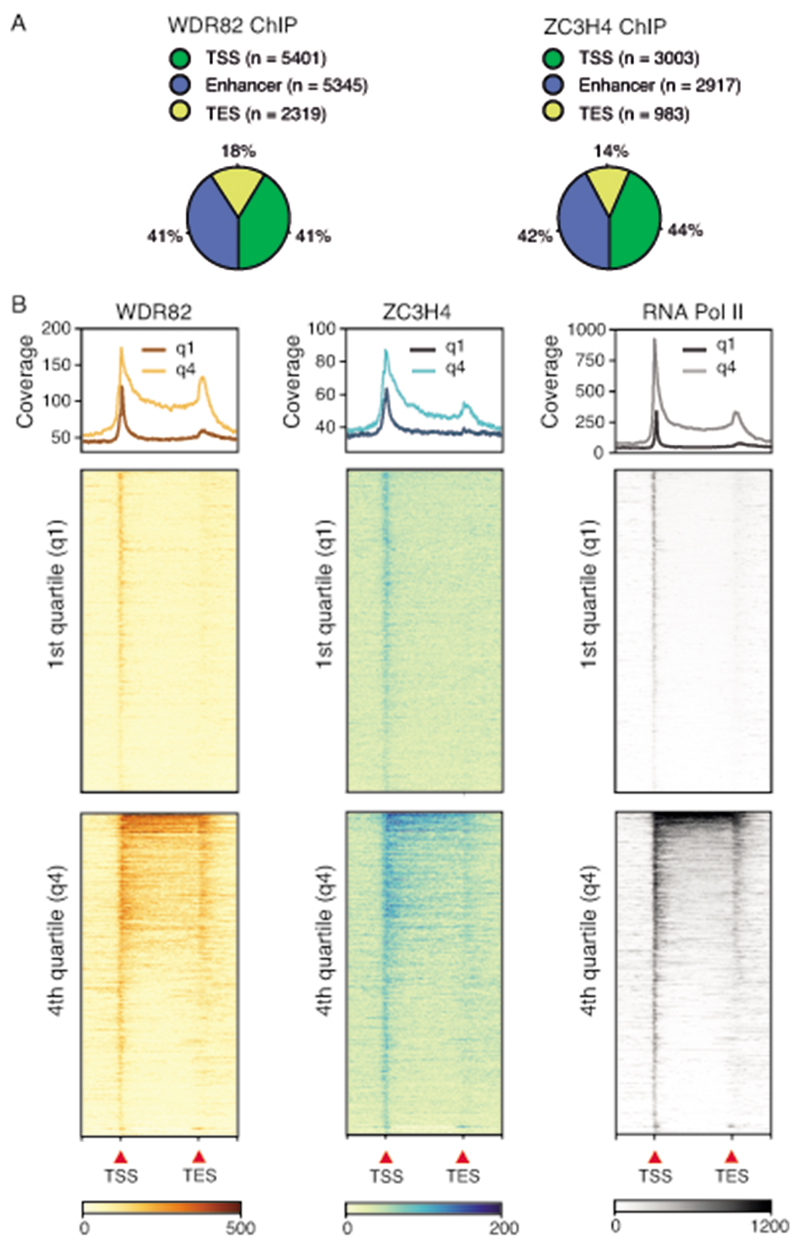
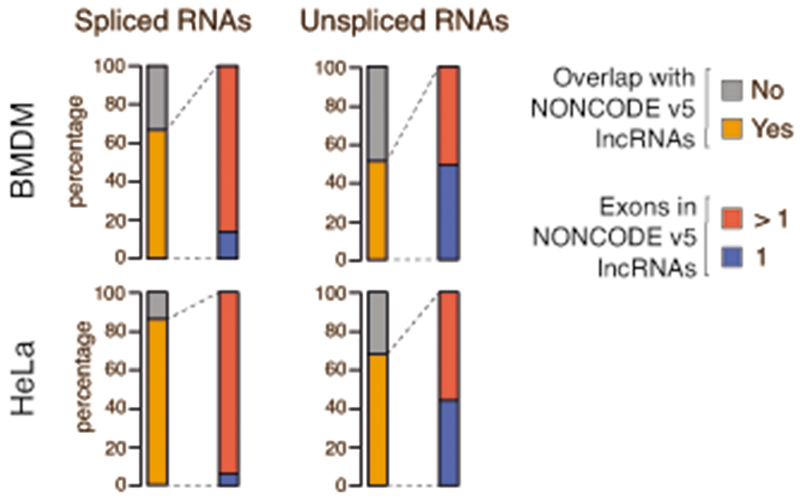
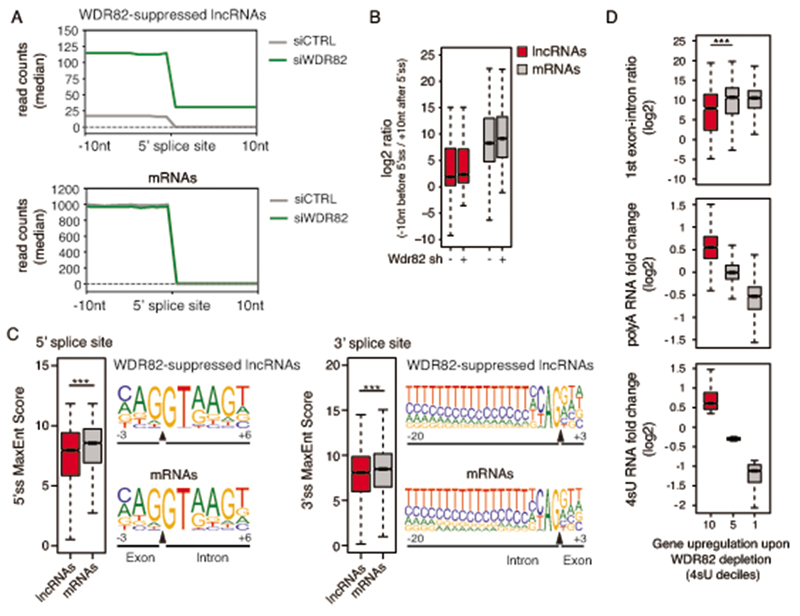
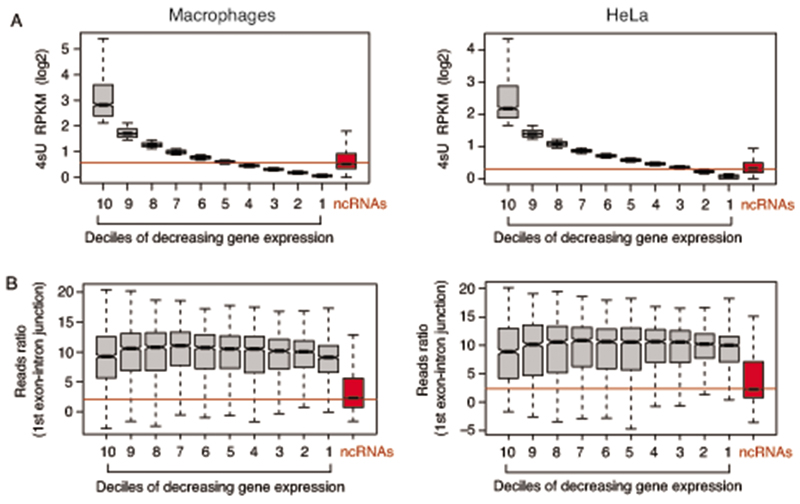
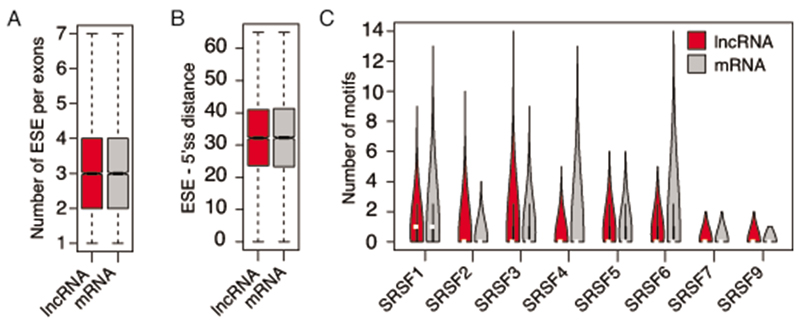
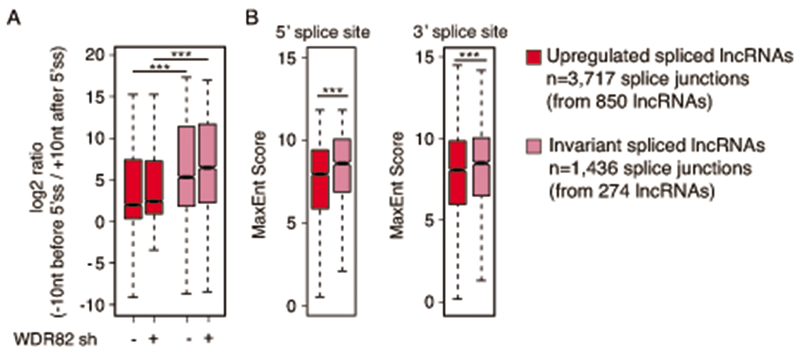
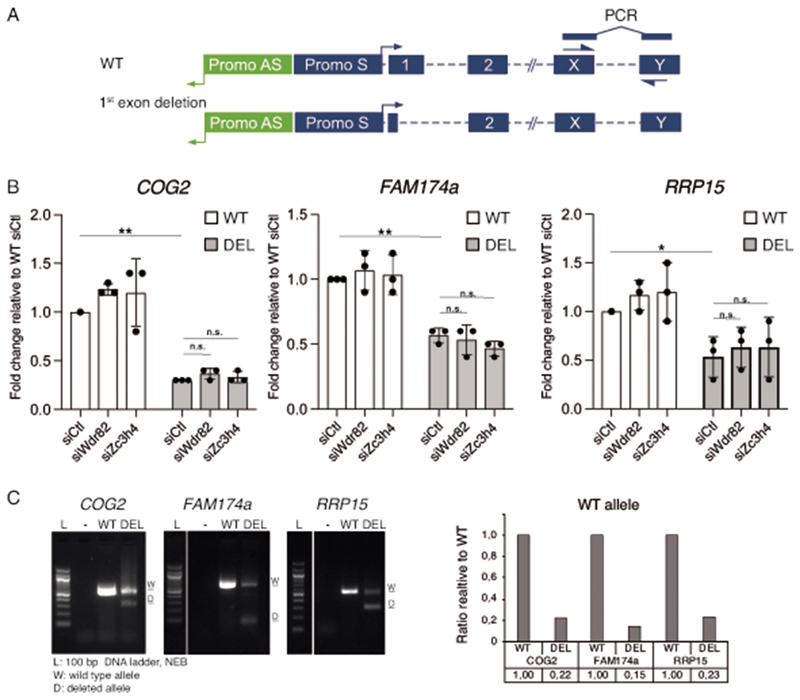
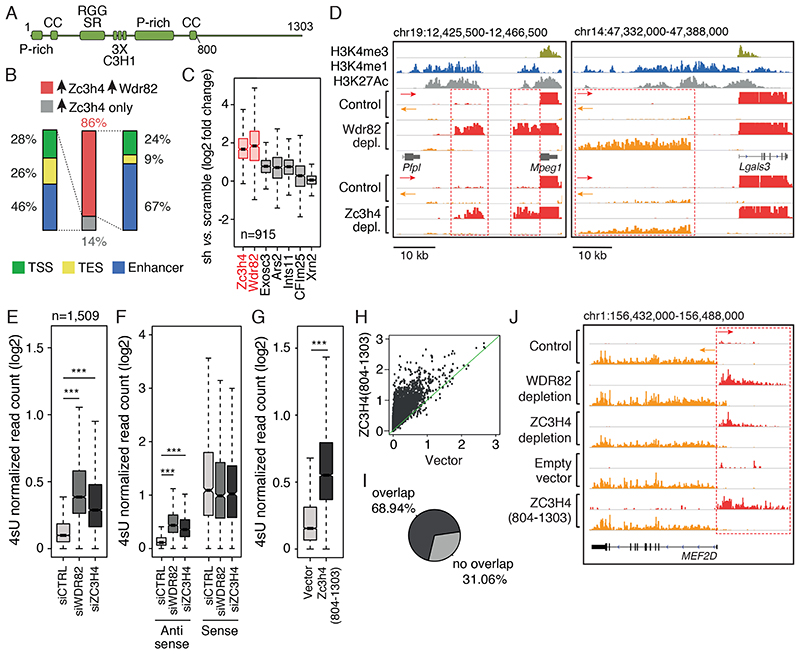
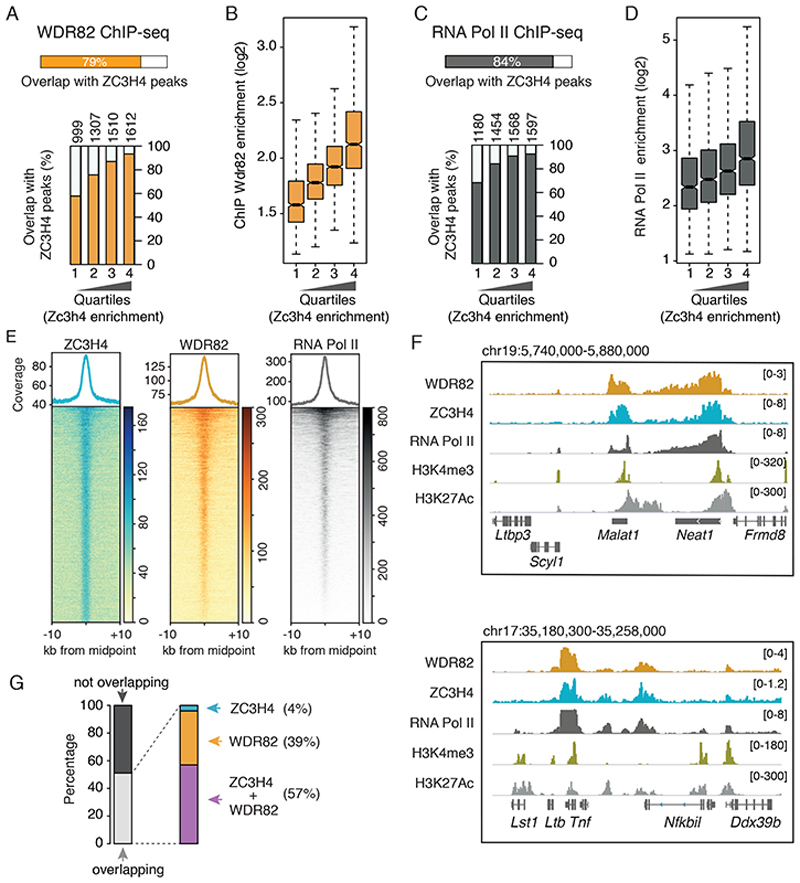
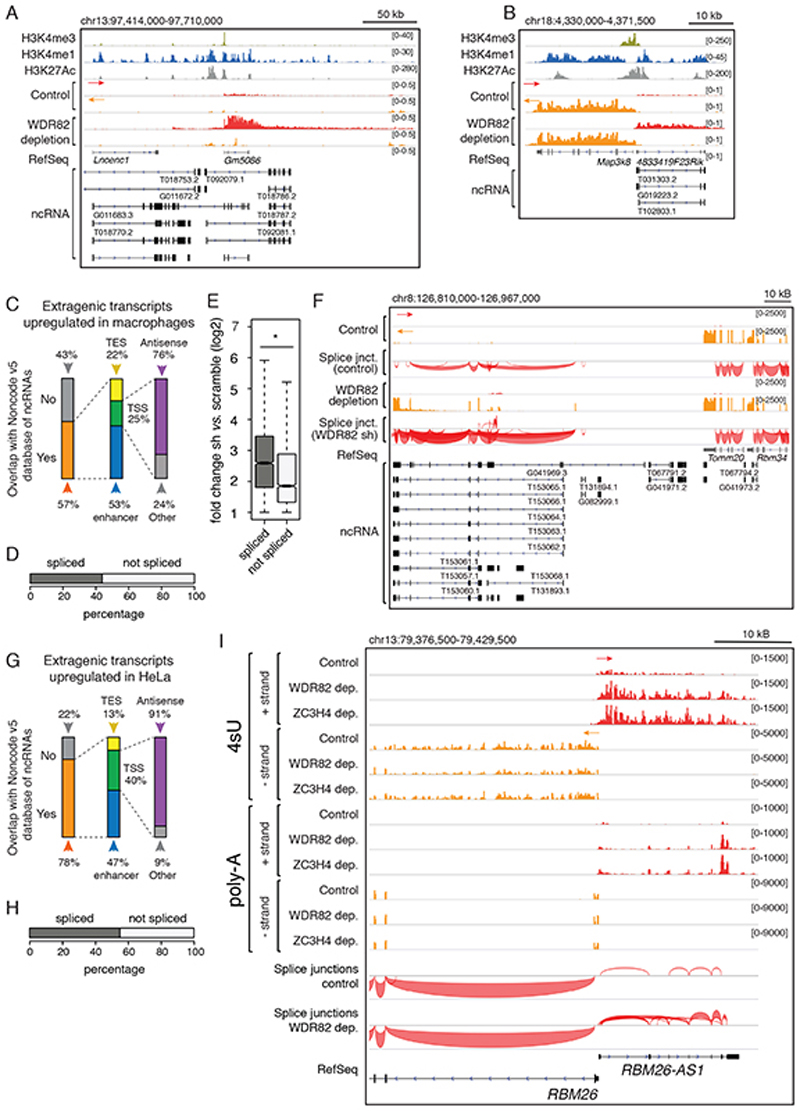
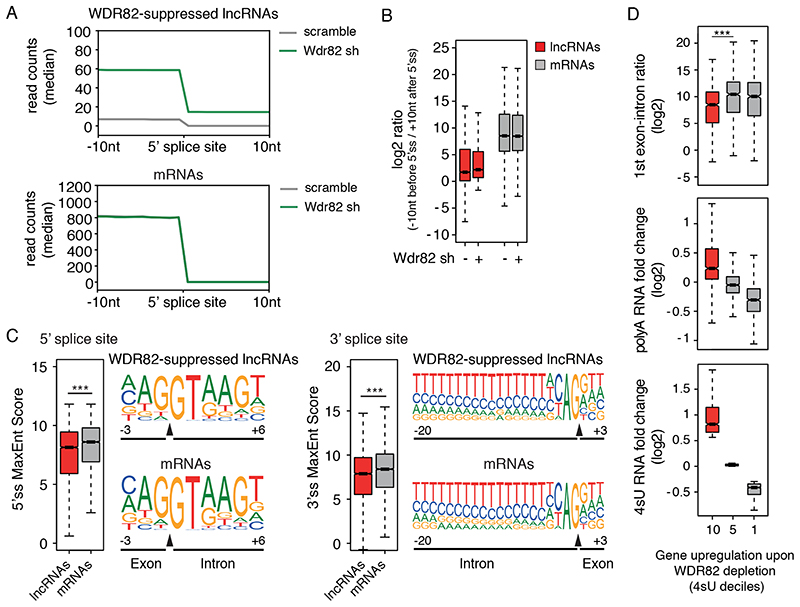
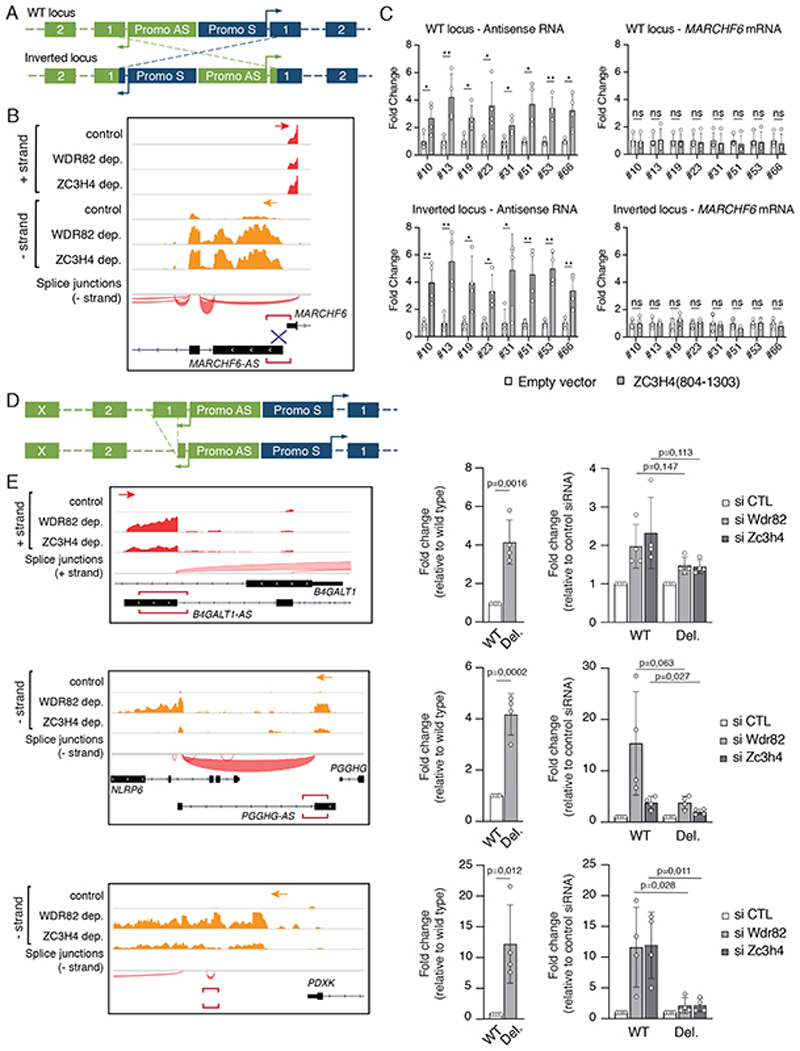
Interactions between the splicing machinery and RNA polymerase II increase protein-coding gene transcription. Similarly, exons and splicing signals of enhancer-generated long noncoding RNAs (elncRNAs) augment enhancer activity. However, elncRNAs are inefficiently spliced, suggesting that, compared with protein-coding genes, they contain qualitatively different exons with a limited ability to drive splicing. We show here that the inefficiently spliced first exons of elncRNAs as well as promoter-antisense long noncoding RNAs (pa-lncRNAs) in human and mouse cells trigger a transcription termination checkpoint that requires WDR82, an RNA polymerase II-binding protein, and its RNA-binding partner of previously unknown function, ZC3H4. We propose that the first exons of elncRNAs and pa-lncRNAs are an intrinsic component of a regulatory mechanism that, on the one hand, maximizes the activity of these cis-regulatory elements by recruiting the splicing machinery and, on the other, contains elements that suppress pervasive extragenic transcription.


Conflict of interest statement

Competing Interests Statement

The authors declare no competing interests.

Figures

Extended Data Fig. 1
Extended Data Fig. 1. Extragenic transcription in cells depleted of WDR82 or other transcription terminators
A) The effects of the depletion of known termination factors on extragenic transcription was measured by 4sU labeling and sequencing in mouse bone marrow-derived macrophages. We considered the n=2,870 extragenic regions whose transcription was increased in macrophages depleted of WDR82 at 45’ after LPS stimulation and measured their 4sU labeling in macrophages depleted of the indicated proteins. Each transcript was assigned to the nearest annotated enhancer, Transcription Start Site (TSS) or Transcription End Site (TES). The log2-transformed fold change (sh vs. scramble) for each depletion experiment is shown. Statistical significance was assessed using the two-tailed Wilcoxon signed rank test and a p-value ≤ 0.01 was considered significant. p-values for transcripts assigned to Enhancers: Exosc3 p-value= 2.2e-208, Ars2 p-value= 2.9e-206, Ints11 p-value= 1.4e-217, CFIm25 p-value= 4.4e-189, Xrn2 p-value= 9.2e-239. p-values for transcripts assigned to TSS: Exosc3 p-value= 4.6e-69, Ars2 p-value= 3.7e-73, Ints11 p-value= 1.6e-72, CFIm25 p-value= 7.1e-72, Xrn2 p-value= 7.8e-101. p-values for transcripts assigned to TES: Exosc3 p-value= 1.5e-14, Ars2 p-value= 5.8e-10, Ints11 p-value= 6.7e-26, CFIm25 p-value= 0.149775, Xrn2 p-value= 1.0e-81. *** = p-value <0.01. ns: not statistically significant. Inside the boxplot, the median value for each fold change is shown with a horizontal black line. Boxes show values between the first and the third quartile. The lower and upper whisker show the smallest and the highest value, respectively. Outliers are not shown. The notches correspond to ~95% confidence interval for the median. B) Comparison of the effects of the depletion of WDR82 and INTS11 on transcription termination at snRNA genes. C) A representative genomic region on mouse chromosome 11 containing multiple snRNA genes. D) Snapshots of genomic regions showing the effects of the depletion of WDR82 and other termination factors on extragenic transcription.
Extended Data Fig. 2
Extended Data Fig. 2. Interaction of WDR82 with the zinc finger protein ZC3H4.
A-B) Immunoprecipitations were carried out either with an anti-Flag antibody on extracts of HEK-293 cells transduced with a Flag-mouse ZC3H4 expression vector (A) or with an anti-ZC3H4 rabbit polyclonal antibody on extracts from Raw264.7 mouse macrophages (B). Different parts of the western blot membrane were hybridized with the indicated antibodies. Data are representative of n=4 independent experiments. The position of molecular weight markers (kDa) is shown on the right. Uncropped images are available online as Source Data. C) Upper panel: Schematic representation of (A) the full length human ZC3H4 protein and (B to E) its deletion mutants used in transfection and co-immunoprecipitation experiments. The ZC3H4 domains annotated in UniProt are shown. Bottom panel: lysates from HEK-293 cells, either untransfected (-) or transduced with the indicated Flag-ZC3H4 expression vectors (A-E) were used in co-immunoprecipitation experiments with an anti-Flag antibody. Inputs (left) and immunoprecipitates (right) were immunoblotted and probed with an anti-FLAG (top) or an anti-WDR82 (bottom) antibody as indicated. The position of molecular weight markers (kDa) is shown on the right. Uncropped images are available online as Source Data. D) The Flag-tagged ZC3H4 C-terminal fragment (804-1303) was expressed in HeLa cells. Lysates were immunoprecipitated with an anti-ZC3H4 antibody directed against aa. 677-765 and blotted with anti-Flag or anti-WDR82 antibody. Inputs are shown on the left and molecular weight markers (kDa) on the right. Uncropped images are available online as Source Data.
Extended Data Fig. 3
Extended Data Fig. 3. Effects of WDR82 and ZC3H4 co-depletion on extragenic transcription in HeLa cells.
A) The effects of WDR82, ZC3H4 or their combined depletion by siRNA transfection were measured on selected extragenic transcripts, as indicated. In co-depletion experiments, a double amount of siRNA was used, as indicated. The bar plots show the mean SD of n=4 biological replicates. The data were normalized on the housekeeping gene CDC25b. Light grey columns: 30pmol siRNA, dark grey columns, 60pmol siRNA. B) Depletion efficiency of WDR82 (left) and ZC3H4 mRNA (right) in individual and combined depletions. The bar plots show the mean SD of n=4 independent experiments.
Extended Data Fig. 4
Extended Data Fig. 4. Distribution of WDR82, ZC3H4 and RNA Pol II ChIP-seq peaks.
A) Classification of WDR82 and ZC3H4 ChIP-seq peaks based on their genomic location. TSS: Transcription Start Site; TES: Transcription End Site. Data are from n=2 independent experiments. B) Transcribed protein-coding genes (n=10,917) were divided into quartiles of increasing RNA Pol II occupancy. The heatmaps show WDR82, ZC3H4 and RNA Pol II ChIP-seq signals at genes of the 1st and 4th quartiles.
Extended Data Fig. 5
Extended Data Fig. 5. Analysis of spliced and unspliced lncRNAs suppressed by WDR82.
Extragenic transcripts upregulated upon WDR82 depletion in mouse macrophages (n=2,870; top) or in HeLa cells (n=1,509; bottom) were first divided into spliced (left) and unspliced RNA species (right). Then within each of these two groups they were further divided based on their overlap with lncRNAs in the NONCODE v5 database of non-coding RNAs, classified into single exon and multi-exonic ncRNAs.
Extended Data Fig. 6
Extended Data Fig. 6. Analysis of splice efficiency and splice site sequences of lncRNAs suppressed by ZC3H4-WDR82 in HeLa cells
A) Splicing efficiency at WDR82-suppressed lncRNA junctions (n=3,717) (top panel) and at a randomly selected set of premRNA junctions (n=4,000) (bottom panel) in HeLa cells. A window of +/− 10 nucleotides centered on the 5’ splice sites was used to measure read counts in polyA RNA-seq data. B) log2-transformed ratio of polyA RNA-seq reads in a 20 nt window centered on the 5’ splice sites of WDR82-suppressed lncRNA or of randomly selected set of mRNAs with at least one splice junction. C) Analysis of 5’ (left) and 3’ (right) splice site strength (measured as MaxEnt scores) at WDR82-suppressed lncRNAs. Statistical significance was assessed using the two-tailed Wilcoxon rank sum test in correspondence of both the 5’ (p-value=1.2e-21) and the 3’ (p-value=2.6e-06) splice sites. ***=p-value <0.01. Nucleotide frequencies at splice sites are shown as sequence logos. Donor and acceptor splice sites are indicated as black triangles. D) Effects of the depletion of WDR82-ZC3H4 on transcription of protein coding genes in HeLa cells. Expressed protein-coding genes (n=8,804) were divided into deciles based on their sensitivity to the depletion of WDR82 in 4sU-seq data, with the 10th decile including the most upregulated genes. Log2-transformed RNA fold changes (polyA and 4sU RNA-seq data) and log2-transformed reads ratio across the first exon-intron junction, as annotated in GENCODE, are shown for the 10th, 5th and 1st deciles. Statistical significance was assessed using the two-tailed Wilcoxon rank sum test (pvalue = 2.0e-21). ***=p-value<0.01. Data were from n=3 independent experiments. In the boxplots in panels B, C, D the median value for each group is shown with a horizontal black line. Boxes show values between the first and the third quartile. The lower and upper whisker show the smallest and the highest value, respectively. Outliers are not shown. The notches correspond to ~95% confidence interval for the median.
Extended Data Fig. 7
Extended Data Fig. 7. Relationship between gene transcript expression and splicing efficiency.
A) Genes were ranked into deciles of decreasing expression based on 4sU-seq data in macrophages (left) and HeLa cells (right). In both panels, expression of the lncRNAs upregulated in WDR82-depleted cells is shown in the red boxes on the right. Data are from n=3 independent experiments. B) Splicing efficiency of the 1st exon of the ranked genes was measured by dividing the sequencing reads in the 10nt upstream by those in the 10nt downstream of the 5’ splice junction in polyA RNA-seq data. Left: macrophages (n=6,280 junctions); right: HeLa (n=8,804 junctions). Data are from n=3 independent experiments. Boxes show values between the first and the third quartile. The lower and upper whisker show the smallest and the highest value, respectively. Outliers are not shown. The notches correspond to ~95% confidence interval for the median.
Extended Data Fig. 8
Extended Data Fig. 8. Exonic splice enhancer (ESE) sequences in exons of WDR82-suppressed lncRNAs and in mRNAs.
A) Number of ESE per exon in lncRNAs and in mRNAs suppressed by WDR82 in macrophages. Data are from n=3 independent experiments. B) Distance between ESEs and 5’ splice sites in lncRNAs and in mRNAs suppressed by WDR82. Data are from n=3 independent experiments. C) Number of ESEs per exon recognized by individual SRSF proteins in lncRNAs and in mRNAs suppressed by WDR82.
Extended Data Fig. 9
Extended Data Fig. 9. Characterization of splicing efficiency and splice site quality of extragenic transcripts not affected by WDR82 depletion.
A) log2-transformed ratio of polyA RNA-seq reads upstream and downstream of the 5’ splice sites of WDR82-suppressed and WDR82-insensitive lncRNAs in HeLa cells. Statistical significance was assessed using the two-tailed Wilcoxon rank sum test (p-value= 1.8e-175 for the controls and p-value=1.3e-199 in Wdr82-depleted cells). ***p-value < 0.01. Data are from n=3 independent experiments. B) Analysis of 5’ (left) and 3’ (right) splice site strength at WDR82-suppressed and WDR82-insensitive lncRNAs in HeLa cells. MaxEnt scores for both donor and acceptor splice sites were measured. Statistical significance was assessed using the two-tailed Wilcoxon rank sum test in correspondence of both the 5’ (p-value= 1.3e-20) and the 3’ (p-value= 3e-04) splice sites. *** p-value < 0.01. Data are from n=3 independent experiments. Boxes show values between the first and the third quartile. The lower and upper whisker show the smallest and the highest value, respectively. Outliers are not shown. The notches correspond to ~95% confidence interval for the median.
Extended Data Fig. 10
Extended Data Fig. 10. First exon deletions in protein coding genes.
A) Schematic representation of the deletion of the first exons of protein coding genes. sgRNAs were designed to remove a genomic sequence that included the first exon from 30-50nt downstream of the TSS to the intronic sequences just downstream of the 5’ splice site. B) Expression of the indicated gene mRNAs was measured by qRT-PCR in bulk populations of wild type or first exon-deleted HeLa cells after transduction of the indicated siRNAs. Primers used were specific for spliced mRNAs and were designed on downstream exons (Methods). The plot shows the mean s.d. of n=3 independent experiments. * P < 0.05; **P < 0.01, by two tailed t-test. The data were normalized on the housekeeping gene NRSN2. P-values for COG2: WT vs. DEL siCtl = 1.75E-07; DEL siCtl vs. siWdr82 = 0.78 (n.s.); DEL siCtl vs. siWdr82 = 0.80 (n.s.). P-values for FAM174a: WT vs. DEL siCtl = 0.0005; DEL siCtl vs. siWdr82 = 0.85 (n.s.); DEL siCtl vs. siWdr82 = 0.15 (n.s.). P-values for RRP15: WT vs. DEL siCtl = 0.013; DEL siCtl vs. siWdr82 = 0.70 (n.s.); DEL siCtl vs. siWdr82 = 0.65 (n.s.) C) First exon deletion efficiency at the three genes tested was analyzed by genomic PCR. The quantification of the wild type allele gel band in wt cells and cells in which the first exon was deleted using sgRNAs+Cas9 is shown on the right. Uncropped images are available online as source data.
Figure 1
Figure 1. Effects of ZC3H4 depletion on extragenic transcription.
A) Schematic representation of the ZC3H4 protein with annotated domains. P-rich: proline-rich region; CC: coiled-coil; RGG: Arginine-Glycine-rich domain; SR: Arginine-Serine dipeptide-rich motif; C3H1: CCCH type Zn fingers. B) Overlap between extragenic transcripts upregulated upon ZC3H4 depletion (n=915) and those upregulated upon WDR82 depletion (n=3) in mouse macrophages. Genomic annotation of transcripts concordantly upregulated upon depletion of ZC3H4 and WDR82 or transcripts upregulated only upon depletion of ZC3H4. TSS = Transcription Start Site; TES = Transcription End Site. Data from n=3 independent experiments are shown. C) Effects of the depletion ZC3H4 and other termination factors on transcription of extragenic regions suppressed by WDR82 in mouse macrophages. Data from n=3 independent experiments are shown. D) Representative genomic regions showing the effects of WDR82 and ZC3H4 depletion on extragenic transcription in macrophages. Red and orange tracks correspond to plus and minus strand RNAs, respectively. E) Upregulation of extragenic transcription in HeLa cells depleted of WDR82 or ZC3H4 by siRNA transfection. Read counts at n=1,513 extragenic regions upregulated in HeLa cells depleted of WDR82 are reported. Data from n=3 independent experiments are shown. Statistical significance was assessed using the two-tailed Wilcoxon signed rank test (p-value < 2.2e-16 in both comparisons). *** = p-value <0.01. F) Promoter-antisense RNAs (n=429) upregulated in 4sU-seq data sets upon WDR82 or ZC3H4 depletion in HeLa cells. Transcription of the paired sense (coding) RNAs is shown. Data from n=3 independent experiments are shown. Statistical significance was assessed using the two-tailed Wilcoxon signed rank test for the comparison between siWDR82 vs. siCTRL (p-value=1.9e-210) and siZC3H4 vs siCTRL (p-value=1.1e-203). *** = p-value <0.01. G) Effects of ZC3H4(804-1303) overexpression on transcription of the n=1,509 extragenic regions upregulated in WDR82-depleted HeLa cells. Data from n=3 independent experiments are shown. Statistical significance was assessed using the two-tailed Wilcoxon signed rank test (p-value < 2.2e-16). H) Same data as in panel G were represented as scatter plot. I) Overlap of the transcripts upregulated upon over-expression of ZC3H4(804-1303) and the transcripts upregulated in HeLa cells depleted of WDR82 or ZC3H4. J) A representative genomic region showing MEF2D sense and promoter-antisense transcription in HeLa cells depleted of WDR82 or ZC3H4 or over-expressing ZC3H4(804-1303). For panels C, E and F, the median value for each fold change is shown with a horizontal black line. Boxes show values between the first and the third quartile. The lower and upper whisker show the smallest and the highest value, respectively. Outliers are not shown. The notches correspond to ~95% confidence interval for the median.
Figure 2
Figure 2. Recruitment of the ZC3H4-WDR82 complex to genomic sites with high RNA Pol II occupancy in mouse macrophages.
A) Overlap of WDR82 peaks with ZC3H4 peaks in Raw264.7 mouse macrophages. Below, ZC3H4 peaks were divided into quartiles of increasing signal intensity with respect to the input and the overlap of WDR82 with ZC3H4 peaks in each quartile was measured. B) Signal intensity of WDR82 ChIP-seq peaks was measured at ZC3H4-bound genomic regions, divided into quartiles of increasing ZC3H4 signal. Data from n=2 independent ChIP-seq experiments are shown. C) Overlap of RNA Pol II with ZC3H4 peaks. Below, ZC3H4 ChIP-seq peaks were divided into quartiles of increasing signal intensity and the overlap of RNA Pol II with ZC3H4 peaks in each quartile was measured. D) Signal intensity of RNA Pol II peaks was measured in ZC3H4-bound genomic regions, divided into quartiles of increasing ZC3H4 signal. Data from n=2 independent ChIP-seq experiments are shown. E) WDR82 and RNA Pol II ChIP-seq signals are shown in correspondence of the midpoint (+/− 10kb) of the ZC3H4 peaks. The heatmap was ordered based on the increasing coverage of RNA Pol II inside ZC3H4 peaks. For more details see the Online Methods. F) Two representative genomic regions showing the overlap between WDR82, ZC3H4 and RNA Pol II in Raw264.7 mouse macrophages. H3K4me3 and H3K27Ac are also shown. G) Overlap between the n=2,870 extragenic regions at which transcription was upregulated upon WDR82 depletion with WDR82 and/or ZC3H4 ChIP-seq peaks. For panels B and D, the median value for each fold change is shown with a horizontal black line. Boxes show values between the first and the third quartile. The lower and upper whisker show the smallest and the highest value, respectively. Outliers are not shown. The notches correspond to ~95% confidence interval for the median.
Figure 3
Figure 3. Control of lncRNA production by WDR82-ZC3H4.
A-B) A representative candidate enhancer (A) and promoter (B) showing the overlap of WDR82-suppressed transcription with annotated lncRNAs in macrophages. C) Overlap between WDR82-suppressed extragenic transcripts (n=2,870) in mouse macrophages and lncRNAs in the NONCODE v5 database. TSS = Transcription Start Site; TES = Transcription End Site. D) Transcripts upregulated upon WDR82 depletion in 4sU RNA-seq data in mouse macrophages (n=2,870) were classified as spliced (n=1,292) or unspliced (n=1,578) based on polyA RNA-seq data. E) Signal intensity of spliced and unspliced WDR82-suppressed transcripts detected in 4sU-seq data in mouse macrophages (n=4 independent experiments). The median value for each fold change is shown with a horizontal black line. Boxes show values between the first and the third quartile. The lower and upper whisker show the smallest and the highest value, respectively. Outliers are not shown. The notches correspond to ~95% confidence interval for the median. Statistical significance was assessed using the two-tailed Wilcoxon rank sum test (p-value=2.1e-92). * = p-value < 0.01. F) PolyA-RNA-seq snapshot from mouse macrophages showing splice junctions at a representative genomic region containing lncRNAs whose expression was increased upon WDR82 depletion. G) Overlap between transcripts upregulated in 4sU-seq datasets from HeLa cells depleted of WDR82 (n=1,509) and lncRNAs annotated in NONCODE v5. H) Transcripts identified as upregulated in 4sU RNA-seq data in HeLa cells depleted of WDR82 (n=1,509) were classified as spliced (n = 850) or unspliced (n = 659) based on polyA RNA-seq data. I) Representative genomic region showing a coding gene (RBM26) and the associated promoter-antisense transcription in HeLa cells depleted of WDR82 or ZC3H4. Strand-specific 4sU-seq and polyA RNA-seq data are shown.
Figure 4
Figure 4. lncRNAs suppressed by ZC3H4-WDR82 contain inefficiently spliced exons.
A) Splicing efficiency at junctions (n=6,280) of WDR82-sensitive lncRNAs (top) and at a randomly selected set of mRNA junctions (n = 6,500) (bottom) in mouse macrophages. A window of +/− 10 nucleotides centered on the 5’ splice sites was used to measure read counts in polyA RNA-seq data. B) log2-transformed ratio of polyA RNA-seq reads in a window of 20 nucleotides centered on the 5’ splice sites of WDR82-suppressed lncRNA (n=6,280) and of randomly selected set of mRNAs (n = 6,500) with at least one splice junction. C) Analysis of 5’ (left) and 3’ (right) splice site strength at WDR82-suppressed lncRNAs (n=6,280 junctions) and randomly selected mRNA (n=6,500 junctions). MaxEnt scores were measured as described. Statistical significance was assessed using the two-tailed Wilcoxon rank sum test in correspondence of both the 5’ (p-value=3.3e-34) and the 3’ (p-value=1.3e-22) splice sites. Nucleotide frequencies at splice sites are shown as sequence logos. Donor and acceptor splice sites are indicated with a black triangle in correspondence of the sequence. *** = p-value < 0.01. D) Effects of the depletion of WDR82-ZC3H4 on transcription of protein coding genes in mouse macrophages. Expressed protein-coding genes (n=9,466) were divided into deciles based on their sensitivity to the depletion of WDR82 in the 4sU-seq data, with the 10th decile including the most upregulated genes. The log2-transformed RNA fold changes (polyA and 4sU RNA-seq data) and the log2-transformed reads ratio across the first exon-intron junction are shown for the genes (n=946 in each group) in the 10th, 5th and 1st deciles. Statistical significance was assessed using the two-tailed Wilcoxon signed rank test (p-value=4.5e-22). * = p-value < 0.01. Data were from n=3 independent experiments. For panels B, C and D, the median value for each fold change is shown with a horizontal black line. Boxes show values between the first and the third quartile. The lower and upper whisker show the smallest and the highest value, respectively. Outliers are not shown. The notches correspond to ~95% confidence interval for the median.
Figure 5
Figure 5. A first exon transcription termination checkpoint.
A) Schematic drawing showing promoter/TSS inversions at sense/antisense transcription units. B) Snapshot of the MARCHF6 - MARCHF6-AS genomic locus. Plus strand (red) and minus strand (orange) polyA-RNA-seq data in control, WDR82-depleted and ZC3H4-depleted HeLa cells are shown. C) Effects of the over-expression of ZC3H4(804-1303) on the sense and antisense transcriptional units of the MARCHF6 locus at wild type and promoter-inverted alleles. Data are shown as mean ± s.d. from n=4 independent experiments. *P < 0.05, ** P < 0.01, by two tailed t-test. D) Schematic drawing showing the deletion of the first exon of pa-lncRNAs generated using Crispr/Cas9 in HeLa cells. E) Effects of first exon deletion on pa-lncRNA transcription. On the left, polyA-RNA-seq data in control, WDR82-depleted and ZC3H4-depleted HeLa cells are shown (plus strand RNA: red; minus strand RNA: orange). The genomic regions deleted by Crispr-Cas9 are indicated by red horizontal square brackets. Effects of WDR82 or ZC3H4 depletion on the transcription of the wild type (WT) or first exon-deleted (Del.) pa-lncRNAs are shown on the right. The bar plots show the mean s.d. of RNA fold changes measured in n=4 independent experiments. P values obtained by two-tailed t-test are shown for the indicated comparisons. All the data were normalized based on the housekeeping gene NRSN2 or CDC25B.

Similar articles

Cited by

References

    1. Konarska MM, Padgett RA, Sharp PA. Recognition of cap structure in splicing in vitro of mRNA precursors. Cell. 1984;38:731–736. - PubMed
    1. Izaurralde E, et al. A nuclear cap binding protein complex involved in pre-mRNA splicing. Cell. 1994;78:657–668. - PubMed
    1. Herzel L, Ottoz DSM, Alpert T, Neugebauer KM. Splicing and transcription touch base: co-transcriptional spliceosome assembly and function. Nat Rev Mol Cell Biol. 2017;18:637–650. doi: 10.1038/nrm.2017.63. - DOI - PMC - PubMed
    1. Fong YW, Zhou Q. Stimulatory effect of splicing factors on transcriptional elongation. Nature. 2001;414:929–933. doi: 10.1038/414929a. - DOI - PubMed
    1. Lin S, Coutinho-Mansfield G, Wang D, Pandit S, Fu XD. The splicing factor SC35 has an active role in transcriptional elongation. Nat Struct Mol Biol. 2008;15:819–826. doi: 10.1038/nsmb.1461. - DOI - PMC - PubMed

Publication types

MeSH terms