

Imaging dental fluorosis at SWIR wavelengths from 1300 to 2000-nm
- PMID: 33767522
- PMCID: PMC7989784
- DOI: 10.1117/12.2588696
Imaging dental fluorosis at SWIR wavelengths from 1300 to 2000-nm
Abstract
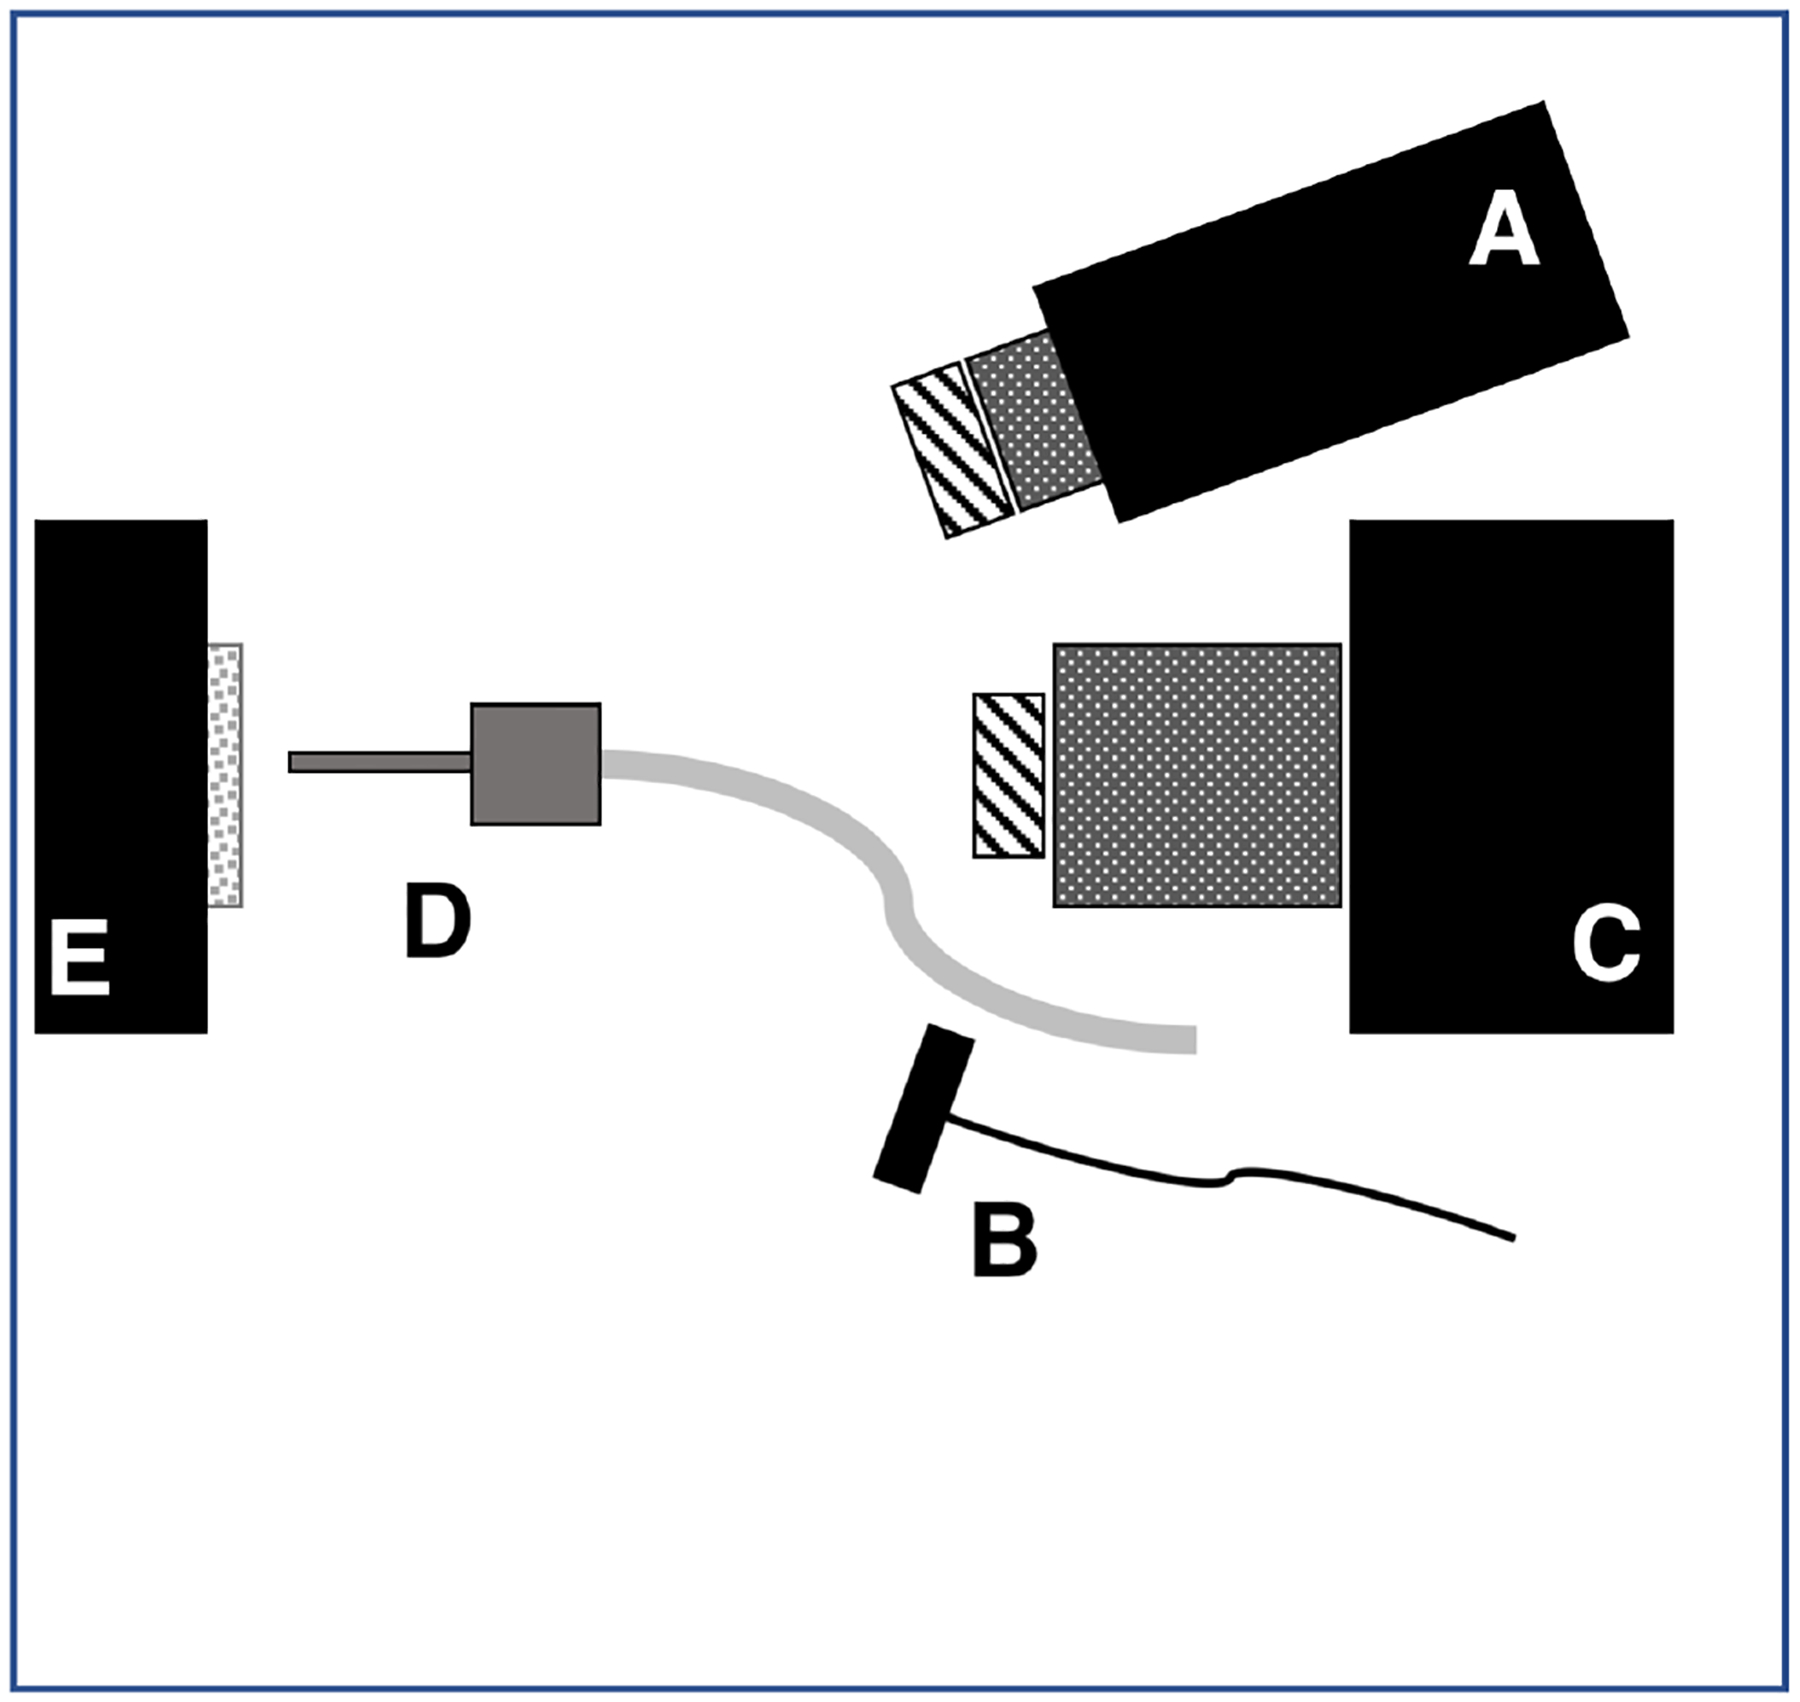
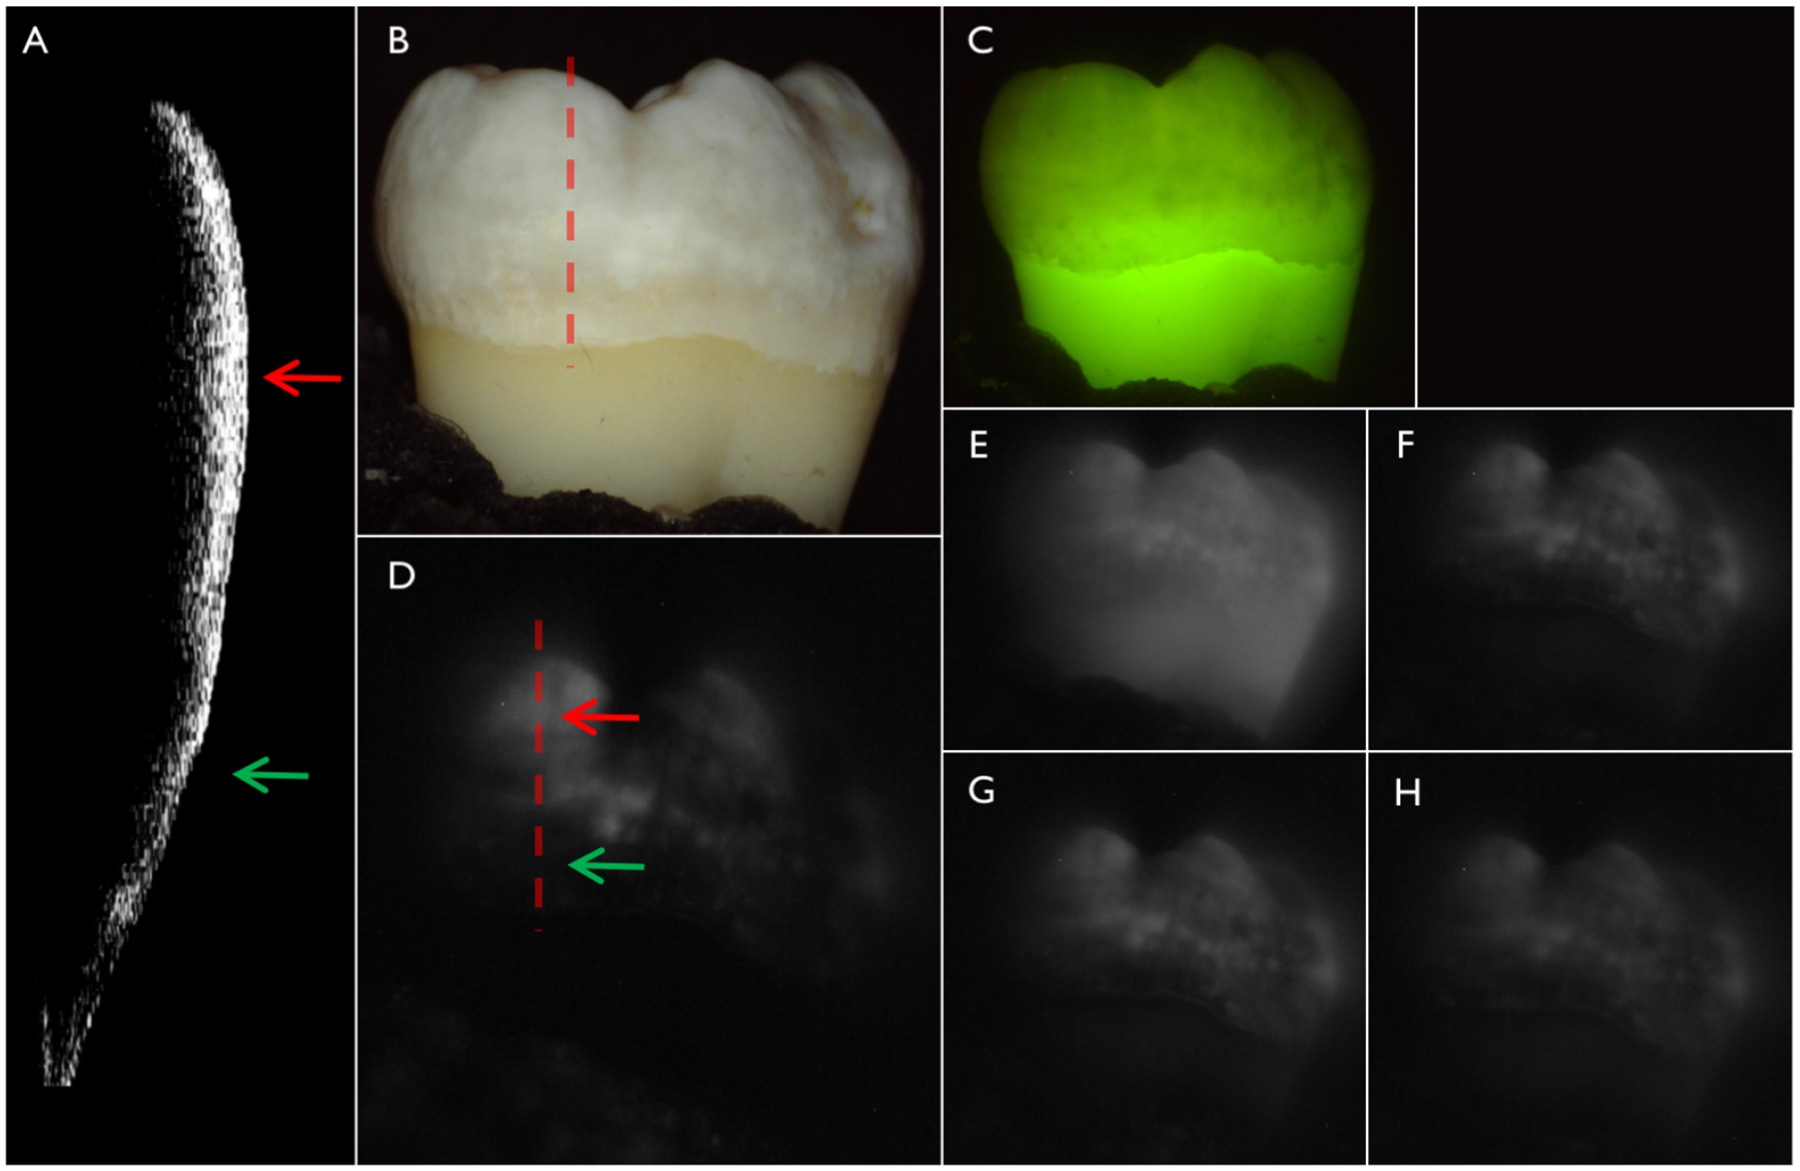
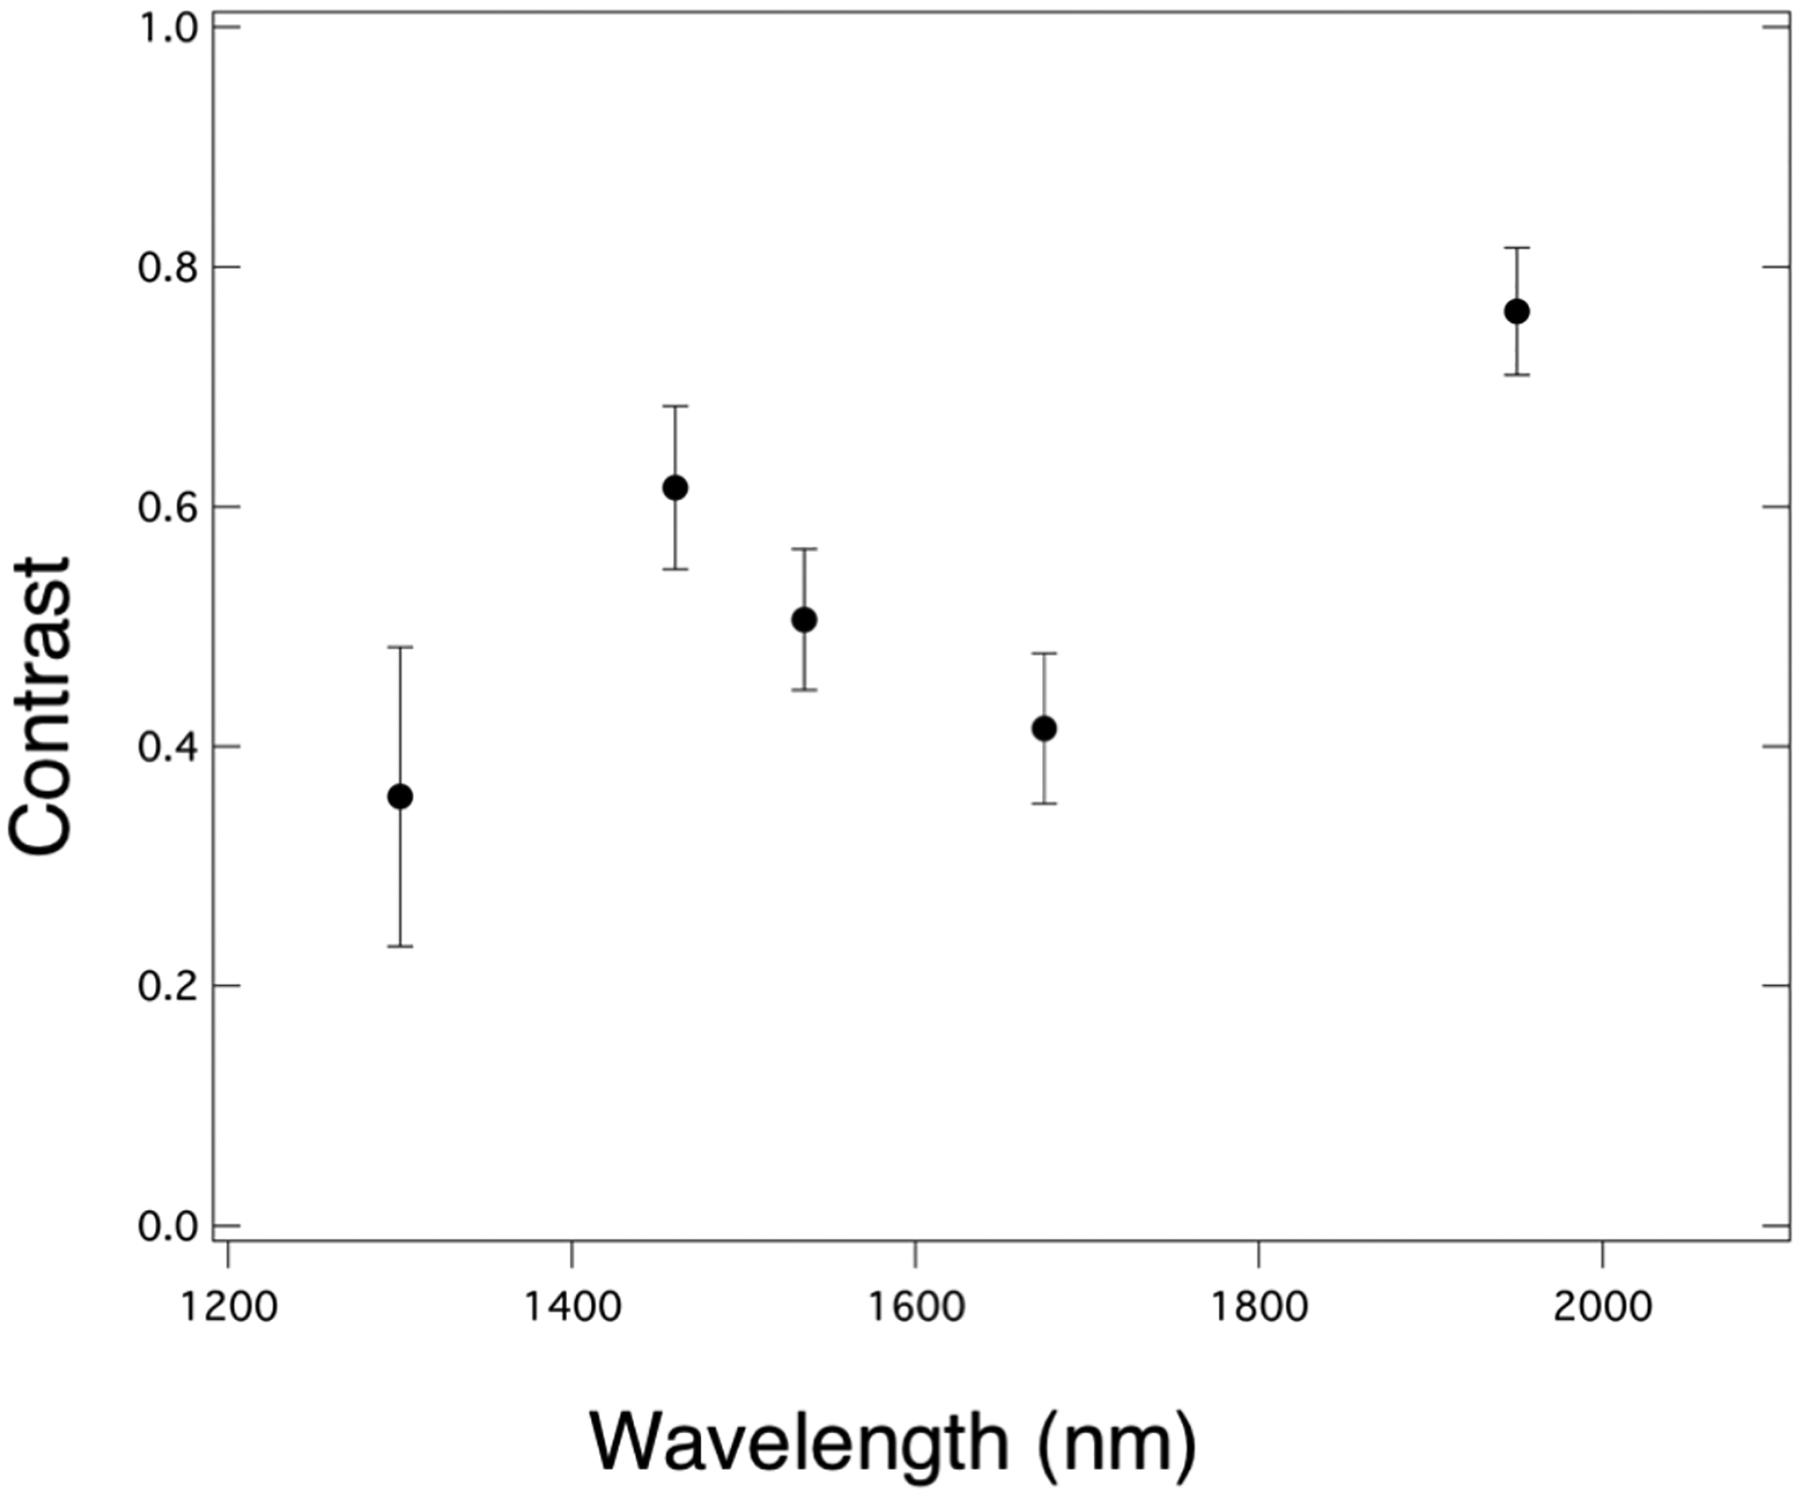
Dental fluorosis is an increasing problem in the U.S. due to excessive exposure to fluoride from the environment. Fluorosis causes hypomineralization of the enamel during tooth development and mild fluorosis is visible as faint white lines on the tooth surface while the most severe fluorosis can result in pitted surfaces. It is difficult to quantify the severity of fluorosis and assessments are limited to subjective visual assessments. Dental fluorosis appears with very high contrast at short wavelength infrared (SWIR) wavelengths beyond 1400-nm and we hypothesize that these wavelengths may be better suited for detecting mild fluorosis and for estimating the severity. In this study the contrast of fluorosis of varying severity on extracted human permanent teeth was measured at SWIR wavelengths ranging from 1300-2000-nm using an extended range InGaAs camera and broadband light sources. Cross polarization optical coherence tomography was used to measure the depth of hypomineralization.
Keywords: SWIR imaging; dental fluorosis; optical coherence tomography.
Figures
References
-
- Fejerskov O, Nyvad B, and Kidd E, Dental Caries: The Disease and its Clinical Management Wiley Blackwell, (2015).
-
- Beltran-Aguilar ED, Barker LK, Canto MT, Dye BA, Gooch BF, Griffin SO, Hyman J, Jaramillo F, Kingman A, Nowjack-Raymer R, Selwitz RH, and Wu T, “Surveillance for dental caries, dental sealants, tooth retention, edentulism, and enamel fluorosis--United States, 1988–1994 and 1999–200,” MMWR Surveill Summ, 54(3), 1–43 (2005). - PubMed
-
- Angmar-Mansson B, de Josselin de Jong E, Sundstrom F, and ten Bosch JJ, “Strategies for improving the assessment of dental fluorosis: focus on optical techniques,” Adv Dent Res, 8(1), 75–9 (1994). - PubMed
-
- Li SM, Zou J, Wang Z, Wright JT, and Zhang Y, “Quantitative assessment of enamel hypomineralization by KaVo DIAGNOdent at different sites on first permanent molars of children in China,” Pediatr Dent, 25(5), 485–90 (2003). - PubMed
Grants and funding
LinkOut - more resources
Full Text Sources
Other Literature Sources