. 2021 Feb:99:101983.
doi: 10.1016/j.foodpol.2020.101983.

Cost and affordability of nutritious diets at retail prices: Evidence from 177 countries

Affiliations

Cost and affordability of nutritious diets at retail prices: Evidence from 177 countries

Yan Bai et al. Food Policy. 2021 Feb.

Abstract

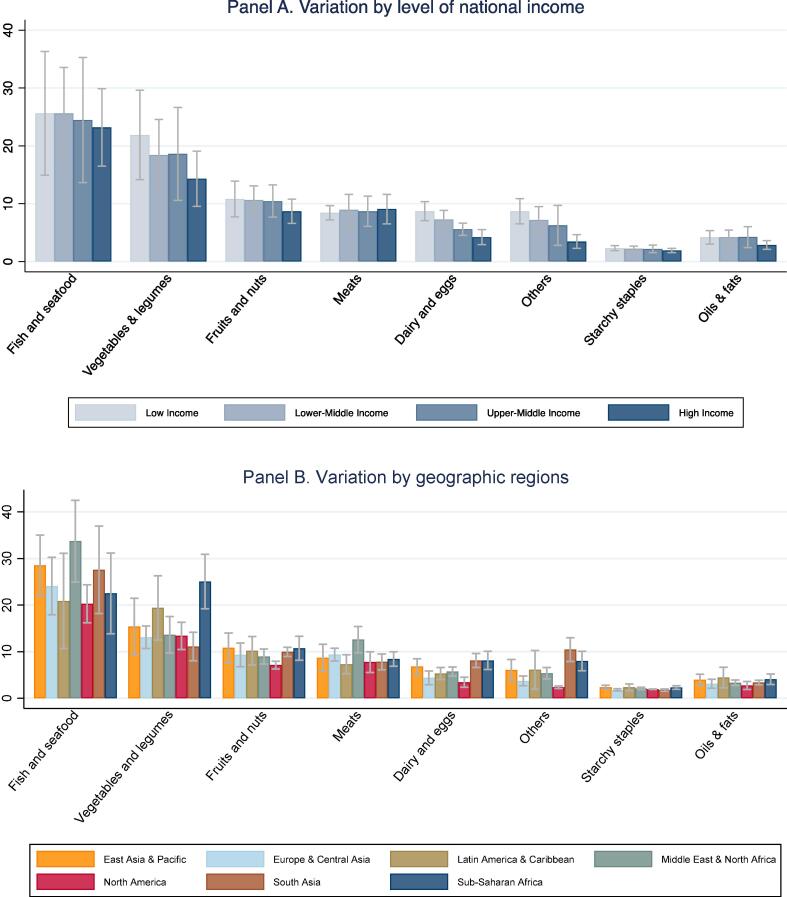
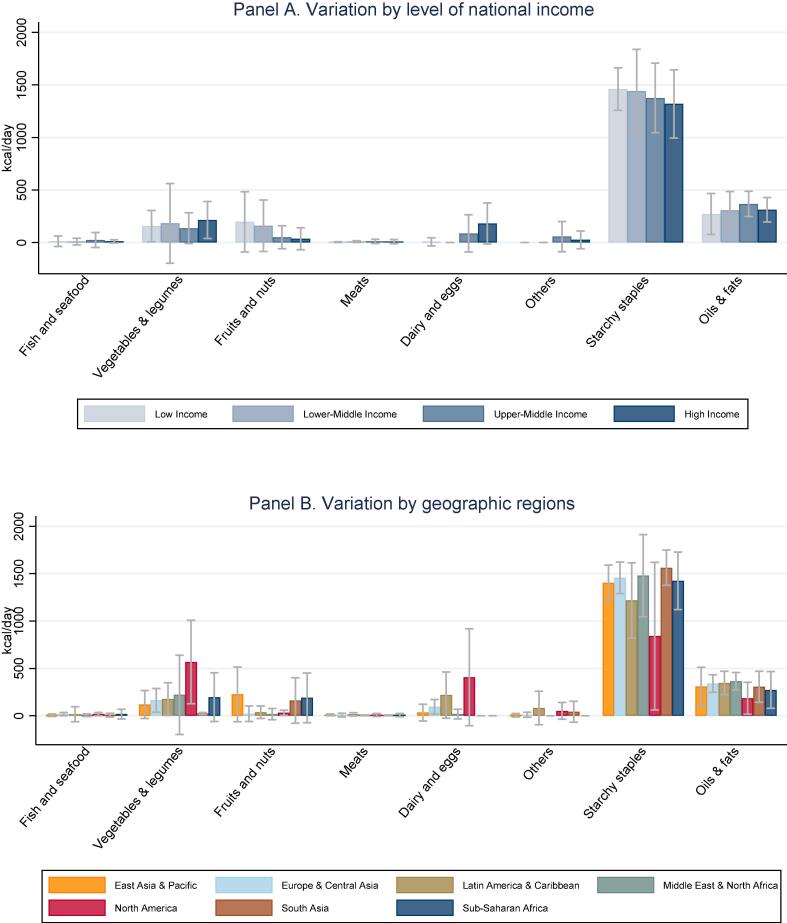
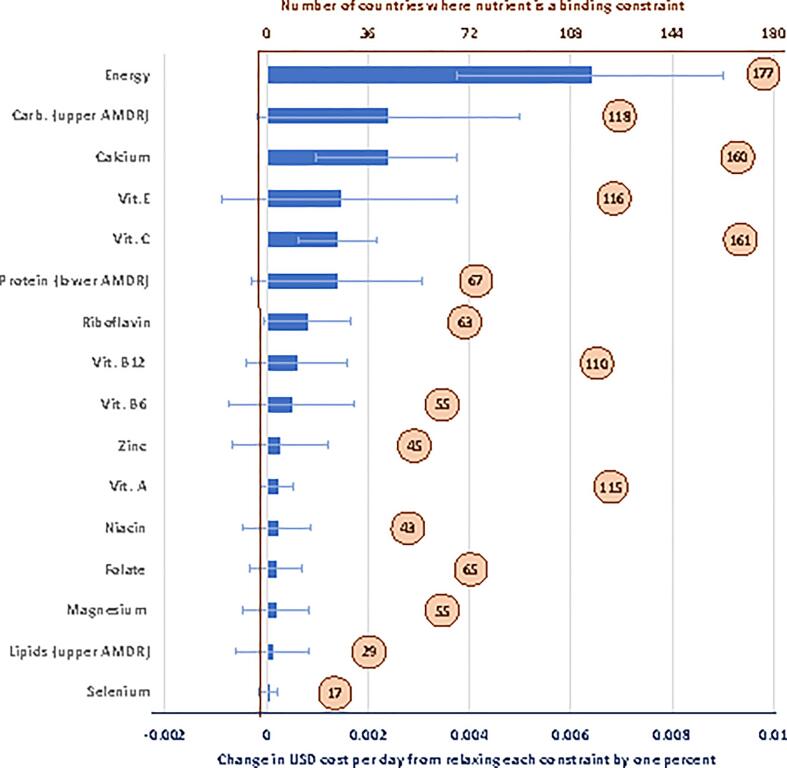
Many policies and programs aim to bring nutritious diets within reach of the poor. This paper uses retail prices and nutrient composition for 671 foods and beverages to compute the daily cost of essential nutrients required for an active and healthy life in 177 countries around the world. We compare this minimum cost of nutrient adequacy with the subsistence cost of dietary energy and per-capita spending on all goods and services, to identify stylized facts about how diet cost and affordability relate to economic development and nutrition outcomes. On average, the most affordable nutrient adequate diet exceeds the cost of adequate energy by a factor of 2.66, costing US$1.35 per day to meet median requirements of healthy adult women in 2011. Affordability is lowest in Sub-Saharan Africa. The sensitivity of diet costs to each requirement reveals the high cost of staying within acceptable macronutrient ranges, particularly the upper limit for carbohydrates. Among micronutrients, total diet costs are most sensitive to requirements for calcium as well as vitamins A, C, E, B12, folate and riboflavin. On average, about 5% of dietary energy in the least-cost nutrient adequate diets is derived from animal source foods, with small quantities of meat and fish. Over 70% of all animal products in least-cost diets is eggs and dairy, but only in upper-middle and high-income countries. In lower income countries where egg and dairy prices are significantly higher, they are replaced by larger volumes of vegetal foods. When controlling for national income, diet costs are most significantly correlated with rural travel times and rural electrification. These data suggest opportunities for targeted policies and programs that reduce market prices and the cost of nutritious diets, while improving affordability through nutrition assistance, safety nets and higher earnings among low-income households.

Keywords: Cost of subsistence; Diet costs; Food prices; Nutrient adequacy; Poverty.


Figures

None
Graphical abstract
Fig. 1
Fig. 1
Food prices for all available items, by category (2011 USD per 1,000 kcal). Note: Data shown are means and standard deviations across countries in each income group or region, for the national average prices of all items in each category available in that country. Number of observations shown is 28,273 prices for 671 items in 173 countries and territories. The number of countries in each group are listed in Table 1. Income categories are from the World Bank, geographic regions are as defined by the UN statistical agencies for the ICP. Food categories are defined using the UN Classification of Individual Consumption According to Purpose (COICOP), and prices are reported in US dollars per 1000 kcal of edible matter, converted from local currencies at purchasing power exchange rates for all household expenditure. Starchy staples include all cereals and white root vegetables, and the “Others” category includes sweets and caloric beverages.
Fig. 2
Fig. 2
Cost per day for nutritious diets and daily energy by level of national income. Note: Data shown are each country’s diet cost per day, with a LOESS regression for the estimated mean at each level of GNI per capita, computed for a representative woman of reproductive age as described in the text. Total number of countries and territories shown is 160, accounting for 99.75% of the global population. Omissions are due to missing GNI data for 8 places (Anguilla, Bonaire, Cuba, Djibouti, Montserrat, Taiwan, Turks & Caicos, and the British Virgin Islands, totaling 35 m. people), and for visual clarity we also omit the 9 territories with reported GNI per capita above 60,000 (Qatar, Macao, Kuwait, Brunei, Singapore, Bermuda, Luxembourg, Norway and the Cayman Islands, totaling 17 m. people).
Fig. 3
Fig. 3
Premium in cost of nutrient adequacy over caloric adequacy (CoNA/CoCA ratio). Note: Data shown are the ratio between cost of nutrient adequacy (CoNA) and the cost of caloric adequacy (CoCA), for 160 countries in 2011 as detailed in the note to Fig. 2 and the text.
Fig. 4
Fig. 4
Cost of nutrient adequacy as a fraction of mean household expenditure. Note: Data shown are ratios of CoNA per day to total household expenditure per capita per day on all goods and services, for 160 countries in 2011 as detailed in the note to Fig. 2 and the text.
Fig. 5
Fig. 5
Food quantities selected for least-cost nutrient adequate diets (kcal/day). Note: Data shown are means and standard deviations across countries in each income group or region, for the sum of all items in each food group shown. Item selection is based on price data shown in Fig. 1.
Fig. 6
Fig. 6
Food prices for items included in least cost diets (2011 USD per 1,000 kcal). Note: Data shown are means and standard deviations for the weighted average cost per calorie of all foods in each category that are selected for least-cost diets in each country, in each region. Items selected are a subset of those shown in Fig. 1.
Fig. 7
Fig. 7
Sensitivity of diet costs to changes in nutrient requirements. Note: Data shown are the number of countries where each nutrient constraint is binding (in circles), and the population-weighted global mean for the cost per day of a one percentage point change in that requirement (bars, with range of standard deviation). Values are shown for nutrients that are binding in ten or more of the 177 countries, all of which are lower-bound AERs except for energy and the AMDRs.
Fig. 8
Fig. 8
Calorie shares of major food groups as observed in national Food Balance Sheets (dark color, red in online versions) and in each country’s most affordable nutrient adequate diet (light color, blue in online versions). Lines show means at each income level with their 95% confidence from a local polynomial regression, dots show individual countries (n = 151).
Fig. 9
Fig. 9
Models of price formation influencing the cost of a nutritious diet. Source: Authors’ illustration of hypothesized mechanisms affecting consumer prices (Pretail), based on differences in agricultural policy and food systems across countries and types of food.

References

    1. Afshin A. Health effects of dietary risks in 195 countries, 1990–2017: a systematic analysis for the Global Burden of Disease Study 2017. The Lancet. 2019;393(10184):1958–1972. - PMC - PubMed
    1. Akter S. The impact of COVID-19 related ‘stay-at-home’ restrictions on food prices in Europe: Findings from a preliminary analysis. Food Security (July) 2020 - PMC - PubMed
    1. Allen R.C. Absolute poverty: When necessity displaces desire. Am. Econ. Rev. 2017;107(12):3690–3721.
    1. Bai Y. Tufts University, Friedman School of Nutrition Science and Policy; Boston, MA: 2020. Quantifying the cost of nutritious diets and dietary impacts on health: Economic approaches to global food systems and nutrition transition. PhD dissertation.
    1. Bai, Y., Naumova, E., Masters, W.A., 2020. Seasonality of diet cost reveals agroecosystem performance in East Africa. Sci. Adv. (in press). - PMC - PubMed

LinkOut - more resources