. 2021 Feb 8;17(3):834-847.
doi: 10.7150/ijbs.57099. eCollection 2021.

Anterior gradient 2 increases long-chain fatty acid uptake via stabilizing FABP1 and facilitates lipid accumulation

Affiliations

Anterior gradient 2 increases long-chain fatty acid uptake via stabilizing FABP1 and facilitates lipid accumulation

Yunqiu Wang et al. Int J Biol Sci. .

Abstract

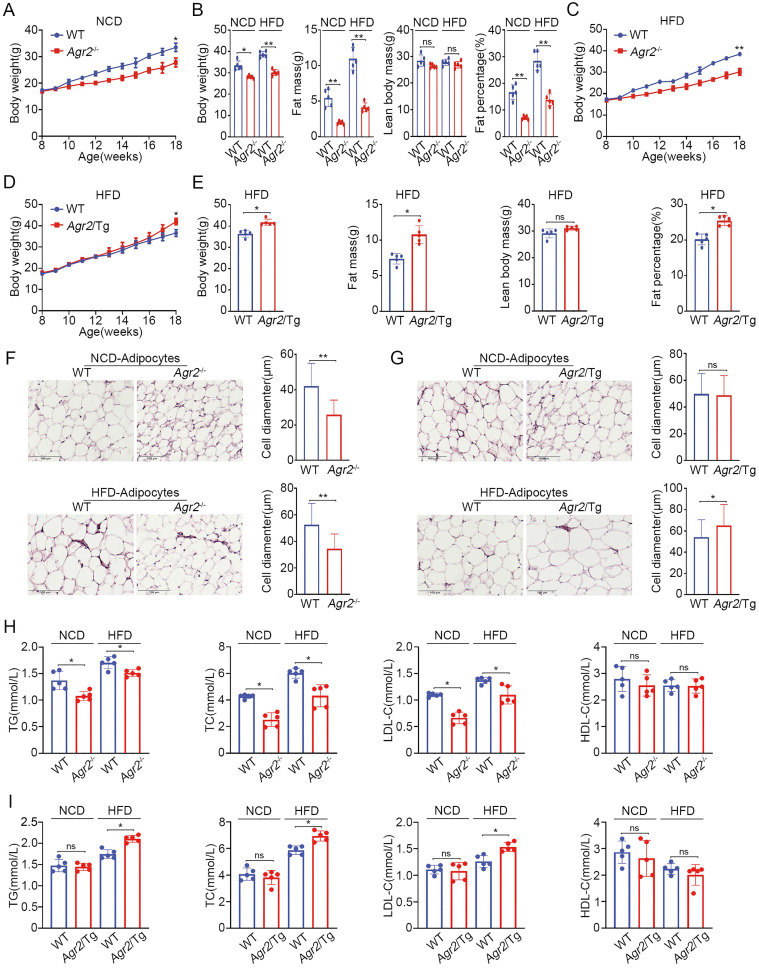
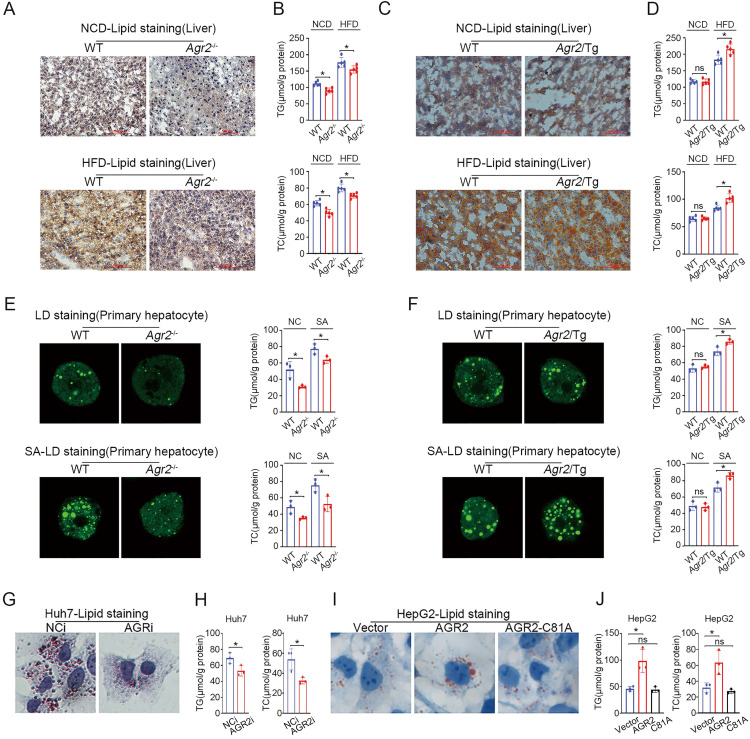
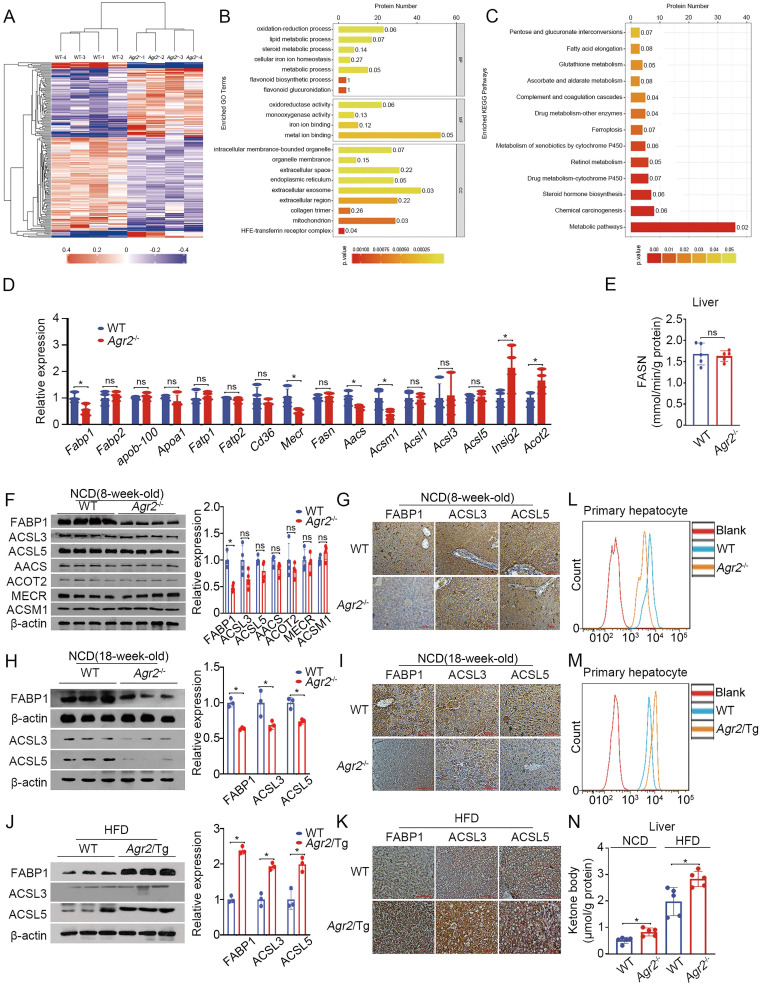
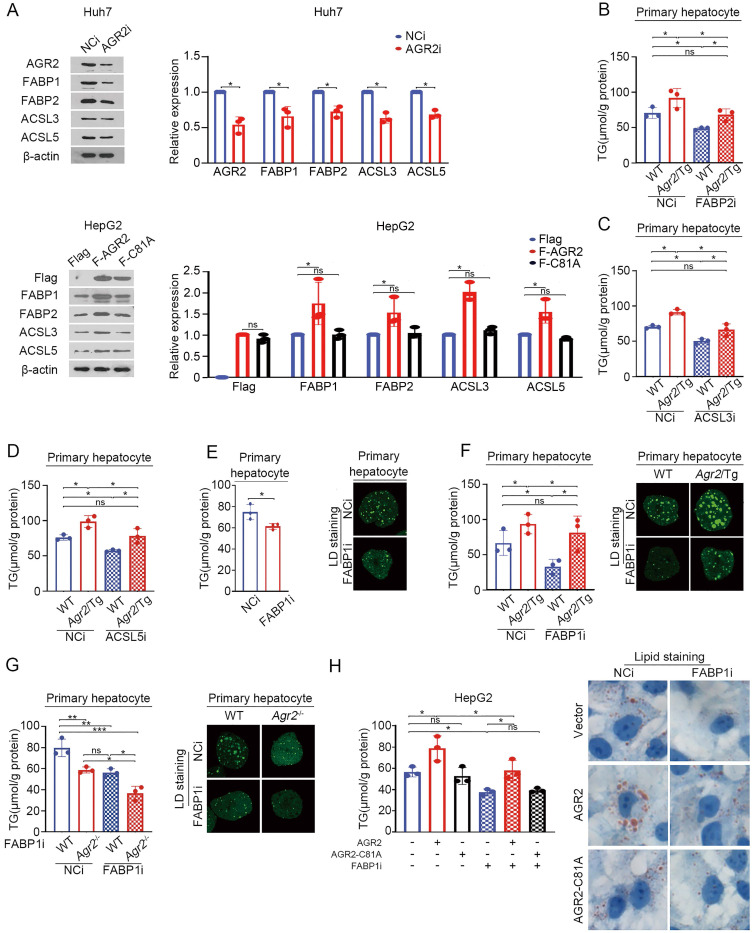
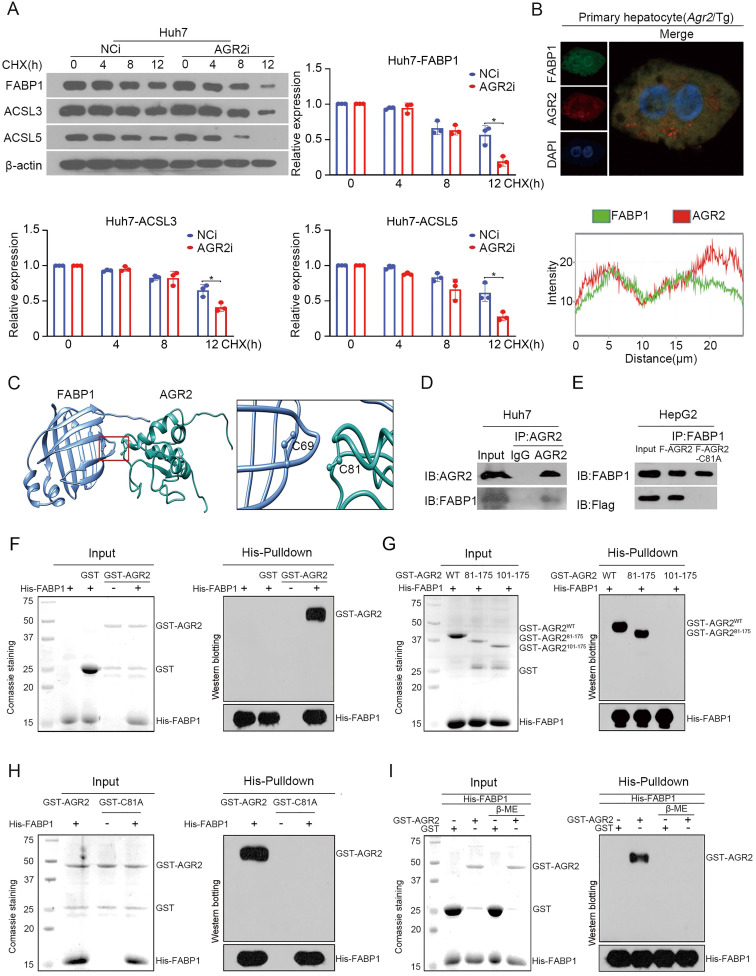
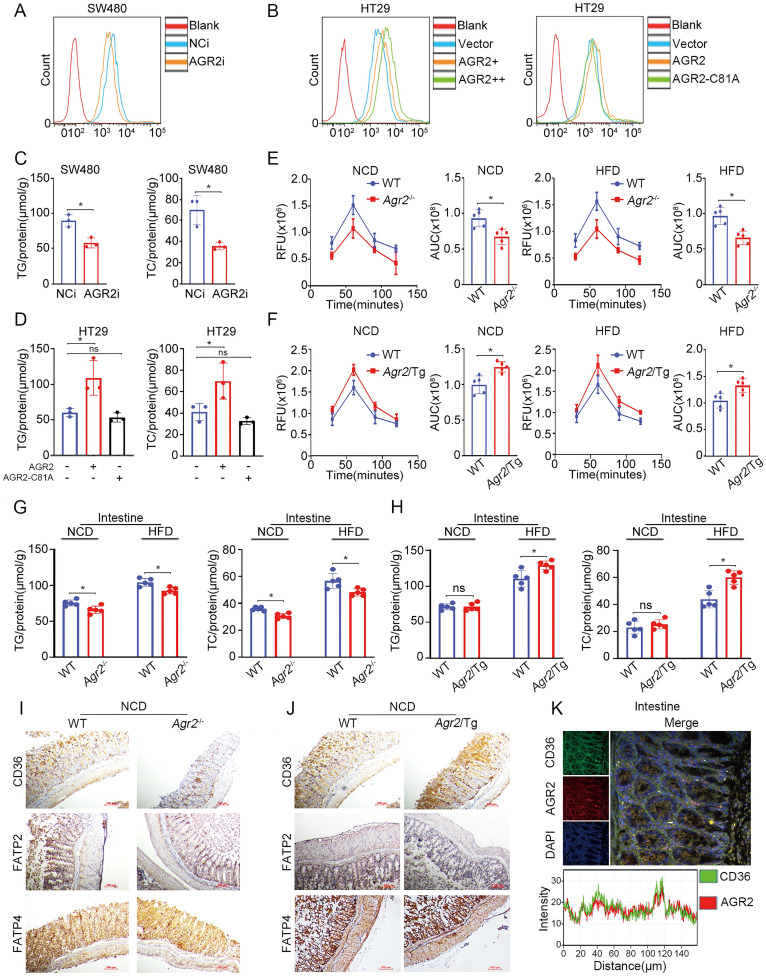
Anterior gradient 2 (AGR2), a protein disulfide isomerase (PDI), is a well-established oncogene. Here, we found that Agr2-/- mice had a decreased fat mass and hepatic and serum lipid levels compared with their wild-type littermates after fasting, and exhibited reduced high-fat diet (HFD)-induced fat accumulation. Transgenic mice overexpressing AGR2 (Agr2/Tg) readily gained fat weight on a HFD but not a normal diet. Proteomic analysis of hepatic samples from Agr2-/- mice revealed that depletion of AGR2 impaired long-chain fatty acid uptake and activation but did not affect de novo hepatic lipogenesis. Further investigations led to the identification of several effector substrates, particularly fatty acid binding protein-1 (FABP1) as essential for the AGR2-mediated effects. AGR2 was coexpressed with FABP1, and knockdown of AGR2 resulted in a reduction in FABP1 stability. Physical interactions of AGR2 and FABP1 depended on the PDI motif in AGR2 and the formation of a disulfide bond between these two proteins. Overexpression of AGR2 but not a mutant AGR2 protein lacking PDI activity suppressed lipid accumulation in cells lacking FABP1. Moreover, AGR2 deficiency significantly reduced fatty acid absorption in the intestine, which might be resulted from decreased fatty acid transporter CD36 in mice. These findings demonstrated a novel role of AGR2 in fatty-acid uptake and activation in both the liver and intestine, which contributed to the AGR2-mediated lipid accumulation, suggesting that AGR2 is an important regulator of whole-body lipid metabolism and down-regulation of AGR2 may antagonize the development of obesity.

Keywords: AGR2; FABP1; chaperone; intestine; lipid metabolism; liver.


Conflict of interest statement

Competing Interests: The authors have declared that no competing interest exists.

Figures

Figure 1
Figure 1
AGR2 knockout reduces serum lipid levels and fat accumulation. The 8-week-old mice were fed a NCD or a HFD for an additional 10 weeks. A. Body weight of WT and Agr2-/- mice during the 10 weeks of NCD feeding (n=5). B. Body weight, fat mass, lean body mass and fat percentage of WT and Agr2-/- mice fed a NCD or a HFD (n=5). C. Body weight of WT and Agr2-/- mice during the 10 weeks of HFD feeding (n=5). D. Body weight of WT and Agr2/Tg mice during the 10 weeks of HFD feeding (n=5). E. Body weight, fat mass, lean body mass and fat percentage of WT and Agr2/Tg mice fed a HFD (n=5). F. Adipose tissue staining and the diameter of adipocytes in WT and Agr2-/- mice fed a NCD (top) or a HFD (bottom). G. Adipose tissue staining and the diameter of adipocytes in WT and Agr2/Tg mice fed NCD (top) or a HFD (bottom). H. Circulating lipid profiles of WT and Agr2-/- mice fed a NCD or a HFD (n=5). I. Circulating lipid profiles of WT and Agr2/Tg mice fed a NCD or a HFD (n=5). Representative figures were generated with data from at least three independent experiments. The data are presented as the mean ± SD values. *P < 0.05, **P < 0.01 by Student's t test.
Figure 2
Figure 2
AGR2 promotes hepatic lipid synthesis. The 8-week-old mice were fed a NCD or a HFD for an additional 10 weeks. A. Lipid staining in liver tissue from WT and Agr2-/- mice fed a NCD (top) or a HFD (bottom). B. TG (top) and TC (bottom) contents in the livers of WT and Agr2-/- mice fed a NCD or a HFD (n=5). C. Lipid staining in liver tissue from WT and Agr2/Tg mice fed a NCD (top) or a HFD (bottom). D. TG (top) and TC (bottom) contents in the livers of WT and Agr2/Tg mice fed a NCD or a HFD (n=5). E. Lipid droplet staining (left) and TG and TC contents (right) in primary hepatocytes in WT and Agr2-/- mice under normal conditions or under exposure to stearic acid. F. Lipid droplet staining (left) and TG and TC (right) in primary hepatocytes in WT and Agr2/Tg mice under normal conditions or under exposure to stearic acid. G. Lipid staining in Huh7 cells treated with siRNA targeting AGR2. H. TG and TC contents in Huh7 cells treated with siRNA targeting AGR2. I. Lipid staining in HepG2 cells treated with AGR2 and AGR2-C81A expression plasmids. J. TG and TC contents in HepG2 cells treated with AGR2 and AGR2-C81A expression plasmids. Representative figures were generated with data from at least three independent experiments. The data are presented as the mean ± SD values. *P < 0.05 by Student's t test.
Figure 3
Figure 3
AGR2 affects fatty acid uptake and utilization. A. Hierarchical clustering heatmaps of differentially expressed proteins between the livers of WT and Agr2-/- mice. B. Results of GO term analysis of differentially expressed proteins between the livers of WT and Agr2-/- mice. C. Statistical results of analysis of the KEGG pathways associated with the differentially expressed proteins between the livers of WT and Agr2-/- mice. D. Lipid metabolism gene expression in the livers of the 8-week-old WT and Agr2-/- mice fed a NCD (n=3). E. Analysis of FASN activity in the cytoplasm in the livers of the 8-week-old WT and Agr2-/- mice fed a NCD (n=5). F. Western blot analysis of lipid metabolism protein levels in the livers of the 8-week-old WT and Agr2-/- mice fed a NCD. Quantification was performed by normalizing proteins to β-actin. G. Immunohistochemical staining of FABP1, ACSL3 and ACSL5 in the livers of the 8-week-old WT and Agr2-/- mice fed a NCD. H. Western blot analysis of FABP1, ACSL3 and ACSL5 in the livers of the 18-week-old WT and Agr2-/- mice fed a NCD. Quantification was performed by normalizing proteins to β-actin. I. Immunohistochemical staining of FABP1, ACSL3 and ACSL5 in the livers of the 18-week-old WT and Agr2-/- mice fed a NCD. J. Western blot analysis of FABP1, ACSL3 and ACSL5 in the livers of 8-week-old WT and Agr2/Tg mice fed a HFD for an additional 10 weeks. Quantification was performed by normalizing proteins to β-actin. K. Immunohistochemical staining of FABP1, ACSL3 and ACSL5 in the livers of the 8-week-old WT and Agr2/Tg mice fed a HFD for an additional 10 weeks. L. Flow cytometric analysis of lipid absorption in primary hepatocytes from WT and Agr2-/- mice. M. Flow cytometric analysis of lipid absorption in primary hepatocytes from WT and Agr2/Tg mice. N. Analysis of the ketone body content in the cytoplasm in the livers of 8-week-old WT and Agr2-/- mice fed a NCD or a HFD for an additional 10 weeks (n=5). Representative figures were generated with data from at least three independent experiments. The data are presented as the mean ± SD values. *P < 0.05 by Student's t test.
Figure 4
Figure 4
AGR2-mediated effect on fatty acid metabolism depends on FABP1. A. Western blot analysis of lipid metabolism protein levels in whole-cell lysates from Huh7 cells treated with siRNA targeting AGR2. Western blot analysis of lipid metabolism protein levels in whole-cell lysates from HepG2 cells treated with AGR2 and AGR2-C81A expression plasmids. Quantification was performed by normalizing proteins to β-actin. B. TG in primary hepatocytes from WT and Agr2/Tg mice treated with siRNA targeting FABP2. C. TG in primary hepatocytes from WT and Agr2/Tg mice treated with siRNA targeting ACSL3. D. TG in primary hepatocytes from WT and Agr2/Tg mice treated with siRNA targeting ACSL5. E. TG and lipid droplet staining in primary hepatocytes from WT mice treated with siRNA targeting FABP1. F. TG and lipid droplet staining in primary hepatocytes from WT and Agr2/Tg mice treated with siRNA targeting FABP1. G. TG and lipid droplet staining in primary hepatocytes from WT and Agr2-/- mice treated with siRNA targeting FABP1. H. TG content in HepG2 cells treated with AGR2 and AGR2-C81A expression plasmids and siRNA targeting FABP1. Lipid staining in HepG2 cells treated with AGR2 and AGR2-C81A expression plasmids and siRNA targeting FABP1. Representative figures were generated with data from at least three independent experiments. The data are presented as the mean ± SD values. *P < 0.05, **P < 0.01, ***P < 0.001 by Student's t test.
Figure 5
Figure 5
AGR2 acts as a stabilizer for FABP1. A. Huh7 cells were treated with 10 µM CHX for 0, 4, 8 and 12 h. FABP1, ACSL3 and ACSL5 were detected by western blotting. Quantification was performed by normalizing proteins to β-actin. B. Immunofluorescence staining of FABP1 and AGR2 in primary hepatocytes from Agr2/Tg mice. C. In silico prediction of interactions between AGR2 and FABP1. Green, AGR2; blue, FABP1. D. Co-immunoprecipitation analysis of the interaction between AGR2 and FABP1 using Huh7 cell lysates. E. Co-immunoprecipitation analysis of the interaction between AGR2 and FABP1 using cell lysates in HepG2 cells treated with AGR2 and AGR2-C81A expression plasmids. F. His pulldown analysis of the interaction between AGR2 and FABP1. G. His pulldown assays show that the mutation of thioredoxin motif blocks the AGR2-FABP1 interaction. H. His pulldown assays showing the direct interaction of AGR2 and its deletion mutants with FABP1. I. His pulldown assays show that β-ME blocks the AGR2-FABP1 interaction. Representative figures were generated with data from at least three independent experiments. The data are presented as the mean ± SD values. *P < 0.05 by Student's t test.
Figure 6
Figure 6
AGR2 influences FA absorption in the intestine. The 8-week-old mice were fed a NCD or a HFD for an additional 10 weeks. A. Flow cytometric analysis of lipid absorption in SW480 cells treated with siRNA targeting AGR2. B. Flow cytometric analysis of lipid absorption in HT29 cells treated with AGR2 and AGR2-C81A expression plasmids. C. TG and TC contents in SW480 cells treated with siRNA targeting AGR2. D. TG and TC contents in HT29 cells treated with AGR2 and AGR2-C81A expression plasmids. E. Lipid absorption in WT and Agr2-/- mice fed a NCD or a HFD (n=5). F. Lipid absorption in WT and Agr2/Tg mice fed a NCD or a HFD (n=5). G. TG and TC contents in the intestines of WT and Agr2-/- mice fed a NCD or a HFD (n=5). H. TG and TC contents in the intestines of WT and Agr2/Tg mice fed a NCD or a HFD (n=5). I. Immunohistochemical staining of FA uptake proteins in the intestines of WT and Agr2-/- mice fed a NCD. J. Immunohistochemical staining of FA uptake proteins in the intestines of WT and Agr2/Tg mice fed a NCD. K. Immunofluorescence staining of CD36 and AGR2 in the intestines. Representative figures were generated with data from at least three independent experiments. The data are presented as the mean ± SD values. *P < 0.05 by Student's t test.

Similar articles

Cited by

References

    1. Zhai X, Sterea AM, Hiani YE. Lessons from the Endoplasmic Reticulum Ca(2+) Transporters-A Cancer Connection. Cells. 2020. 9. - PMC - PubMed
    1. Jaud M, Philippe C, Di Bella D, Tang W, Pyronnet S, Laurell H, Translational Regulations in Response to Endoplasmic Reticulum Stress in Cancers. Cells. 2020. 9. - PMC - PubMed
    1. Kropski JA, Blackwell TS. Endoplasmic reticulum stress in the pathogenesis of fibrotic disease. The Journal of clinical investigation. 2018;128:64–73. - PMC - PubMed
    1. Pagliassotti MJ, Kim PY, Estrada AL, Stewart CM, Gentile CL. Endoplasmic reticulum stress in obesity and obesity-related disorders: An expanded view. Metabolism: clinical and experimental. 2016;65:1238–46. - PMC - PubMed
    1. Yang L, Zhao D, Ren J, Yang J. Endoplasmic reticulum stress and protein quality control in diabetic cardiomyopathy. Biochimica et biophysica acta. 2015;1852:209–18. - PubMed

Publication types