

Quantitative Assessment of the Impact of Geometric Distortions and Their Correction on fMRI Data Analyses
- PMID: 33767610
- PMCID: PMC7985341
- DOI: 10.3389/fnins.2021.642808
Quantitative Assessment of the Impact of Geometric Distortions and Their Correction on fMRI Data Analyses
Abstract
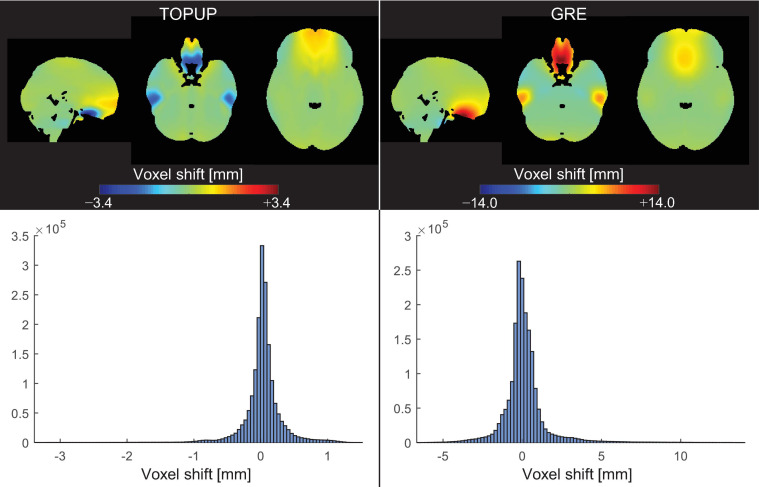
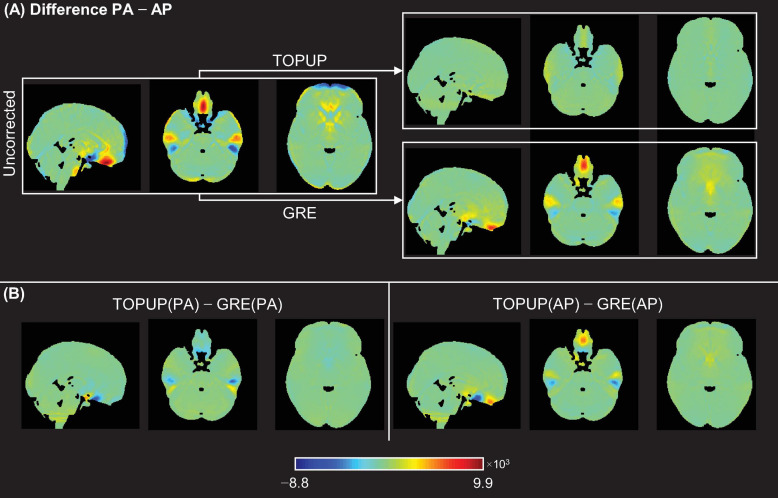
Functional magnetic resonance imaging (fMRI) data is typically collected with gradient-echo echo-planar imaging (GE-EPI) sequences, which are particularly prone to the susceptibility artifact as a result of B0 field inhomogeneity. The component derived from in-plane spin dephasing induces pixel intensity variations and, more critically, geometric distortions. Despite the physical mechanisms underlying the susceptibility artifact being well established, a systematic investigation on the impact of the associated geometric distortions, and the direct comparison of different approaches to tackle them, on fMRI data analyses is missing. Here, we compared two different distortion correction approaches, by acquiring additional: (1) EPI data with reversed phase encoding direction (TOPUP), and (2) standard (and undistorted) GE data at two different echo times (GRE). We first characterized the geometric distortions and the correction approaches based on the estimated ΔB0 field offset and voxel shift maps, and then conducted three types of analyses on the distorted and corrected fMRI data: (1) registration into structural data, (2) identification of resting-state networks (RSNs), and (3) mapping of task-related brain regions of interest. GRE estimated the largest voxel shifts and more positively impacted the quality of the analyses, in terms of the (significantly lower) cost function of the registration, the (higher) spatial overlap between the RSNs and appropriate templates, and the (significantly higher) sensitivity of the task-related mapping based on the Z-score values of the associated activation maps, although also evident when considering TOPUP. fMRI data should thus be corrected for geometric distortions, with the choice of the approach having a modest, albeit positive, impact on the fMRI analyses.
Keywords: B0 field mapping; fMRI; geometric distortions and correction; neuroimaging; susceptibility artifact.
Copyright © 2021 Abreu and Duarte.
Conflict of interest statement
The authors declare that the research was conducted in the absence of any commercial or financial relationships that could be construed as a potential conflict of interest.
Figures


Similar articles
-
Framewise multi-echo distortion correction for superior functional MRI.bioRxiv [Preprint]. 2023 Nov 29:2023.11.28.568744. doi: 10.1101/2023.11.28.568744. bioRxiv. 2023. PMID: 38077010 Free PMC article. Preprint.
-
Estimation of geometrically undistorted B(0) inhomogeneity maps.Phys Med Biol. 2014 Sep 7;59(17):4945-59. doi: 10.1088/0031-9155/59/17/4945. Epub 2014 Aug 11. Phys Med Biol. 2014. PMID: 25109506 Free PMC article.
-
Assessing methods for geometric distortion compensation in 7 T gradient echo functional MRI data.Hum Brain Mapp. 2021 Sep;42(13):4205-4223. doi: 10.1002/hbm.25540. Epub 2021 Jun 22. Hum Brain Mapp. 2021. PMID: 34156132 Free PMC article.
-
Quantitative Evaluations of Geometrical Distortion Corrections in Cortical Surface-Based Analysis of High-Resolution Functional MRI Data at 7T.J Magn Reson Imaging. 2021 Apr;53(4):1220-1234. doi: 10.1002/jmri.27420. Epub 2020 Nov 5. J Magn Reson Imaging. 2021. PMID: 33151028 Free PMC article.
-
Correction of geometric distortion in fMRI data.Neuroimage. 2012 Aug 15;62(2):648-51. doi: 10.1016/j.neuroimage.2011.09.010. Epub 2011 Sep 16. Neuroimage. 2012. PMID: 21945795 Review.
Cited by
-
Assessing MR-compatibility of somatosensory stimulation devices: A systematic review on testing methodologies.Front Neurosci. 2023 Jan 26;17:1071749. doi: 10.3389/fnins.2023.1071749. eCollection 2023. Front Neurosci. 2023. PMID: 36777636 Free PMC article.
-
Distortion correction of functional MRI without reverse phase encoding scans or field maps.Magn Reson Imaging. 2023 Nov;103:18-27. doi: 10.1016/j.mri.2023.06.016. Epub 2023 Jul 1. Magn Reson Imaging. 2023. PMID: 37400042 Free PMC article.
-
Off-resonance artifact correction for MRI: A review.NMR Biomed. 2023 May;36(5):e4867. doi: 10.1002/nbm.4867. Epub 2022 Dec 14. NMR Biomed. 2023. PMID: 36326709 Free PMC article. Review.
-
Transmit Radiant Individuality to Offspring (TRIO) study: investigating intergenerational transmission effects on brain development.Front Psychiatry. 2023 Sep 28;14:1150973. doi: 10.3389/fpsyt.2023.1150973. eCollection 2023. Front Psychiatry. 2023. PMID: 37840799 Free PMC article.
References
LinkOut - more resources
Full Text Sources
Other Literature Sources