. 2021 Mar 9:12:656979.
doi: 10.3389/fmicb.2021.656979. eCollection 2021.

Optimized Detection of Acute MHV68 Infection With a Reporter System Identifies Large Peritoneal Macrophages as a Dominant Target of Primary Infection

Affiliations

Optimized Detection of Acute MHV68 Infection With a Reporter System Identifies Large Peritoneal Macrophages as a Dominant Target of Primary Infection

Julianne B Riggs et al. Front Microbiol. .

Abstract

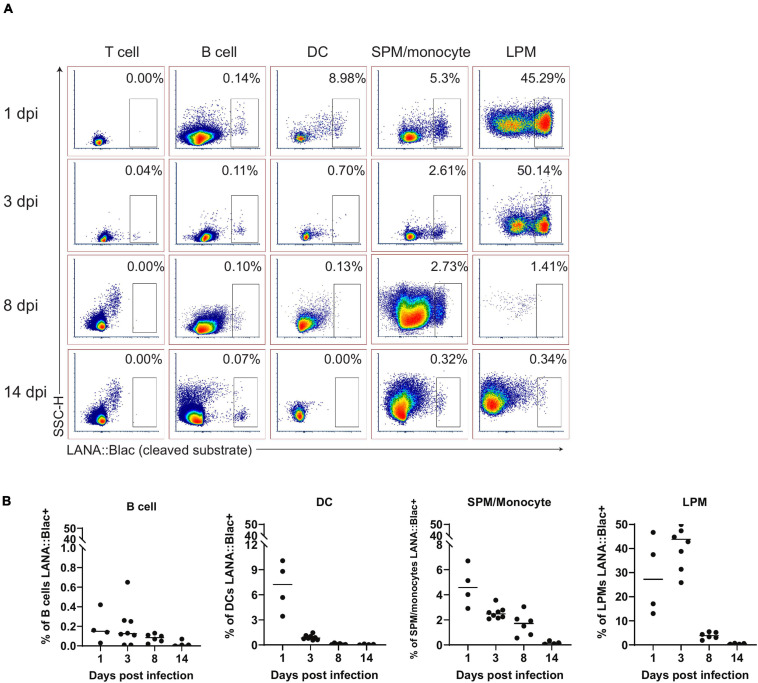
Investigating the dynamics of virus-host interactions in vivo remains an important challenge, often limited by the ability to directly identify virally infected cells. Here, we utilize a beta-lactamase activated fluorescent substrate to identify primary targets of murine gammaherpesvirus 68 (MHV68) infection in the peritoneal cavity. By optimizing substrate and detection conditions, we were able to achieve multiparameter characterization of infected cells and the ensuing host response. MHV68 infection leads to a pronounced increase in immune cells, with CD8+ T cells increasing by 3 days, and total infiltrate peaking around 8 days post-infection. MHV68 infection results in near elimination of large peritoneal macrophages (LPMs) by 8 days post-infection, and a concordant increase in small peritoneal macrophages (SPMs) and monocytes. Infection is associated with prolonged changes to myeloid cells, with a distinct population of MHC IIhigh LPMs emerging by 14 days. Targets of MHV68 infection could be readily detected. Between 1 and 3 days post-infection, MHV68 infects ∼5-10% of peritoneal cells, with >75% being LPMs. By 8 days post-infection, the frequency of MHV68 infection is reduced at least 10-fold, with infection primarily in SPMs, with few infected dendritic cells and B cells. Importantly, limiting dilution analysis indicates that at 3 days post-infection, the majority of MHV68-infected cells harbor latent rather than lytic virus at frequencies consistent with those identified based on reporter gene expression. Our findings demonstrate the utility of the beta-lactamase MHV68 reporter system for high throughput single-cell analysis and identify dynamic changes during primary gammaherpesvirus infection.

Keywords: gammaherpesvirus; latency; macrophages; multiparameter flow cytometry; peritoneal cavity; reporter virus.


Conflict of interest statement

DB was employed by company Cytek Biosciences. The remaining authors declare that the research was conducted in the absence of any commercial or financial relationships that could be construed as a potential conflict of interest.

Figures

FIGURE 1
FIGURE 1
Optimization of MHV68.LANA:βlac detection and CCF2-AM cleavage by full spectrum flow cytometry. (A) Graphic depicting CCF2-AM entrance, processing and fluorescence in cells in the absence (left) or presence (right) of mLANA:βlac. “A” represents the coumarin component of CCF2, while “B” represents fluorescein. (B) CCF2-AM titration and detection in 3T12 mouse fibroblasts, infected with either MHV68 (i.e., no CCF2-AM cleavage) or MHV68.LANA:βlac (i.e., CCF2-AM cleavage) and incubated with the indicated concentration of CCF2-AM at 20 h post-infection. Shown are full emission spectra from stained cells. Each row depicts fluorescence intensity under different experimental conditions (MHV68 or MHV68.LANA:βlac infection), varying CCF2-AM concentration and incubation time, and gain for Violet and Blue detectors of a Cytek Aurora spectral analyzer. Top row: unstained fibroblasts. Middle rows: fibroblasts subjected to manufacturer’s recommended conditions for CCF2-AM staining. Bottom rows: fibroblasts subjected to optimized, titrated CCF2-AM staining. Each row depicts from left to right: fluorescent spectral intensity across 48 detectors, with fluorescence emission in the V3 and V7 detectors highlighted by dot plot and histogram. CCF2-AM associated fluorescence for the uncleaved substrate is detected in V7, with cleaved substrate detected in V3. (C) Dot plots showing optimized staining conditions in infected mouse peritoneal cells (PerCs) in vitro. PerCs were extracted and infected overnight in vitro with MHV68 or MHV68.LANA:βlac. Twenty hours later, cells were stained with CCF2-AM as well for viability and surface markers. Histograms are shown to demonstrate how populations were defined. (D) Dot plots showing optimized staining conditions on infected PerCs in vivo. Mice were infected i.p. with 1 million PFUs of MHV68 or MHV68.LANA:βlac. Three days after infection, mice were sacrificed and PerCs were harvested and stained with CCF2-AM as well as for viability and surface markers. Populations shown were gated on live singlets. Data representative of three experiments, with 2–3 mice per condition per experiment.
FIGURE 2
FIGURE 2
Intraperitoneal MHV68.LANA:βlac infection induces T cell accumulation in the peritoneal cavity. Experimental conditions were performed as outlined in Figure 1D. Mice were harvested at 1, 3, 8, and 14 dpi. (A) Viable cell counts of PerCs as a function of time and infection cohort. Each symbol is representative of one mouse and bars represent the mean value of samples. Asterisks denote significance between Mock and MHV68 (8 dpi), Mock and MHV68.LANA:βlac (8 dpi), and Mock and MHV68.LANA:βlac (14 dpi). (B) Flow cytometry dot plots showing percent of CD4- and CD8a-positive PECs at various time points post infection with MHV68.LANA:βlac. Samples are gated on live, singlets CD19- CD11c- CD11b- F4/80- CD3e+ cells. (C) Quantification of flow cytometry data showing mean percent and number of CD4 and CD8a-positive PECs are various time points post infection. Statistical analysis was performed using student’s t test in GraphPad Prism (p < 0.05, ∗∗p < 0.01, ∗∗∗p < 0.001, ****p < 0.0001). Data representative of three experiments with 2–3 mice per condition per experiment.
FIGURE 3
FIGURE 3
Alterations in peritoneal myeloid subsets after MHV68.LANA:βlac infection. Flow cytometric analysis of myeloid cells and neutrophils in the peritoneal cavity after MHV68.LANA:βlac infection. (A) Flow cytometric analysis of PerCs, showing expression of CD11b and F4/80 on live, singlet, CD19- CD11c- events at the indicated times post infection. Gates identify distinct cell subsets, including large peritoneal macrophage (LPM) and small peritoneal macrophages (SPM). (B) Quantification of flow cytometry data shown in (A) showing mean percent and number of live singlets that are LPMs and SPM/monocytes at various times post infection. (C) Dot plots showing expression of Gr-1 and MHC II on CD19- CD11c- CD11bmid F4/80mid PerCs over time. (D) Histograms comparing expression of MHC II (left) and CD86 (right) in SPMs/monocytes (top) and LPMs (bottom), as a function of time (colored according to legend). Day 8 samples did not have any detectable LPMs (as indicated). (E) Quantification of flow cytometry data shown in (A), demonstrating mean percent and number of neutrophils at time points post infection. Statistical analysis was performed using student’s t-test in GraphPad Prism (p < 0.05, ∗∗p < 0.01, ∗∗∗p < 0.001, ****p < 0.0001). Data representative of three experiments with 2–3 mice per condition per experiment.
FIGURE 4
FIGURE 4
MHV68.LANA:βlac is detectable during acute infection in the peritoneal cavity. Flow cytometric analysis of MHV68.LANA:βlac infection in the peritoneal cavity of MHV68 infected mice. (A) Dot plots showing the frequency of PerCs positive for cleaved CCF2 fluorescence throughout infection, comparing peritoneal cells isolated from mock, MHV68 or MHV68.LANA:βlac infected mice. Populations were gated on live singlets. (B) Quantification of the frequency and number of LANA:βlac+ PerCs defined based on positive cleaved CCF2 fluorescence. Statistical analysis was performed using student’s t test in GraphPad Prism (p < 0.05, ∗∗∗p < 0.001). Data representative of three experiments with 2–3 mice per condition per experiment.
FIGURE 5
FIGURE 5
Predominant detection of MHV68.LANA:βlac infection in macrophages in the peritoneal cavity. Flow cytometric analysis of MHV68.LANA:βlac infection within different leukocyte subsets in the peritoneal cavity of MHV68.LANA:βlac infected mice. (A) Dot plots quantifying the frequency of LANA:βlac+ events (as defined in Figure 4) that are CD19+ B cells (top row), CD11c+ dendritic cells (middle row), or CD11bHigh F4/80High LPMs or CD11bMid, F4/80Mid SPM/monocytes (bottom row). (B) Quantitation of the frequency of LANA:βlac+ (i.e., cleaved CCF2+ cells) that are B cells, DCs, SPM/monocytes, or LPMs at various times post infection. Each dot is representative of one mouse, and lines represent mean of samples. Data representative of three experiments with 2–3 mice per condition per experiment.
FIGURE 6
FIGURE 6
A substantial portion of peritoneal macrophages are positive for MHV68.LANA:βlac infection during acute infection. Flow cytometric analysis of cell subsets that demonstrate MHV68.LANA:βlac infection in the peritoneal cavity of MHV68.LANA:βlac infected mice. (A) Dot plots showing the frequency of T cells, B cells, dendritic cells, SPM/monocytes, and LPM that express cleaved CCF2 fluorescence, the indicator for LANA:βlac expression, at various times post infection. (B) Graphs demonstrating data shown in (A). Each dot is representative of one mouse and lines represent mean of samples. Data representative of three experiments with 2–3 mice per condition per experiment.
FIGURE 7
FIGURE 7
MHV68 infection is associated with altered macrophage expression of MHC II and CD86 in infected and uninfected cells. Flow cytometric analysis of MHC II (top row) and CD86 (bottom row) expression in large (LPM) and small (SPM) peritoneal macrophages, in mock or MHV68.LANA:βlac infected PerCs. Histograms compare the phenotype of virus-infected (LANA:βlac+) and uninfected (LANA:βlac–) cells. Gates define the percent of events positive for each marker. Virus-infected (LANA:βlac+) and uninfected (LANA:βlac–) cells were defined according to the gates drawn in Figure 6A. Data representative of three experiments with 2–3 mice per condition per experiment.
FIGURE 8
FIGURE 8
The MHV68-infected peritoneal cavity contains both lytic and latent infection at 3 days post infection. (A) Flow cytometry analysis of peritoneal cells infected with MHV68.LANA:βlac. Shown is a representative dot plot of PerCs analyzed for cleaved CCF2 fluorescence at 3 dpi, gated on live singlets. Average frequency and standard error of the mean (upper left) were calculated from three experiments with 2–3 mice per condition per experiment. (B) Analysis of virus infection in peritoneal cells obtained from mock, MHV68 or MHV68.LANA:βlac infected mice. PerCs were harvested at 3 dpi and subjected to limiting dilution analysis on mouse embryonic fibroblasts, with virus production quantified by cytopathic effect (CPE) 21 days post-plating. Analysis quantifies the mean frequency of wells which were positive for virus in intact and mechanically disrupted samples. 24–36 wells per dilution per condition were analyzed for undisrupted samples, and 12 wells per dilution per condition for disrupted samples. Dashed line at 63.2% is used to determine the frequency of virus-positive cells, defined by Poisson distribution. Analysis performed via non-linear regression analysis in GraphPad Prism. Data representative of three experiments with two mice per condition per experiment.

Similar articles

Cited by

References

    1. Bain C. C., Hawley C. A., Garner H., Scott C. L., Schridde A., Steers N. J., et al. (2016). Long-lived self-renewing bone marrow-derived macrophages displace embryo-derived cells to inhabit adult serous cavities. Nat. Commun. 7:ncomms11852. 10.1038/ncomms11852 - DOI - PMC - PubMed
    1. Barton E., Mandal P., Speck S. H. (2011). Pathogenesis and host control of gammaherpesviruses: lessons from the mouse. Annu. Rev. Immunol. 29 351–397. 10.1146/annurev-immunol-072710-081639 - DOI - PubMed
    1. Barton E. S., White D. W., Cathelyn J. S., Brett-McClellan K. A., Engle M., Diamond M. S., et al. (2007). Herpesvirus latency confers symbiotic protection from bacterial infection. Nature 447 326–329. 10.1038/nature05762 - DOI - PubMed
    1. Baumgarth N. (2017). A Hard(y) Look at B-1 Cell Development and Function. J. Immunol. 199 3387–3394. 10.4049/jimmunol.1700943 - DOI - PMC - PubMed
    1. Berger J. N., Sanford B., Kimball A. K., Oko L. M., Kaspar R. E., Niemeyer B. F., et al. (2020). Redefining de novo gammaherpesvirus infection through high-dimensional, single-cell analysis of virus and host. bioRxiv [Preprint]. 10.1101/2020.08.11.203117 - DOI