. 2021 Mar 9:12:627020.
doi: 10.3389/fimmu.2021.627020. eCollection 2021.

A Detailed Analysis of Parameters Supporting the Engraftment and Growth of Chronic Lymphocytic Leukemia Cells in Immune-Deficient Mice

Affiliations

A Detailed Analysis of Parameters Supporting the Engraftment and Growth of Chronic Lymphocytic Leukemia Cells in Immune-Deficient Mice

Piers E M Patten et al. Front Immunol. .

Abstract

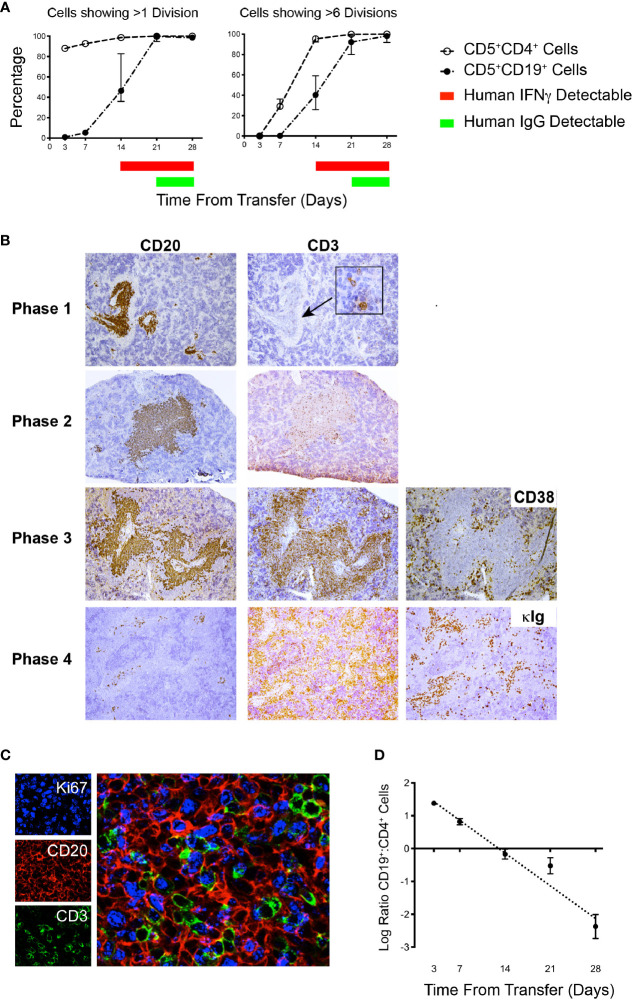
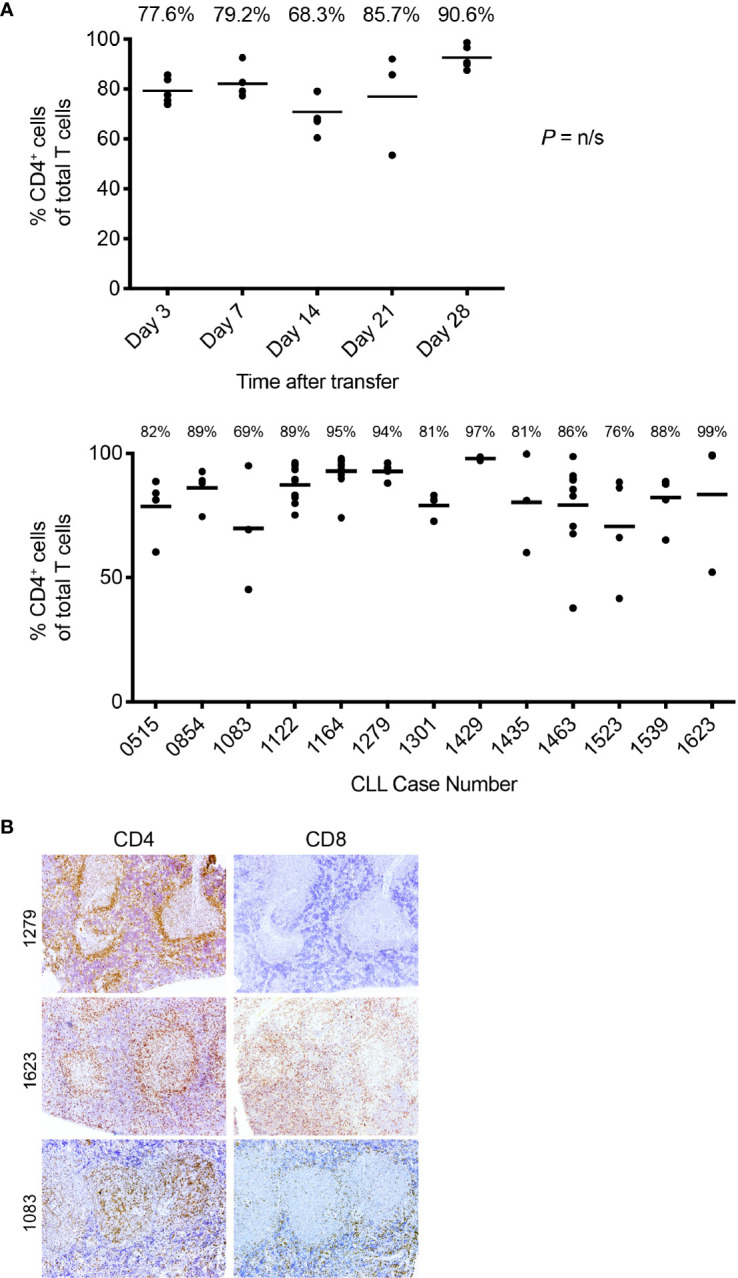
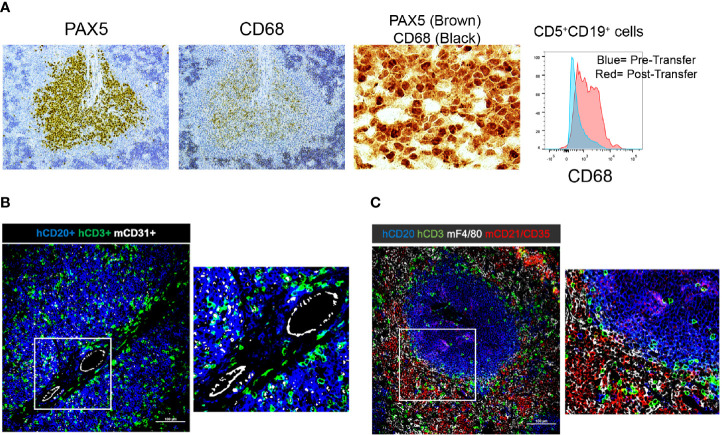
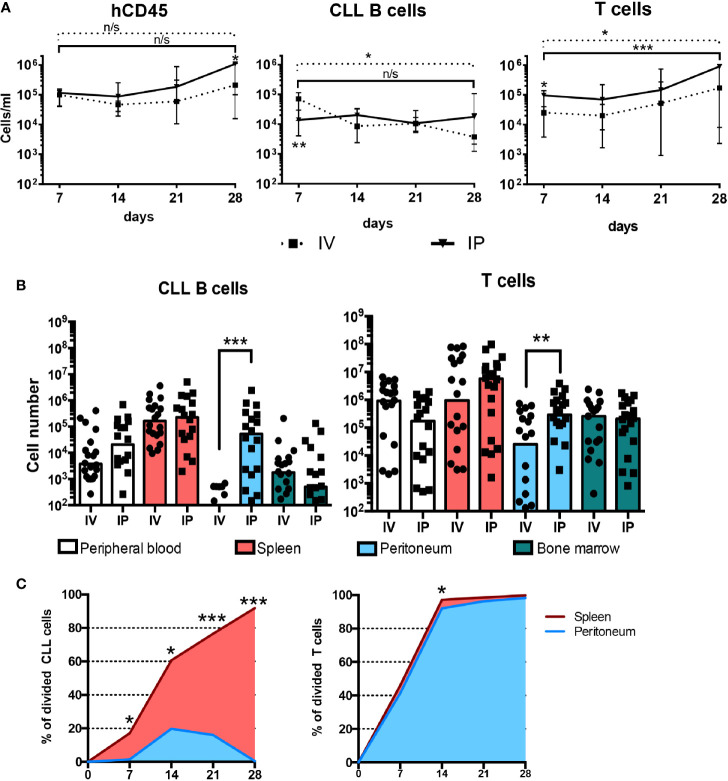
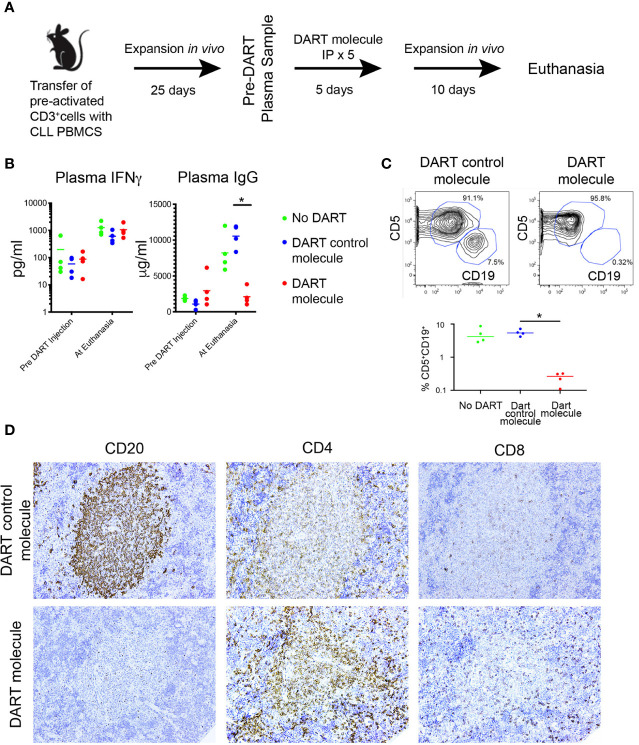
Patient-derived xenograft models of chronic lymphocytic leukemia (CLL) can be created using highly immunodeficient animals, allowing analysis of primary tumor cells in an in vivo setting. However, unlike many other tumors, CLL B lymphocytes do not reproducibly grow in xenografts without manipulation, proliferating only when there is concomitant expansion of T cells. Here we show that in vitro pre-activation of CLL-derived T lymphocytes allows for a reliable and robust system for primary CLL cell growth within a fully autologous system that uses small numbers of cells and does not require pre-conditioning. In this system, growth of normal T and leukemic B cells follows four distinct temporal phases, each with characteristic blood and tissue findings. Phase 1 constitutes a period during which resting CLL B cells predominate, with cells aggregating at perivascular areas most often in the spleen. In Phase 2, T cells expand and provide T-cell help to promote B-cell division and expansion. Growth of CLL B and T cells persists in Phase 3, although some leukemic B cells undergo differentiation to more mature B-lineage cells (plasmablasts and plasma cells). By Phase 4, CLL B cells are for the most part lost with only T cells remaining. The required B-T cell interactions are not dependent on other human hematopoietic cells nor on murine macrophages or follicular dendritic cells, which appear to be relatively excluded from the perivascular lymphoid aggregates. Notably, the growth kinetics and degree of anatomic localization of CLL B and T cells is significantly influenced by intravenous versus intraperitoneal administration. Importantly, B cells delivered intraperitoneally either remain within the peritoneal cavity in a quiescent state, despite the presence of dividing T cells, or migrate to lymphoid tissues where they actively divide; this dichotomy mimics the human condition in that cells in primary lymphoid tissues and the blood are predominately resting, whereas those in secondary lymphoid tissues proliferate. Finally, the utility of this approach is illustrated by documenting the effects of a bispecific antibody reactive with B and T cells. Collectively, this model represents a powerful tool to evaluate CLL biology and novel therapeutics in vivo.

Keywords: B cells; T cells; chronic lymphocytic leukemia; engraftment; growth; patient-derived xenograft.


Conflict of interest statement

NC received the DART molecule, the DART control molecule, and financial support to carry out the studies in Figure 8 from Janssen Pharmaceuticals, Inc. The remaining authors declare that the research was conducted in the absence of any commercial or financial relationships that could be construed as a potential conflict of interest.

Figures

Figure 1
Figure 1
Growth of CLL B cells only occurs when there is associated expansion of autologous T cells. Representative × 10 original magnification IH images of splenic tissue obtained at euthanasia (A) Few CD20+ cells with no CD3+ cells or Ki67+ cells are present (CLL1083, representative result from 10/15 animals). (B) Aggregates of CD20+ and CD3+ cells with Ki67+ cells are apparent around blood vessels (perivascular aggregates, PVAs) (CLL1279, representative of 5/15 animals).
Figure 2
Figure 2
Co-injection of autologous activated T cells with CLL PBMCs leads to more effective engraftment and growth in NSG mice. Time course quantification by FC of human CD45+ cells, CLL B cells and autologous CLL T cells from single cell suspensions in the peripheral blood, spleen and bone marrow of 4 different patients evaluated independently. PBMCs with or without aT were injected into 5 mice per group and bled weekly up to euthanasia at week 4 (n = 40 mice); for two of the patients, additional groups of mice were injected, and these were euthanized at weeks 5, 7 and 9. Points represent the median and the interquartile range. * corresponds to Mann-Whitney U test P values < 0.05, **P < 0.01, and ***P < 0.001. On the right, spleens of 10 mice at week 5 post injection of 20 × 106 CLL PBMCs with (Left; n = 5) and without (Right; n = 5) 0.5 × 10⁶ activated T cells (aT).
Figure 3
Figure 3
Busulfan preconditioning does not provide a clear advantage for the xenografting of primary CLL cells in the PBMC + aT model. (A) Five NSG mice did not or did receive 25mg/kg busulfan ip 24 h prior to xenografting. Then, 20 × 106 CLL PBMCs with 0.5 × 10⁶ activated T cells (aT) were injected iv into NSG mice. Five weeks after cell injection, mice were sacrificed and single cell suspensions from blood, spleen, bone marrow (BM) and peritoneum were analyzed by flow cytometry. Busulfan did not significantly improve CLL B-cell (top) and T-cell (bottom) engraftment. Data represent a composite of experiments involving cells from 4 patients, 2 U-CLL and 2 M-CLL. (B) Similar busulfan preconditioning was given or not to two other sets of 5 NSG mice that received samples from 4 different patients (2 U-CLL and 2 M-CLL). Twenty-four h after, 20 × 106 CLL PBMCs with 0.5 × 10⁶ activated T cells (aT) were injected ip into each recipient mouse. Although there is a trend for better engraftment of CLL B and T cells in busulfan-pretreated mice, there are no significant differences between the numbers of CLL B and T cells in any of the groups. Bar graphs represent the mean fold change (after setting the average cell counts obtained from PBMC mouse spleens as 1); S.E.M. determined by Mann-Whitney U test. n/s: no statistically significant difference.
Figure 4
Figure 4
Flow cytometry and IH analyses together with plasma findings over time help define phases of CLL B- and T-cell engraftment and growth. (A) Percentage of human CD5+CD4+ and CD5+CD19+ spleen-residing cells that have undergone >1 division and >6 divisions as indicated by CFSE dilution (Top) and time of appearance of detectable human IFNγ and human IgG in plasma over 28 days. Data derived from 25 animals using U-CLL1122, with euthanasia performed on 5 animals at each time point. Similar results were obtained using M-CLL1164. (B) Representative × 10 original magnification IH of splenic tissue showing typical CD20 and CD3 findings at each phase of engraftment. In Phase 1 the human cells identified are almost exclusively CD20+ with virtually no CD3+ cells detectable. With progression to Phases 2 and 3, CD3+ staining density becomes increased. Beginning in Phase 3 and continuing to Phase 4, CD38+ cells (used to identify plasmablasts/plasma cells) appear outside the CD20+PVAs. Ultimately, by Phase 4 very few CD20+ cells are seen in aggregates, but cytoplasmic Ig++ cells are now present (far right hand panel). Representative images obtained from spleens obtained from cases U-CLL1122 (top 2 rows), U-CLL1523 (third row) and U-CLL1083 (bottom row). (C) PVAs are strongly Ki67+ once both B- and T-cell division occurs. 40x original magnification view using immunofluorescence showing that both CD20+ (red) and CD3+ (green) cells express Ki67 (blue). Images obtained from U-CLL1301. (D) Flow cytometry findings from the experiment in (A) indicating the ratio of CD5+CD19+ cells to CD5+CD4+ cells.
Figure 5
Figure 5
T-cell findings in the PBMC + aT PDX model. (A) T cells residing in NSG spleens following transfer are principally CD4+. Top. The percentage of CD5+CD4+as a total of all T cells obtained by flow cytometry analysis of spleen at euthanasia at the time points shown. Data obtained from transfer of cells into 25 mice with euthanasia of 5 animals at each time point. Median percentage CD5+CD4+ cells indicated by bar and percentage figure. Bottom. The percentage of CD5+CD4+as a total of all T cells obtained by flow cytometry analysis of spleen at euthanasia. Data obtained from 13 independent experiments (each corresponding to a different CLL case number) where transfer had been made at least 28 days earlier. Median percentage CD5+CD4+ cells indicated by bar and percentage figure. n/s: no statistically significant differences. (B) Representative FC and IH findings of CD4+ and CD8+ staining in spleen. Images at × 10 original magnification. Pale central areas correspond to CD20+PVAs. For CLL1279, CD4+ cells are located especially around the rim of the known location of CD20 cells; a minimal number of CD8+ cells are present. CLL1623 has both CD4+ and CD8+ cells; CD4+ cells again locate around and within CD20+ aggregates. In CLL1083, CD4+ cells are densely present within the CD20+PVAs with less at the outer margin.
Figure 6
Figure 6
Immunohistochemistry demonstrating the presence and localization of non-B and non-T cells of donor or recipient origin in engrafted spleens. (A) 20x (single color PAX5 and CD68) and 60x (dual color) IH images of representative spleens aggregated from 5 independent experiments; results with CLL1279 are demonstrated here. Aggregates contain CD68+ cells that are B lymphocytes as indicated by co-localization with PAX5 in dual color staining. Flow cytometry further demonstrates that CD5+CD19+ cells express CD68 upon transfer into NSG mice. (B) 20x and 40x magnification view of human CD20+ and CD3+ cells and mouse CD31+ cells by immunofluorescence of CLL-engrafted spleens; staining from a representative case of at least 10 independent experiments. (C) 20x and 40x magnification view of human CD20+ and CD3+ cells and mouse F4/80+ and CD21+/35+ cells after immunofluorescence staining of the same case.
Figure 7
Figure 7
IP administration of CLL B and T cells gives rise to different distributions and activation states. (A) Time course quantification of human CD45-expressing cells, CLL B cells and human T cells evaluated by FC in the peripheral blood of mice injected with 20 × 106 CLL PBMCs with 0.5 × 10⁶ activated T cells either iv or ip (4 patients’ samples, 5 mice per patient and condition). Points represent the median and the interquartile range. (B) CLL B and T cell absolute counts at day 28 post injection in peripheral blood, spleen, peritoneum and bone marrow from mice injected iv (n = 20) or ip (n = 20). (C) Percentage of divided CLL B cells evaluated by CFSE dilution by FC in the spleen and the peritoneum over time. * corresponds to Mann-Whitney U test P values < 0.05, **P < 0.01, and ***P < 0.001. n/s: no statistically significant difference.
Figure 8
Figure 8
The PBMC + aT PDX model demonstrates the activity of a CD19xTcR-specific DART. (A) Mice (n = 15) were injected with 0.5 × 10⁶ anti-CD3/28 + IL-2 pre-activated CLL-derived T cells and 20 × 106 CLL PBMCs on Day 0. Expansion of both T and B cells was determined 25 days post transfer by detection of human IFNγ, and human IgG in murine plasma samples. DART bispecific antibodies (DART molecule, n = 4 animals; or DART control molecule, n = 4 animals) or saline were administered ip from Day 30 to Day 34. Plasma levels of human IFNγ and IgG were further determined at day 46 when euthanasia was performed. Animals with <10 pg/ml IFNγ at Day 25 were excluded from receiving DARTs and were not included in the analysis making 3 groups of 4 animals for each condition. (B) Plasma levels of IFNγ and IgG in the 3 groups of animals (n = 12, 4 per group), taken pre-DART injection at Day 25 and at euthanasia at Day 40. Results show no significant differences in IFNγ levels between the 3 groups before DART molecule injection and at euthanasia. In contrast, plasma Ig levels are significantly lower in CD19xTcR DART-treated animals (red dots), compared to the DART control molecule-treated control animals (blue dots). * corresponds to Kruskal-Wallis test P value < 0.05. (C) FC reveals absence of CD5+CD19+ cells in DART molecule-treated animals. Illustrative FC plots are representative of hCD45 single cell splenic suspensions obtained at euthanasia. Graph shows median CD5+CD19+ cells in each group as a percentage of total hCD45+ cells isolated. Compared to DART control molecule-treated control animals (blue dots), there are significantly fewer CD5+CD19+ cells in DART molecule-treated animals (red dots). * corresponds to Kruskal-Wallis test P value < 0.05. (D) Representative IHC (x20 original magnification) of DART control molecule-treated animals (upper panel) compared to DART molecule-treated animals (lower panel). These results were apparent for both a U-CLL1539 (illustrated in Figure) and M-CLL0545.

References

    1. Durig J, Ebeling P, Grabellus F, Sorg UR, Mollmann M, Schutt P, et al. A novel nonobese diabetic/severe combined immunodeficient xenograft model for chronic lymphocytic leukemia reflects important clinical characteristics of the disease. Cancer Res (2007) 67(18):8653–61. 10.1158/0008-5472.CAN-07-1198 - DOI - PubMed
    1. Aydin S, Grabellus F, Eisele L, Mollmann M, Hanoun M, Ebeling P, et al. Investigating the role of CD38 and functionally related molecular risk factors in the CLL NOD/SCID xenograft model. Eur J Haematol (2011) 87(1):10–9. 10.1111/j.1600-0609.2011.01626.x - DOI - PubMed
    1. Oldreive CE, Skowronska A, Davies NJ, Parry H, Agathanggelou A, Krysov S, et al. T-cell number and subtype influence the disease course of primary chronic lymphocytic leukaemia xenografts in alymphoid mice. Dis Model Mech (2015) 8(11):1401–12. 10.1242/dmm.021147 - DOI - PMC - PubMed
    1. Bagnara D, Kaufman MS, Calissano C, Marsilio S, Patten PE, Simone R, et al. A novel adoptive transfer model of chronic lymphocytic leukemia suggests a key role for T lymphocytes in the disease. Blood (2011) 117(20):5463–72. 10.1182/blood-2010-12-324210 - DOI - PMC - PubMed
    1. Herman SE, Sun X, McAuley EM, Hsieh MM, Pittaluga S, Raffeld M, et al. Modeling tumor-host interactions of chronic lymphocytic leukemia in xenografted mice to study tumor biology and evaluate targeted therapy. Leukemia (2013) 27:2311–21. 10.1038/leu.2013.131 - DOI - PMC - PubMed

Publication types

LinkOut - more resources