. 2021 Mar 9:12:632667.
doi: 10.3389/fimmu.2021.632667. eCollection 2021.

PD-1 Blockade Modulates Functional Activities of Exhausted-Like T Cell in Patients With Cutaneous Leishmaniasis

Affiliations

PD-1 Blockade Modulates Functional Activities of Exhausted-Like T Cell in Patients With Cutaneous Leishmaniasis

Renan Garcia de Moura et al. Front Immunol. .

Abstract

Patients infected by Leishmania braziliensis develop debilitating skin lesions. The role of inhibitory checkpoint receptors (ICRs) that induce T cell exhaustion during this disease is not known. Transcriptional profiling identified increased expression of ICRs including PD-1, PDL-1, PDL-2, TIM-3, and CTLA-4 in skin lesions of patients that was confirmed by immunohistology where there was increased expression of PD-1, TIM-3, and CTLA-4 in both CD4+ and CD8+ T cell subsets. Moreover, PDL-1/PDL-2 ligands were increased on skin macrophages compared to healthy controls. The proportions PD1+, but not TIM-3 or CTLA-4 expressing T cells in the circulation were positively correlated with those in the lesions of the same patients, suggesting that PD-1 may regulate T cell function equally in both compartments. Blocking PD-1 signaling in circulating T cells enhanced their proliferative capacity and IFN-γ production, but not TNF-α secretion in response to L. braziliensis recall antigen challenge in vitro. While we previously showed a significant correlation between the accumulation of senescent CD8+CD45RA+CD27- T cells in the circulation and skin lesion size in the patients, there was no such correlation between the extent of PD-1 expression by circulating on T cells and the magnitude of skin lesions suggesting that exhausted-like T cells may not contribute to the cutaneous immunopathology. Nevertheless, we identified exhausted-like T cells in both skin lesions and in the blood. Targeting this population by PD-1 blockade may improve T cell function and thus accelerate parasite clearance that would reduce the cutaneous pathology in cutaneous leishmaniasis.

Keywords: Leishmania braziliensis; PD-1; T cell exhaustion; cutaneous leishmaniasis; immunosenescence; inhibitory checkpoint receptors; senescent T cells.


Conflict of interest statement

The authors declare that the research was conducted in the absence of any commercial or financial relationships that could be construed as a potential conflict of interest. The handling editor declared a shared affiliation, though no other collaboration, with one of the authors HM.

Figures
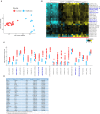
Figure 1
Figure 1
Identification of inhibitory checkpoint receptors gene expression signatures in CL lesions. (A) Principal components analysis showing principal component 1 (PC1) with variance of 64% and PC2 with variance of 6% of human transcriptome from 10 healthy volunteers (blue circle) and 25 CL patients (red circle). (B) Heatmap of exhaustion receptors and ligands genes expression. Columns represent individual healthy controls and CL patients and rows represent individual genes, colored to indicate relative expression levels (genes were mean centered across samples). (C) Plots showing expression of receptors [PDCD1 (PD-1), HAVCR2 (TIM-3), CTLA4 (CTLA-4), LAG3 (LAG-3), TIGIT, CD244 (2B4), NECTIN2 (CD112), CD48 (BLAST-1), PVR (CD155), TNFRSF14 (HVEM), CD276 (B7H3), CEACAM1 (CD66a), LILRA2 (ILT1), LILRB1 (ILT2), LILRB4 (ILT3), LILRB2 (ILT4), LILRB3 (ILT5), VSIR (VISTA)] and ligands [CD274 (PDL-1), PDCD1LG2 (PDL-2), CD80 (B7-1), CD86 (B7-2), LGALS9 (Galectin 9), BTLA (CD272), VSIR (VISTA)] in healthy skin (blue) and CL lesions (red). (D) Table with fold change and p -values of the analysed inhibitory checkpoint receptors lesional gene expression.
Figure 2
Figure 2
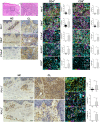
Inhibitory molecules and senescent-associated receptors are enriched in lesional skin during cutaneous leishmaniasis. (A) Representative hematoxylin and eosin staining of cutaneous leishmaniasis lesion with (B) dense inflammatory infiltrate. Immunohistochemistry staining (in brown) in healthy skin and CL lesions for PD-1 (C, D), TIM-3 (E, F), CTLA-4 (G, H), PD-L1 (S, T), and PD-L2 (U, V). Immunofluorescence staining and cumulative data of the inhibitory checkpoint receptors PD-1, TIM-3, CTLA-4, and the senescence markers KLRG1 and CD57 expressed on CD4+ (I, K, M, O, Q) and CD8+ (J, L, N, P, R) cells from healthy controls (n = 8) and CL patients (n = 10). (W–Y) Representative staining and cumulative data of the expression of the inhibitory ligands PDL-1 or PDL-2 on dermal macrophages (CD68+) in healthy (n = 7) and lesional skin (n = 8). The white arrows indicate double-stained cells. The graphs show the mean ± SD. The p-values were calculated using Student’s t test with Welch’s correction or Mann-Whitney U-test. *p < 0.05, **p < 0.01, ***p < 0.001, ****p < 0.0001.
Figure 3
Figure 3
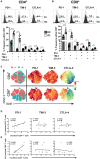
CL patients have multiple and single exhaustion receptor expression on circulating T cells. Representative histograms and cumulative data of percentage of PD-1, TIM-3 and CTLA-4 in CD4+ (A) and CD8+ (B) T cells isolated from healthy control- HC (n = 15) or patients with active cutaneous leishmaniasis-CL (n = 15). (C) tSNE performed gating on CD4+ and CD8+ cells from HC (blue dots) and CL (red dots) groups. The level of expression of PD-1, TIM-3, and CTLA-4 were evaluated separately on live cells generating the expression levels of the hierarchical clusters, represented in red for high expression, whereas blue represents low expression (cold-to-hot heat map). Scatterplot showing the Spearman’s correlation test relationship between frequencies of lesional and circulating (D) CD4+ and (E) CD8+ T cells expressing PD-1, TIM-3, or CTLA-4 (n = 10). The graphs show the mean with 95% of confidence. The p-values were calculated using Mann-Whitney test. *p < 0.05, **p < 0.01, ****p < 0.0001.
Figure 4
Figure 4
Proliferative and pro-inflammatory cytokines are increased by blocking PD-1 pathway in CL CD4+ and CD8+ T cells. (A) Representative histograms and pooled data showing Ki67 staining on CD4+ and CD8+ T cells from PBMC measured by flow cytometry after 72 h stimulation with 10 μg/ml of L. braziliensis promastigote antigens (LbAg). The cell cultures ware performed in the presence of 10 μg/ml anti-PDL1/2 antibodies. In control cultures, 10 μg/mL IgG2a, IgG2b were added (n= 6). (B) fold change of quantitative fluorescence intensity levels normalized with CD4+/CD8+ T cells stimulated with LbAg. (C, D) Representative dotplots and pooled data of frequencies of IFN-γ and TNF-α within CD4+ and CD8+ T cells after activation in the presence of PD-1 blocker. (E) Production of IFN-γ, TNF-α and IL-10 determined in the culture supernatants by CBA after activation with LbAg in the presence of PD-1 blockade. (F) Ratio between Ag-specific cytokines production before and after PD1 blockade. The graphs show the mean ± SEM. The p-values were calculated using Mann-Whitney test. *p < 0.05, **p < 0.01, ***p < 0.001, ****p < 0.0001, NS, not statistically significant.
Figure 5
Figure 5
PD-1 expression is increased in differentiated CD8+ T cells but not correlated with lesion size of CL patients. (A) Representative plots of CD8+ T cells subsets isolated from HC and characterized by expressing CD45RA and CD27 markers (naïve-CD45RA+ CD27+; CM-central memory, CD45RA- CD27+; EM-effector memory, CD45RA-CD27-; and EMRA-effector memory T cells that re-express CD45RA, CD45RA+ CD27-). (B) Representative histogram and cumulative data of the ex vivo PD-1 frequencies within CD8+ subsets. (C) Pearson’s correlation test between frequencies of CD8+PD1+ T subsets (Naïve, CM, EM, and EMRA) and lesions size (mm2) of CL patients. (D) Cumulative data of the ex vivo PD1+ CLA+ within CD4+ and CD8+ subsets. The graphs show the mean ± SEM. The p-values were calculated using Mann-Whitney test. *p < 0.05, **p < 0.01, ***p < 0.001, ****p < 0.0001.

References

    1. World Health Organization . OMS | Leishmaniasis. In: WHO, vol. 375. (2015). Available at: http://whqlibdoc.who.int/trs/WHO_TRS_949_eng.pdf.
    1. Ribeiro-Romao RP, Moreira OC, Osorio EY, Cysne-Finkelstein L, Gomes-Silva A, Valverde JG, et al. . Comparative Evaluation of Lesion Development, Tissue Damage, and Cytokine Expression in Golden Hamsters (Mesocricetus auratus) Infected by Inocula with Different Leishmania (Viannia) braziliensis Concentrations. Infect Immun (2014) 82:5203–13. 10.1128/IAI.02083-14 - DOI - PMC - PubMed
    1. Costa JML, Saldanha ACR, Nasciento D, Sampaio G, Carneiro F, Lisboa E, et al. . Clinical modalities, diagnosis and therapeutic approach of tegumentary leishmaniasis in Brazil. Gaz Med Da Bahia (2009) 143:70–83.
    1. Carvalho LP, Passos S, Schriefer A, Carvalho EM. Protective and pathologic immune responses in human tegumentary leishmaniasis. Front Immunol (2012) 3:301. 10.3389/fimmu.2012.00301 - DOI - PMC - PubMed
    1. Scott P, Novais FO. Cutaneous leishmaniasis: immune responses in protection and pathogenesis. Nat Rev Immunol (2016) 16:581–92. 10.1038/nri.2016.72 - DOI - PubMed

Publication types

MeSH terms