. 2021 Mar 9:12:637335.
doi: 10.3389/fimmu.2021.637335. eCollection 2021.

TSC1 Affects the Process of Renal Ischemia-Reperfusion Injury by Controlling Macrophage Polarization

Affiliations

TSC1 Affects the Process of Renal Ischemia-Reperfusion Injury by Controlling Macrophage Polarization

Xiao Hu et al. Front Immunol. .

Abstract

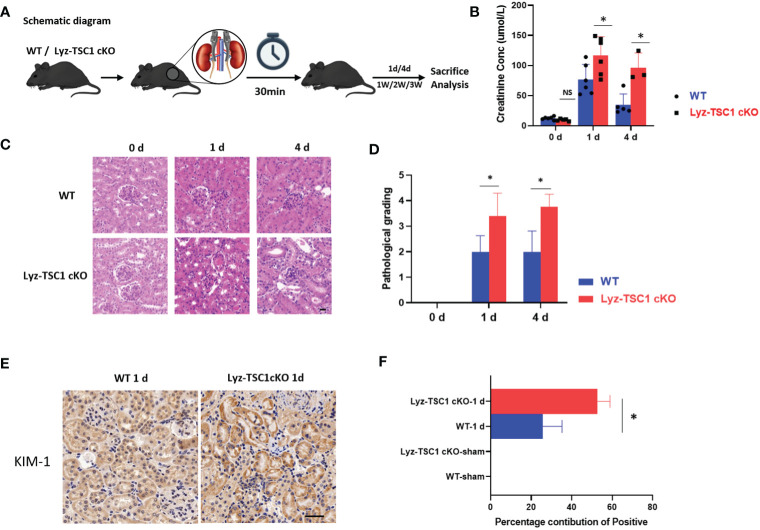
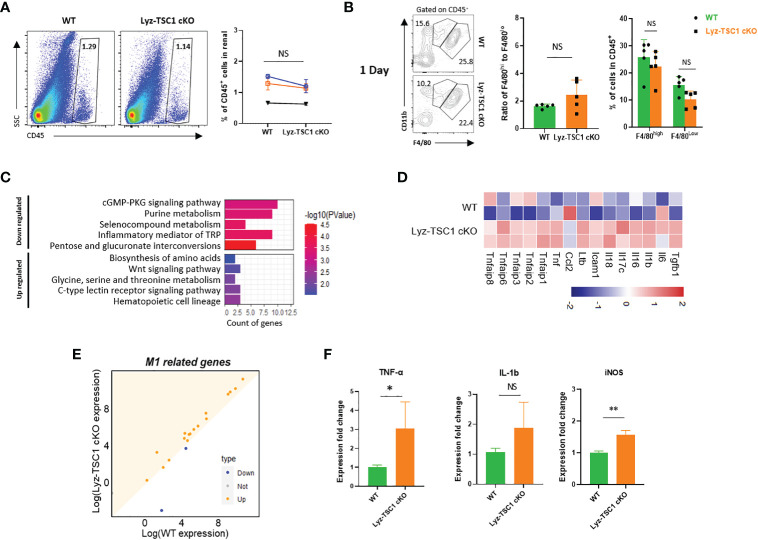
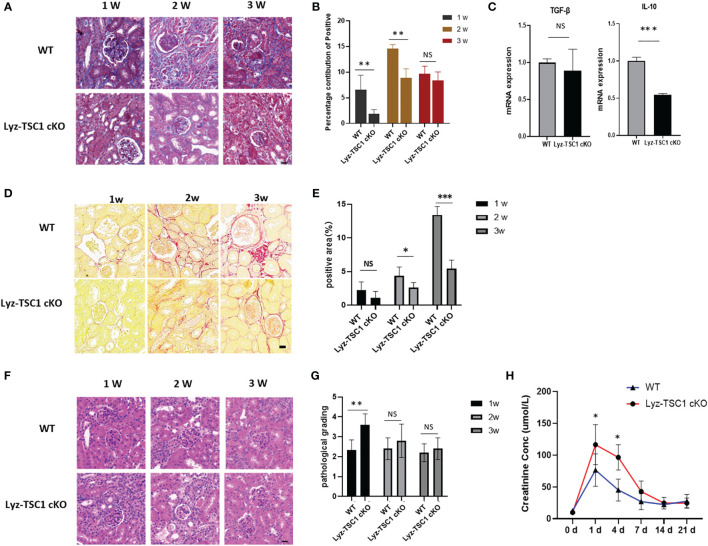
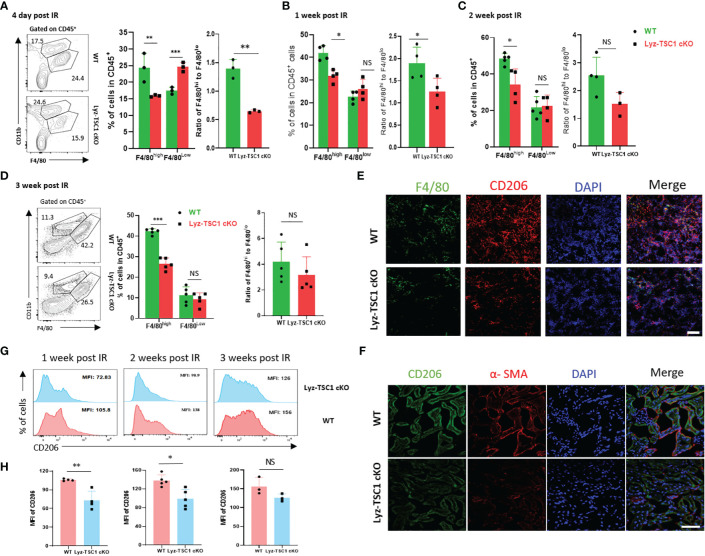
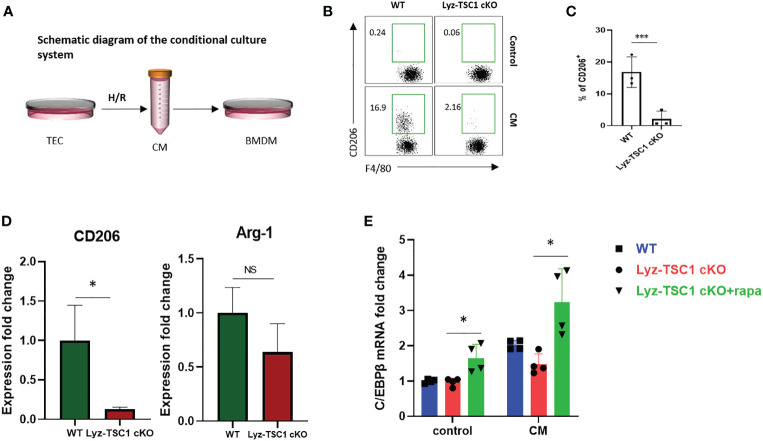
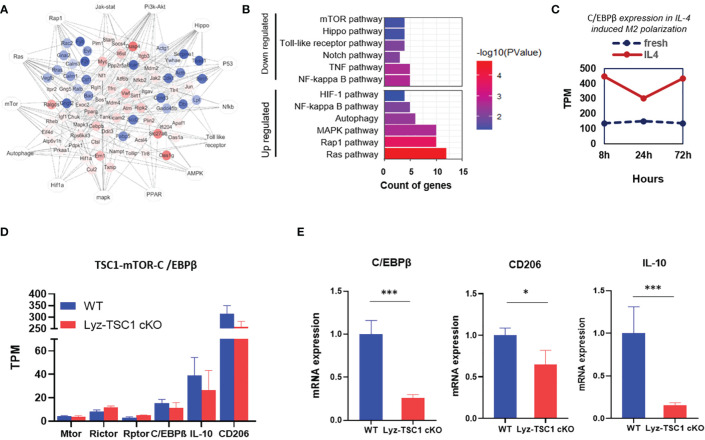
Renal ischemia-reperfusion injury (IRI) contributes to acute kidney injury (AKI), increases morbidity and mortality, and is a significant risk factor for chronic kidney disease (CKD). Macrophage infiltration is a common feature after renal IRI, and infiltrating macrophages can be polarized into the following two distinct types: M1 macrophages, i.e., classically activated macrophages, which can not only inhibit infection but also accelerate renal injury, and M2 macrophages, i.e., alternatively activated macrophages, which have a repair phenotype that can promote wound healing and subsequent fibrosis. The role of TSC1, which is a negative regulator of mTOR signaling that regulates macrophage polarization in inflammation-linked diseases, has been well documented, but whether TSC1 contributes to macrophage polarization in the process of IRI is still unknown. Here, by using a mouse model of renal ischemia-reperfusion, we found that myeloid cell-specific TSC1 knockout mice (termed Lyz-TSC1 cKO mice) had higher serum creatinine levels, more severe histological damage, and greater proinflammatory cytokine production than wild-type (WT) mice during the early phase after renal ischemia-reperfusion. Furthermore, the Lyz-TSC1 cKO mice showed attenuated renal fibrosis during the repair phase of IRI with decreased levels of M2 markers on macrophages in the operated kidneys, which was further confirmed in a cell model of hypoxia-reoxygenation (H/R) in vitro. Mechanistically, by using RNA sequencing of sorted renal macrophages, we found that the expression of most M1-related genes was upregulated in the Lyz-TSC1 cKO group (Supplemental Table 1) during the early phase. However, C/EBPβ and CD206 expression was decreased during the repair phase compared to in the WT group. Overall, our findings demonstrate that the expression of TSC1 in macrophages contributes to the whole process of IRI but serves as an inflammation suppressor during the early phase and a fibrosis promoter during the repair phase.

Keywords: fibrosis; ischemia-reperfusion (IR); kidney; macrophage polarization; tuberous sclerosis complex 1 (TSC1).


Conflict of interest statement

The authors declare that the research was conducted in the absence of any commercial or financial relationships that could be construed as potential conflicts of interest.

Figures

Figure 1
Figure 1
TSC1 depletion in macrophage aggravated mice IR-induced tubular injury. (A) Schematic diagram. (B) Serum creatinine levels in wild-type (WT) and Lyz-TSC1 cKO mice at baseline (0) and 1 and 4 days post-IRI. (C) Representative H&E-stained renal sections of WT and Lyz-TSC1 cKO mice. Scale bar: 20 µm. (D) Quantification of H&E staining corresponding to the WT and Lyz-TSC1 cKO mice shown in (C). (E) Representative Kidney Injury Molecule 1 (KIM-1) immunohistochemistry in renal sections from WT and KO mice on day 1 post-IRI (×200). (F) Quantification of KIM-1 immunohistochemistry-stained murine renal cortical sections on day 0 and day 1 after IRI. In (B, D, F), the data are shown as the mean ± SD and were analyzed by an unpaired two-tailed Student’s t-test (n ≥ 3). *P < 0.05; **P < 0.01; NS, not significant.
Figure 2
Figure 2
Increased M1 polarization of TSC1 knockout macrophages during the early phase. (A) Inflammatory cell infiltration and percentage of CD45+ cells in WT and Lyz-TSC1 cKO kidneys on day 1 after reperfusion. (B) F4/80high macrophages and F4/80low macrophages from WT and Lyz-TSC1 cKO mice gated on CD45+ cells. (C) Histogram of the top 10 most up- and downregulated KEGG pathways. (D) Dot plot of M1-related genes. The orange color represents the upregulated genes in the Lyz-TSC1 cKO macrophages. (E) Heatmap of up- and downregulated M1-related genes in the WT and Lyz-TSC1 cKO groups. (F) Relative mRNA expression of interleukin -1β (IL-1β), tumor necrosis factor-α (TNF-α), and iNOS in kidney macrophages sorted from WT and Lyz-TSC1 cKO mice 24 h after IRI. In (A, B, F), the data are shown as the mean ± SD and were analyzed by an unpaired two-tailed Student’s t-test (n ≥ 3). *P < 0.05; **P < 0.01; NS, not significant.
Figure 3
Figure 3
Decreased renal fibrosis after IRI in Lyz-TSC1 cKO mice. (A) Representative images of Masson’s trichrome staining of WT and Lyz-TSC1 cKO kidneys on days 7, 14, and 21 after reperfusion. Scale bar: 20 µm. (B) Quantification of Masson’s trichrome staining corresponding to the WT and Lyz-TSC1 cKO mice shown in (A). (C) Fibrosis-related cytokines (transforming growth factor-β [TGF-β] and IL-10) mRNA relative expression in kidneys from WT or Lyz-TSC1 cKO mice on day 14 after reperfusion. (D) Representative Sirius Red-stained renal sections of WT and Lyz-TSC1 cKO mice. Scale bar: 20 µm. (E) Quantification of Sirius Red staining corresponding to the WT and Lyz-TSC1 cKO mice shown in (D). (F) Representative images of HE staining of WT and Lyz-TSC1 cKO kidneys on days 7, 14, and 21 after reperfusion. Scale bar: 20 µm. (G) Renal tubular injury scores of H&E staining corresponding to the WT and Lyz-TSC1 cKO mice shown in (F). (H) Serum creatinine levels in WT and Lyz-TSC1 cKO mice on days 7, 14, and 21 after ischemia-reperfusion. In (B, C, E, G, H), the data are shown as the mean ± SD and were analyzed by an unpaired two-tailed Student’s t-test (n ≥ 3). *P < 0.05; **P < 0.01; NS, not significant.
Figure 4
Figure 4
Decreased M2 polarization in Lyz-TSC1 cKO macrophages during the repair process of renal ischemia-reperfusion. (A–D) Left panel: representative dot plots of the proportion of F4/80hi and F4/80low macrophage subsets in CD45+ cells in the WT and Lyz-TSC1 cKO kidneys. Middle panel: quantification of the proportion of F4/80hi and F4/80low macrophage subsets in CD45+ cells. Right panel: ratio of F4/80hi and F4/80low macrophage subsets. (A) Day 4 post-IRI. (B) Day 7 post-IRI. (C) Day 14 post-IRI. (D) Day 21 post-IRI. (E) M2 macrophages were double-positive for F4/80 (green) and CD206 (red) by immunofluorescence in the WT and Lyz-TSC1 cKO kidneys on day 14. Scale bar: 50 µm. (F) Kidney sections were subjected to immunofluorescence staining for CD206 and a-SMA. Scale bar: 50 µm. (G, H) CD206 mean fluorescence intensity (MFI) in macrophages in WT and Lyz-TSC1 cKO mice kidney were analyzed after ischemia-reperfusion injury on days 7, 14, and 21. Each dot represents an individual mouse. In (A–D, G, H), the data are shown as the mean ± SD and were analyzed by an unpaired two-tailed Student’s t-test (n ≥ 3). *P < 0.05; **P < 0.01; NS, not significant.
Figure 5
Figure 5
Defective polarization to conditional medium of TSC1 cKO macrophages is mediated by mTOR-C/EBPβ in vitro. (A) Experimental design of the BMDMs from the WT and Lyz-TSC1 cKO mice, which were treated with CM from mouse renal TECs (mRTECs) cell line after hypoxia-reoxygenation (H/R) injury. (B) Representative dot plots of the CD206+ subset in the F4/80+ compartment in the WT or TSC1 cKO BMDMs treated with conditional medium. (C) Quantification of the proportion of the CD206+ subset in F4/80+ macrophages. (D) Relative expression of CD206 and Arginase-1 (Arg-1) in WT or TSC1 cKO BMDMs treated with CM. (E) Lyz-tsc1 cKO BMDMs were pretreated with Rapa (100 nM) for 1 h and then stimulated with CM for an additional 48 h. C/EBPβ expression in WT, Lyz-TSC1 cKO, and Lyz-TSC1 cKO treated with Rapa as determined by quantitative PCR after treatment with or without CM. In (C, D), the data are shown as the mean ± SD and were analyzed by an unpaired two-tailed Student’s t-test (n ≥ 3). *P < 0.05; **P < 0.01; NS, not significant.
Figure 6
Figure 6
Decreased C/EBPβ expression in TSC1 cKO renal macrophages during the repair phase of IRI may also be induced by overactivated mTOR activity. (A) Network summary of previous enrichment of the KEGG pathway related to M2 polarization. (B) Top 12 most up- and downregulated pathways by differential mRNA. (C) C/EBPβ expression with or without IL-4 induced M2 polarization in the downloaded data. (D) TPM value of mTOR, Rictor, Raptor, C/EBPβ, and IL-10 in macrophages from WT or Lyz-TSC1 cKO mouse kidneys 2 weeks after ischemia-reperfusion. (E) Relative expression of C/EBPβ, CD206, and IL-10 in kidney macrophages sorted from WT and Lyz-TSC1 cKO mice on day 14 post-IRI. In (E), the data are shown as the mean ± SD and were analyzed by an unpaired two-tailed Student’s t-test (n ≥ 3). *P < 0.05; **P < 0.01; NS, not significant.

Similar articles

Cited by

References

    1. Tammaro A, Kers J, Scantlebery AML, Florquin S. Metabolic flexibility and innate immunity in renal ischemia reperfusion injury: The fine balance between adaptive repair and tissue degeneration. Front Immunol (2020) 11:1346. 10.3389/fimmu.2020.01346 - DOI - PMC - PubMed
    1. Kezić A, Stajic N, Thaiss F. Innate immune response in kidney ischemia/reperfusion injury: Potential target for therapy. J Immunol Res (2017) 2017:6305439. 10.1155/2017/6305439 - DOI - PMC - PubMed
    1. Huen SC, Cantley LG. Macrophages in renal injury and repair. Annu Rev Physiol (2017) 79:449–69. 10.1146/annurev-physiol-022516-034219 - DOI - PubMed
    1. De Greef KE, Ysebaert DK, Dauwe S, Persy V, Vercauteren SR, Mey D, et al. . Anti-b7-1 blocks mononuclear cell adherence in vasa recta after ischemia. Kidney Int (2001) 60:1415–27. 10.1046/j.1523-1755.2001.00944.x - DOI - PubMed
    1. Tang PM-K, Nikolic-Paterson DJ, Lan H-Y. Macrophages: Versatile players in renal inflammation and fibrosis. Nat Rev Nephrol (2019) 15:144–58. 10.1038/s41581-019-0110-2 - DOI - PubMed

Publication types