. 2021 Mar 9:12:571231.
doi: 10.3389/fgene.2021.571231. eCollection 2021.

Identification and Analysis of Potential Key Genes Associated With Hepatocellular Carcinoma Based on Integrated Bioinformatics Methods

Affiliations

Identification and Analysis of Potential Key Genes Associated With Hepatocellular Carcinoma Based on Integrated Bioinformatics Methods

Zhuolin Li et al. Front Genet. .

Abstract

Background: Hepatocellular carcinoma (HCC) is a type of primary liver tumor with poor prognosis and high mortality, and its molecular mechanism remains incompletely understood. This study aimed to use bioinformatics technology to identify differentially expressed genes (DEGs) in HCC pathogenesis, hoping to identify novel biomarkers or potential therapeutic targets for HCC research.

Methods: The bioinformatics analysis of our research mostly involved the following two datasets: Gene Expression Omnibus (GEO) and The Cancer Genome Atlas (TCGA). First, we screened DEGs based on the R packages (limma and edgeR). Using the DAVID database, the Gene Ontology (GO) and Kyoto Encyclopedia of Genes and Genomes (KEGG) enrichment analyses of DEGs were carried out. Next, the protein-protein interaction (PPI) network of the DEGs was built in the STRING database. Then, hub genes were screened through the cytoHubba plug-in, followed by verification using the GEPIA and Oncomine databases. We demonstrated differences in levels of the protein in hub genes using the Human Protein Atlas (HPA) database. Finally, the hub genes prognostic values were analyzed by the GEPIA database. Additionally, using the Comparative Toxicogenomics Database (CTD), we constructed the drug-gene interaction network.

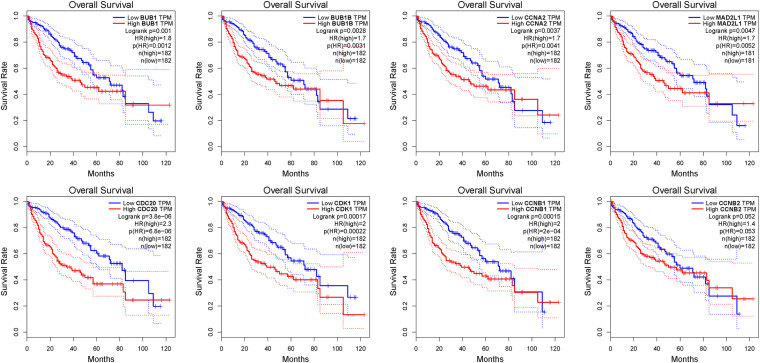
Results: We ended up with 763 DEGs, including 247 upregulated and 516 downregulated DEGs, that were mainly enriched in the epoxygenase P450 pathway, oxidation-reduction process, and metabolism-related pathways. Through the constructed PPI network, it can be concluded that the P53 signaling pathway and the cell cycle are the most obvious in module analysis. From the PPI, we filtered out eight hub genes, and these genes were significantly upregulated in HCC samples, findings consistent with the expression validation results. Additionally, survival analysis showed that high level gene expression of CDC20, CDK1, MAD2L1, BUB1, BUB1B, CCNB1, and CCNA2 were connected with the poor overall survival of HCC patients. Toxicogenomics analysis showed that only topotecan, oxaliplatin, and azathioprine could reduce the gene expression levels of all seven hub genes.

Conclusion: The present study screened out the key genes and pathways that were related to HCC pathogenesis, which could provide new insight for the future molecularly targeted therapy and prognosis evaluation of HCC.

Keywords: GEO; TCGA; bioinformatics; biomarker; differentially expressed genes; hepatocellular carcinoma; survival.


Conflict of interest statement

The authors declare that the research was conducted in the absence of any commercial or financial relationships that could be construed as a potential conflict of interest.

Figures

FIGURE 1
FIGURE 1
Identification of DEGs. (A,B) show the volcano maps of DEGs for (A) GSE121248 dataset, (B) TCGA-LIHC dataset. (C) The heatmap of the top 50 DEGs in dataset GSE121248. The green color and red color in the heatmap indicate low and high expression of DEGs. (D) Venn diagrams of the DEGs between the GSE121248 dataset and the TCGA-LIHC dataset. (E) The heatmap of the top 100 overlapping DEGs according to the value of | logFC| in TCGA-LIHC dataset. The color in heatmaps from green to red shows the progression from down-regulation to up-regulation.
FIGURE 2
FIGURE 2
Enrichment analysis of the overlapping DEGs. (A–C) illustrate the GO enrichment analysis results: (A) molecular function, (B) biological process and (C) cellular components. (D) KEGG pathway enrichment analysis results.
FIGURE 3
FIGURE 3
Venn diagram and the top three clustering modules of PPI network. (A) Module 1 with an MCODE score of 56.5. The red nodes are the hub genes. (B) Module 2 obtained a score of 10.0 from MCODE. (C) Module 3 with an MCODE score of 7.4. Edges represent the protein-protein associations. The higher the module score, the more important the module is in the PPI network. (D) Venn diagrams of the hub genes between three methods (MNC, MCC, and DMNC).
FIGURE 4
FIGURE 4
Validation of eight hub genes mRNA expression levels in HCC tissues vs. normal liver tissues using the GEPIA database (A–H). The red color represents the tumor samples and the gray color represents the normal liver samples.
FIGURE 5
FIGURE 5
An summary of mRNA expression results of 8 hub genes in multiple tumors using the Oncomine database. The numbers in colored cells show the quantities of datasets with high (red) or low (blue) mRNA expression of the hub genes.
FIGURE 6
FIGURE 6
The OS analysis of 8 hub genes in the HCC patients using the GEPIA database. The red curve is the high expression group and the blue curve is the low-expression group. p-value < 0.05.
FIGURE 7
FIGURE 7
Immunohistochemical staining analysis of hub genes (CCNA2, CCNB1, CCNB2, CDC20, CDK1, and MAD2L1) in HCC tissues and normal liver tissues.
FIGURE 8
FIGURE 8
Drug-gene interactions network with chemotherapeutic drugs and seven hub genes was constructed using the CTD database. (A–G) shows the relationship between existing chemotherapeutic drugs and the expression levels of hub genes. (A) BUB1, (B) BUB1B, (C) CCNA2, (D) CCNB1, (E) CDC20, (F) MAD2L1, and (G) CDK1. The red and green arrows represent that the chemotherapy drugs will increase or decrease the expression of the hub genes. The number of arrows between hub genes and chemotherapy drugs indicates the number of references supported by previous studies.

Similar articles

Cited by

References

    1. Au K. P., Chok K. S. H. (2018). Multidisciplinary approach for post-liver transplant recurrence of hepatocellular carcinoma: a proposed management algorithm. World J. Gastroenterol. 24 5081–5094. 10.3748/wjg.v24.i45.5081 - DOI - PMC - PubMed
    1. Aufhauser D. D., Jr., Sadot E., Murken D. R., Eddinger K., Hoteit M., Abt P. L., et al. (2018). Incidence of occult intrahepatic metastasis in hepatocellular carcinoma treated with transplantation corresponds to early recurrence rates after partial hepatectomy. Ann. Surg. 267 922–928. 10.1097/sla.0000000000002135 - DOI - PMC - PubMed
    1. Bader G. D., Hogue C. W. (2003). An automated method for finding molecular complexes in large protein interaction networks. BMC Bioinformatics 4:2. 10.1186/1471-2105-4-2 - DOI - PMC - PubMed
    1. Baecker A., Liu X., La Vecchia C., Zhang Z. F. (2018). Worldwide incidence of hepatocellular carcinoma cases attributable to major risk factors. Eur. J. Cancer Prev. 27 205–212. 10.1097/cej.0000000000000428 - DOI - PMC - PubMed
    1. Bolstad B. M., Irizarry R. A., Astrand M., Speed T. P. (2003). A comparison of normalization methods for high density oligonucleotide array data based on variance and bias. Bioinformatics 19 185–193. 10.1093/bioinformatics/19.2.185 - DOI - PubMed