Review
. 2021 Mar 3:11:13.
doi: 10.25259/JCIS_135_2020. eCollection 2021.

Tumors and pseudotumors of the soft tissues: Imaging semiology and strategy

Affiliations
Review

Tumors and pseudotumors of the soft tissues: Imaging semiology and strategy

Charlinne Paixao et al. J Clin Imaging Sci. .

Abstract

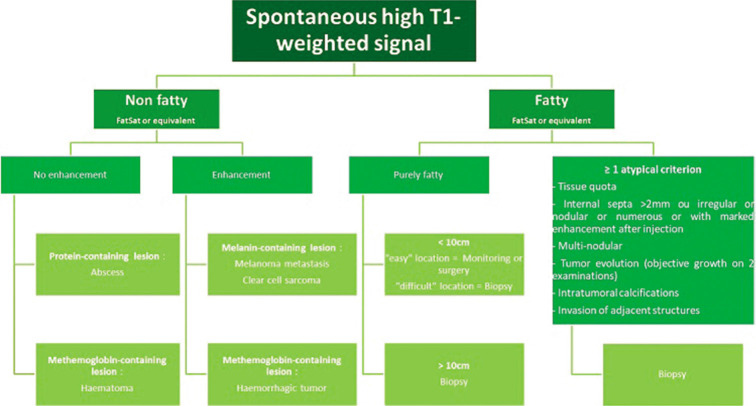
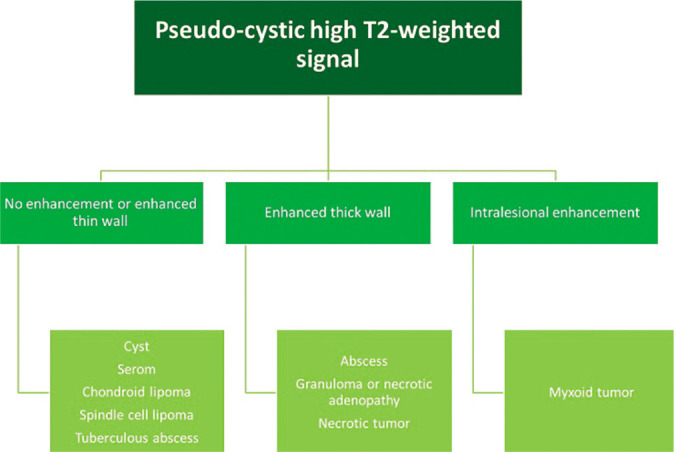
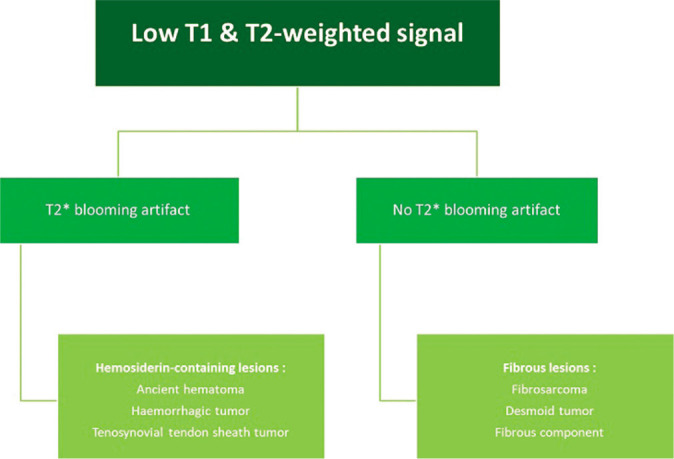
The aims of this educational review are to learn the semiological basis of soft-tissue lesions and, with the help of diagnostic algorithms, to apply the current recommendations for the management of soft-tissue tumors. Pseudotumors must first be identified and excluded. Among primary tumors, the search for macroscopic fat content on MRI is decisive; since it restricts the diagnostic range to adipocytic tumors. Key imaging features of non-adipocytic tumors are highlighted. When a deep soft-tissue mass is found, therapeutic abstention or simple monitoring is only appropriate when there is diagnostic certainty: This is only the case for typical pseudotumors, typical benign tumors, and fat tumors without atypical criteria. In all other cases, histological evidence is required. If there is any suspicion of soft-tissue sarcoma or any undetermined lesion, the patient should be referred to a sarcoma referral center before biopsy.

Keywords: Adipocytic tumor; Lipoma; Liposarcoma; Non-adipocytic tumor; Soft-tissue sarcoma.


Conflict of interest statement

There are no conflicts of interest.

Figures

Figure 1:
Figure 1:
MRI diagnostic and management algorithm for lesions with spontaneous high signal on T1-weighted images.
Figure 2:
Figure 2:
MRI diagnostic algorithm for lesions with a liquid or pseudo-cystic high signal on T2-weighted images.
Figure 3:
Figure 3:
MRI diagnostic algorithm for low-signal lesions on T1-weighted and T2-weighted images.
Figure 4:
Figure 4:
A 32-year-old man with persistent pain in the left thigh 2 weeks after mild anterior trauma. US: Axial ultrasound image shows an anechoic collection with internal septa located in the vastus intermedius muscle (a). On MRI, the hematoma is well-defined, has a high-signal, and is surrounded by edema on fat-suppressed T2-weighted image (b), presents a low-signal deposit on gradient-echo T2-weighted image (c), and thin peripheral enhancement after injection of gadolinium chelates (d). A small post-traumatic lesion is also visible in the vastus lateralis muscle.
Figure 5:
Figure 5:
An 11-year-old girl with a popliteal fossa abscess consulting for pain and swelling with inflammatory syndrome. US: Axial ultrasound image of an abscess with hypoechoic and thick-walled, hyperechoic and heterogeneous content (a). MRI: On fat-saturated T1-weighted MRI image after injection of gadolinium chelates (b), the abscess, located between the semi-membranous and biceps muscles, has a low signal center, intense peripheral enhancement, and ill-defined peripheral enhancement due to perilesional edema.
Figure 6:
Figure 6:
A 22-year-old man with Morel-Lavallee syndrome who presented with left hip pain 4 weeks after a motorcycle accident. MRI: Collection with a low signal on T1-weighted (a) and high signal on T2-weighted (b) coronal images, between the hypodermic fat and the peripheral deep fascia of the left gluteus maximus muscle, typical of a Morel-Lavallee syndrome (arrows).
Figure 7:
Figure 7:
A 16-year-old girl presenting with increasing knee pain for 15 days and swelling. Natural evolution of a circumscribed myositis ossificans of the right thigh. MRI: Worrying pseudotumoral appearance on initial fat saturated proton density weighted axial MRI image (a). 7 months later on fat saturated T1-weighted axial image after injection (b), the size of the lesion and peri lesional infiltration decreased. The coronal CT reformat performed on the same day (c) shows ossification. Three years later, on fat saturated T1-weighted MRI image after injection (d), it has incorporated itself into the bone cortex.
Figure 8:
Figure 8:
A 53-year-old woman with bilateral elastofibromas below the scapular tip, undergoing MRI for bilateral scapulalgia. Typical laminated appearance on T1-weighted axial MRI image (arrows).
Figure 9:
Figure 9:
A 47-year-old woman with a conventional lipoma consulting for swelling of the right buttock. MRI: Lipoma of the right gluteus maximus muscle (arrow) showing a purely fatty signal on T1-weighted MRI image (a), low signal and no enhancement on fat saturated T1-weighted axial images after injection (b).
Figure 10:
Figure 10:
A 55-year-old man with liposarcoma consulting for swelling of the right thigh. MRI: T1-weighted (a) and fat saturated T2-weighted coronal MRI images (b). Fatty tumor of the right thigh whose signal is heterogeneous (arrows) and higher than that of subcutaneous fat (arrowhead). Biopsy confirmed the diagnosis of well-differentiated liposarcoma.
Figure 11:
Figure 11:
A 36-year-old woman with a hibernoma who presented with a subcutaneous mass of the left thigh. MRI appearance of a hibernoma of the posterior compartment of the left thigh on T1-weighted axial image (a), T2-weighted sagittal image (b), and fat saturated T1-weighted axial image after injection (c). The brown fat of the hibernoma (arrows) has a lower signal on T1-weighted and T2-weighted images than that of the subcutaneous fat. There are also large intra lesional vessels enhanced after injection (arrowhead).
Figure 12:
Figure 12:
A 66-year-old woman with intramuscular myxoma who presented with palpable swelling of the right deltoid muscle. MRI: High T2-weighted signal and septa (a). It presents weak internal enhancement, with enhancement of its pseudo-capsule on fat saturated T1-weighted axial images after injection (b).
Figure 13:
Figure 13:
A 42-year-old man with myxofibrosarcoma consulting for a painful mass in the right thigh. MRI: On fat saturated T2-weighted axial image (a), this fibrosarcoma is very heterogeneous due to fibrous, myxoid, and tissue content, and areas of hemorrhagic necrosis. Therefore, on fat saturated T1-weighted axial image after injection (b), enhancement is also heterogeneous.
Figure 14:
Figure 14:
A 30-year-old woman with a desmoid tumor who presented palpable swelling of the right leg. MRI: T1-weighted axial image (a), T2-weighted axial image (b), and fat saturated T1-weighted image after injection (c) of a desmoid tumor of the superficial posterior compartment of the right leg. It presents an intermediate signal with a central fibrous area (arrow) with low signal regardless of weighting. Although non-specific, its extension along the fascia (arrowheads), clearly visible after injection (c), is suggestive of the diagnosis.
Figure 15:
Figure 15:
A 38-year-old man with osteitis and abscess who presented for left forearm pain without fever. T1-weighted MR image (a), fat-suppressed T2-weighted image (b), fat-suppressed T1-weighted image after injection of gadolinium chelates (c) and diffusion weighted image (d) of radial osteitis: Cortical erosion of low T1-weighted signal and high diffusion-weighted signal of the medullary. Deep muscular abscess (short radial extensor of the carpus, short extensor, and long abductor of the thumb) have low T1-weighted signal (a), high T2-weighted signal (b), peripheral enhancement (c), and high diffusion-weighted signal (d). Bacteriological analysis found Staphylococcus aureus.
Figure 16:
Figure 16:
A 72-year-old man with dedifferentiated spindle cell sarcoma who presented for growing abdominal wall mass. Fat-suppressed T2-weighted MR image (a), fat-suppressed T1-weighted image after gadolinium chelate injection (b), diffusion-weighted image (c) and Apparent Diffusion Coefficient (d). Moderately high diffusion-weighted image with high ADC of the necrotic portion and low ADC of the tissue portion.

Similar articles

Cited by

References

    1. Laredo JD, Wybier M, Petrover D. Netherlands: Elsevier; 2016. Imagerie Rhumatologique et Orthopédique.
    1. Cotten A. Netherlands: Elsevier, Masson; 2013. Pseudo-Tumeurs des Tissus Mous, in Imagerie Musculosquelettique: Pathologies Générales.
    1. Taïeb S, Penel N, Vanseymortier L, Ceugnart L. Soft tissue sarcomas or intramuscular haematomas? Eur J Radiol. 2009;72:44–9. doi: 10.1016/j.ejrad.2009.05.026. - DOI - PubMed
    1. Chau CL, Griffith JF. Musculoskeletal infections: Ultrasound appearances. Clin Radiol. 2005;60:149–59. doi: 10.1016/j.crad.2004.02.005. - DOI - PubMed
    1. Costa FM, Ferreira EC, Vianna EM. Diffusion-weighted magnetic resonance imaging for the evaluation of musculoskeletal tumors. Magn Reson Imaging Clin N Am. 2011;19:159–80. doi: 10.1016/j.mric.2010.10.007. - DOI - PubMed

LinkOut - more resources