. 2021 Feb 24:24:140-153.
doi: 10.1016/j.omtn.2021.02.019. eCollection 2021 Jun 4.

CD46 splice variant enhances translation of specific mRNAs linked to an aggressive tumor cell phenotype in bladder cancer

Affiliations

CD46 splice variant enhances translation of specific mRNAs linked to an aggressive tumor cell phenotype in bladder cancer

Jin Zeng et al. Mol Ther Nucleic Acids. .

Abstract

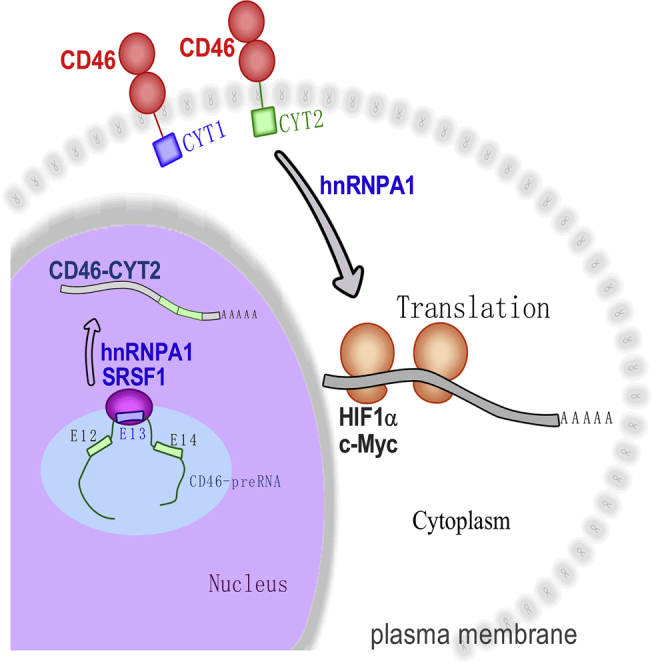
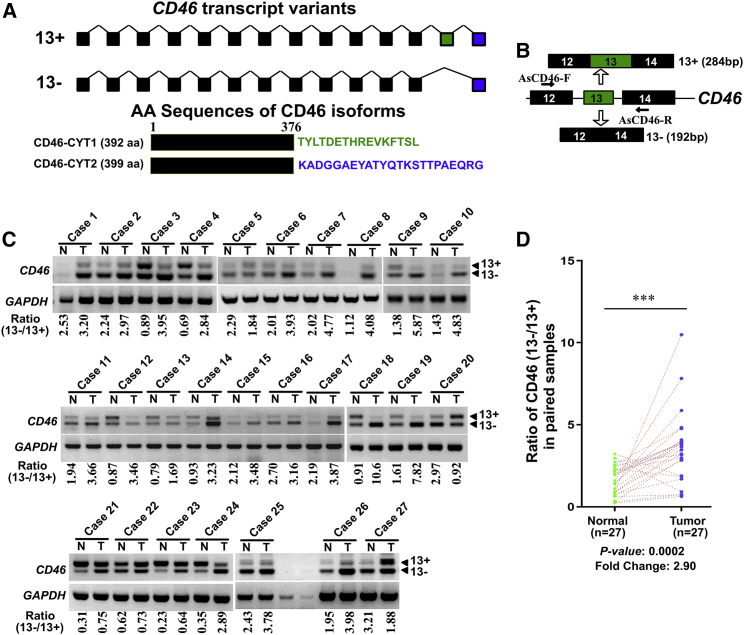
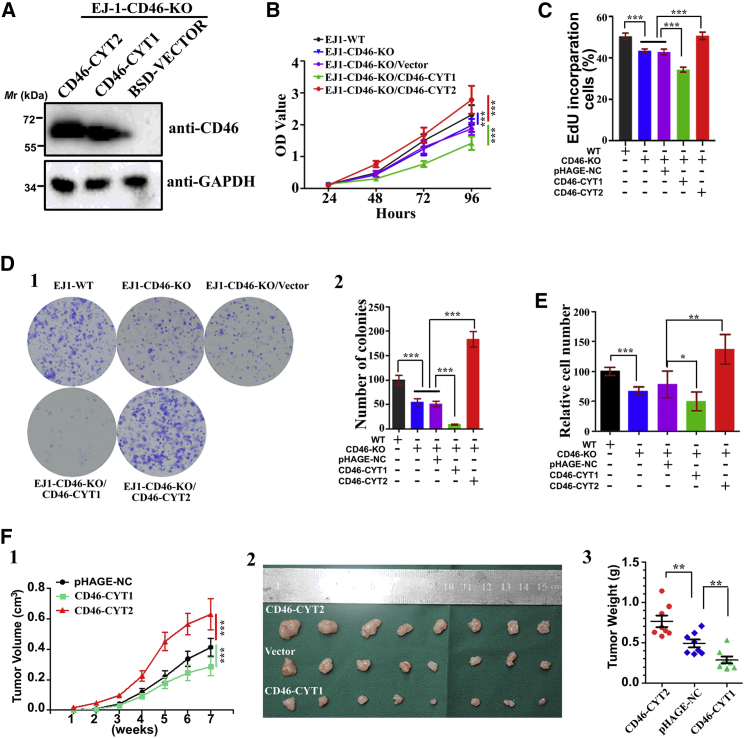
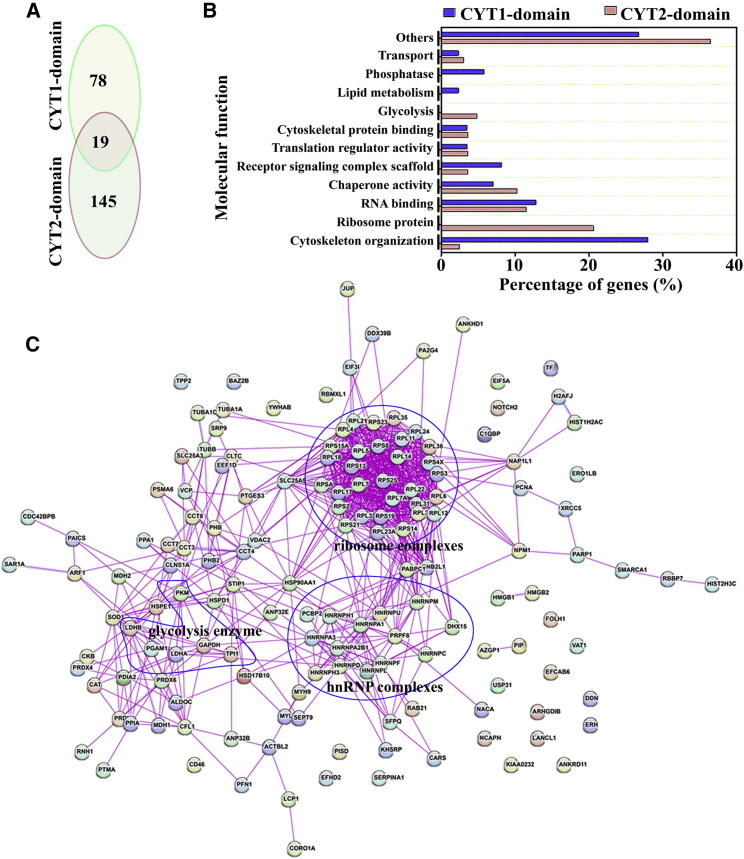
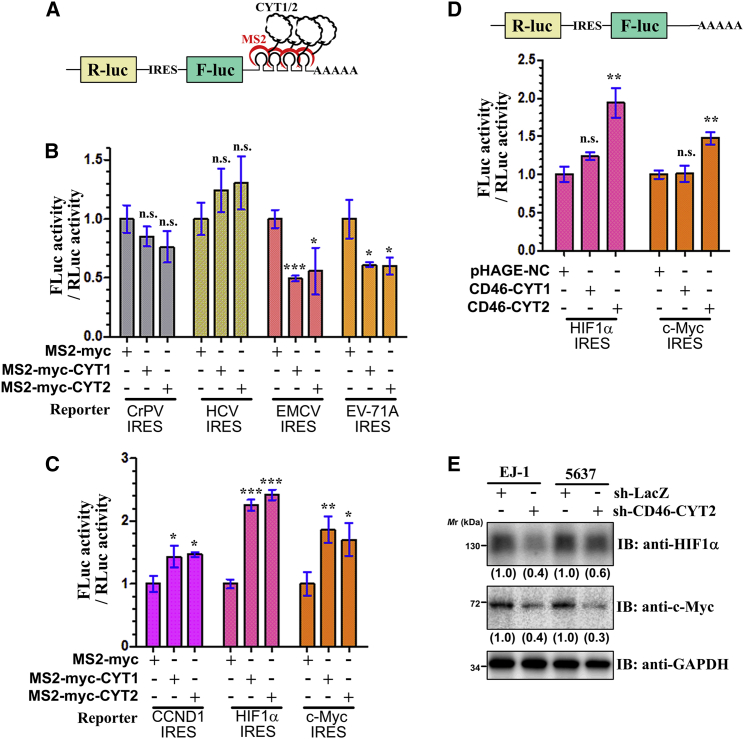
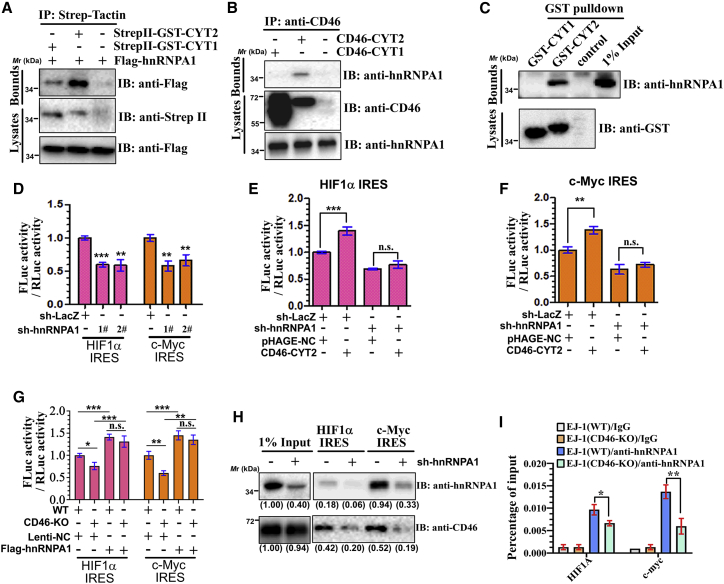
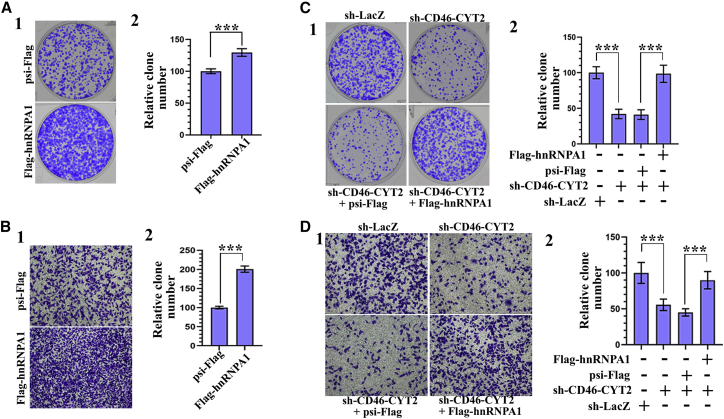
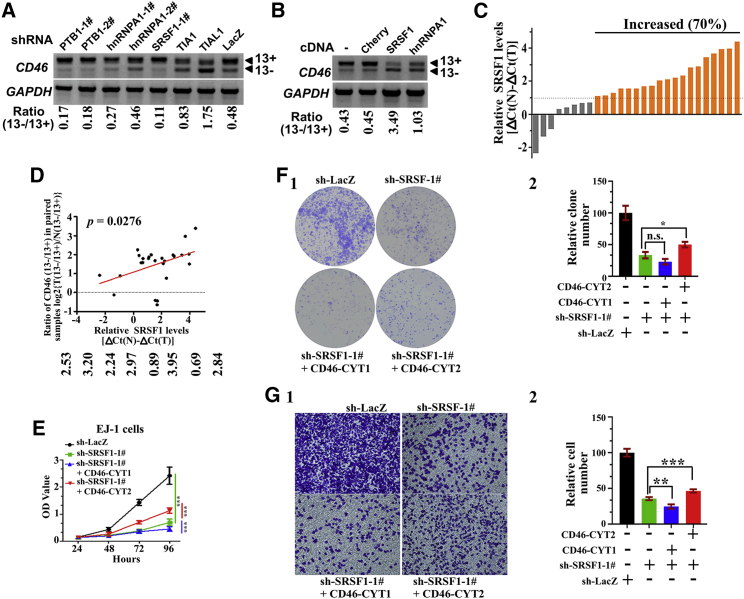
CD46 is well known to be involved in diverse biological processes. Although several splice variants of CD46 have been identified, little is known about the contribution of alternative splicing to its tumorigenic functions. In this study, we found that exclusion of CD46 exon 13 is significantly increased in bladder cancer (BCa) samples. In BCa cell lines, enforced expression of CD46-CYT2 (exon 13-skipping isoform) promoted, and CD46-CYT1 (exon 13-containing isoform) attenuated, cell growth, migration, and tumorigenicity in a xenograft model. We also applied interaction proteomics to identify exhaustively the complexes containing the CYT1 or CYT2 domain in EJ-1 cells. 320 proteins were identified that interact with the CYT1 and/or CYT2 domain, and most of them are new interactors. Using an internal ribosome entry site (IRES)-dependent reporter system, we established that CD46 could regulate mRNA translation through an interaction with the translation machinery. We also identified heterogeneous nuclear ribonucleoprotein (hnRNP)A1 as a novel CYT2 binding partner, and this interaction facilitates the interaction of hnRNPA1 with IRES RNA to promote IRES-dependent translation of HIF1a and c-Myc. Strikingly, the splicing factor SRSF1 is highly correlated with CD46 exon 13 exclusion in clinical BCa samples. Taken together, our findings contribute to understanding the role of CD46 in BCa development.

Keywords: CD46; bladder cancer; hnRNPA1; translation; tumorigenesis.


Conflict of interest statement

The authors declare no competing interests.

Figures

None
Graphical abstract
Figure 1
Figure 1
CD46 exon 13 skipping is upregulated in bladder cancers (A) Schematic representation of the CD46 exons structure to highlight the alternative splicing between exons 12 and 14 generating CD46-CYT1 and CD46-CYT2 variants. (B) Diagrams for detection of CD46-CYT1 and CD46-CYT2 mRNA. Primer pairs and product sizes for the two variants are shown. (C) Expression of CD46-CYT1 and CD46-CYT2 mRNA in 27 paired bladder cancer tissues (T) and adjacent nontumor tissues (N) by RT-PCR. GAPDH transcript level was used as the loading control. The ratio for 13−/13+ is listed below the panel. (D) Quantification of data from (C) for the exon 13 exclusion inclusion ratio. The data were analyzed by a paired Student’s t test. ∗∗∗p < 0.001.
Figure 2
Figure 2
CD46-CYT1 and CD46-CYT2 have opposite roles in bladder cancer development (A) Generation of CD46-knockout (CD46-KO) cells that were engineered to re-express CD46-CYT1 or CD46-CYT2. CD46-KO cells were infected with lentiviruses expressing vector control, CD46-CYT1, or CD46-CYT2. Immunoblotting was performed to evaluate the expression of CD46. GAPDH is an internal control. (B) A CCK-8 kit was utilized to quantify cell viability at each time point. The data represent mean ± SD and were analyzed by a two-way ANOVA (n = 3). ∗∗∗p < 0.001. (C) Quantification of 5-ethynyl-2′-deoxyuridine (EdU)-incorporated cells in indicated engineered cell lines. The data represent mean ± SD and were analyzed by an unpaired two-tailed Student’s t test (n = 4). ∗∗∗p < 0.001. (D) A colony formation assay and quantification were performed with EJ-1 cells and CD46-KO cells expressing CD46-CYT1 or CD46-CYT2 as described in (B). The data represent mean ± SD and were analyzed by an unpaired two-tailed Student’s t test (n = 3). ∗∗∗p < 0.001. (E) Transwell cell migration assay for EJ-1 cells. Numbers of migrated cells were quantified in four random images from each treatment group. The data represent mean ± SD and were analyzed by an unpaired two-tailed Student’s t test (n = 4). ∗p < 0.05, ∗∗p < 0.01, ∗∗∗p < 0.001. (F) (1) Time course of xenograft growth. Mean tumor volume was measured by caliper on the indicated weeks. The data represent mean ± SD and were analyzed by a two-way ANOVA (n = 8). ∗∗∗p < 0.001. (2) Photographs of tumors excised 7 weeks after the inoculation of stably transfected EJ-1 cells into nude mice. (3) The tumor weight of CD46-CYT1- or CD46-CYT2-overexpressed EJ-1 cells in nude mice at the end of 7 weeks after transplantation. The data represent mean ± SD and were analyzed by an unpaired two-tailed Student’s t test (n = 8). ∗∗p < 0.01.
Figure 3
Figure 3
Classification of identified CYT1 and CYT2 domain-interacting proteins (A) The number of CYT1- and CYT2-binding partners in the EJ-1 cells. (B) Function classification of the 320 proteins identified as CYT1 and/or CYT2 domain partners in the EJ-1 cell line. (C) Network analysis of associated proteins identified through liquid chromatography-tandem mass spectrometry (LC-MS/MS) of CYT2 domain-interacting proteins. Three main complexes (ribosome complexes, the glycolysis enzyme complex, and hnRNP complexes) are boxed.
Figure 4
Figure 4
The CYT1 and CYT2 domain of CD46 regulates protein translation (A) Schematics of the tethering reporter assay. (B) The tethering of CYT1 or CYT2 to the EMCV and EV-71A IRES reporters led to a decrease in translation in comparison with the control. The relative luciferase activity is shown of EJ-1 cells transfected with MS2-myc (control), MS2-myc-CYT1, or MS2-myc-CYT2 with the indicated tethering reporter plasmids. (C) The tethering of CYT1 or CYT2 to CCND1, HIF1a, or c-Myc IRES led to an increase in translation. The relative luciferase activity is shown of EJ-1 cells transfected with MS2-myc (control), MS2-myc-CYT1, or MS2-myc-CYT2 with the indicated tethering reporter. (D) CD46-CYT2 promotes the IRES-dependent translation of HIF1a and c-Myc. Top: schematic representation of bicistronic reporter constructs with different IRESs. Bottom: EJ-1 cells were transfected with the indicated plasmids. The firefly and Renilla luciferase activities were measured, and the ratios of firefly luciferase activity over Renilla luciferase activity were calculated. (E) EJ-1 and 5637 cells transfected with sh-CD46-CYT2 or sh-LacZ were cultured in Met-free DMEM for 1 h in the presence of AHA to capture newly synthesized proteins and immunoblotted using the indicated antibodies. Levels of HIF1a and c-Myc are normalized against GAPDH and expressed as fold change relative to base expression determined using control shRNA. All data represent mean ± SD and were analyzed by an unpaired two-tailed Student’s t test (n = 3). ∗p < 0.05 versus control; ∗∗p < 0.01, ∗∗∗p < 0.001. n.s., not significant.
Figure 5
Figure 5
CD46-CYT2 regulates IRES-dependent translation via hnRNPA1 (A) EJ-1 cells were transiently transfected with StrepII-GST-CYT1/2 and/or FLAG-hnRNPA1. The cell lysates were precipitated with StrepII-Tactin and immunoblotted with an anti-FLAG antibody. (B) Co-immunoprecipitation experiments were conducted with an CD46 antibody in CD46-KO cells stably expressing CD46-CYT1 or CD46-CYT2, respectively. (C) Lysates from 293T cells transfected with FLAG-hnRNPA1 were incubated with either purified protein GST-CYT1 or GST-CYT2. Bound FLAG-hnRNPA1 proteins were immunoblotted by anti-FLAG. (D) EJ-1 cells expressing sh-LacZ or sh-hnRNPA1 were transfected with indicated IRES-dependent reporters, respectively. The firefly and Renilla luciferase activities were measured. (E and F) EJ-1 cells expressing sh-LacZ or sh-hnRNPA1 were transfected with CD46-CYT2 or pHAGE-negative control (NC) (control/empty vector) and the indicated IRES-dependent reporter plasmids. The firefly and Renilla luciferase activities were measured. (G) Relative luciferase activity of wild-type (WT) or CD46-KO EJ-1 cells transfected with Lenti-NC (control) or FLAG-hnRNPA1 with the indicated tethering reporter. (H) CD46-KO cells stably expressing CD46-CYT2, MS2-GST together with sh-LacZ, or sh-hnRNPA1 were transfected with the 3′ MS2 stem-loop-tagged IRES sequence of HIF1a or c-Myc. After 48 h of culture, cells were lysed and incubated overnight with glutathione Sepharose beads. Precipitates were subjected to western blotting with anti-hnRNPA1 or anti-CD46 antibodies. Levels of hnRNPA1 and CD46 are normalized against input and expressed as fold change relative to base expression determined using control sh-LacZ. (I) Cell lysates from WT or CD46-KO cells were incubated with IgG or anti-hnRNPA1 antibody and immunoprecipitated with protein A/G-conjugated beads. Bound RNAs were then eluted, purified, and subjected to qPCR for CCND1 and c-Myc mRNAs.
Figure 6
Figure 6
CD46-CYT2 regulates human bladder cancer cell migration via hnRNPA1 (A) (1) Representative images of cell culture plates following staining for colony formation of EJ-1 cells expressing FLAG-hnRNPA1 or control plasmid psi-FLAG. (2) Number of colonies was quantified. (B) Migration assay for bladder cancer cells. The number of migrated cells was quantified in five random images from each treatment group. The data represent mean ± SD and were analyzed by an unpaired two-tailed Student’s t test (n = 5). ∗∗∗p < 0.001 versus control. (C and D) EJ-1 cells were infected with different combinations of lentivirus encoding sh-LacZ, sh-CD46-CYT2, psi-FLAG, and/or FLAG-hnRNPA1 as indicated. After 72 h of culture, a colony formation assay and transwell migration assay were performed. ∗∗∗p < 0.001 versus control.
Figure 7
Figure 7
SRSF1 promotes bladder cancer tumorigenesis in part via regulating CD46-CYT2 levels (A) EJ-1 cells were infected with lentivirus expressing several indicated shRNAs to establish stably expressing cell lines. Semiquantitative RT-PCR analysis was performed to detect the CD46 exon 13 alternative splicing. The ratio for 13−/13+ is listed below the panel. (B) CD46 exon 13 splicing was measured by RT-PCR in EJ-1 cells stably expressing FLAG-Cherry, FLAG-SRSF1, or FLAG-hnRNPA1. (C) Relative expression of SRSF1 mRNA expression levels were evaluated by real-time PCR in 27 paired case specimens. Expression levels of SRSF1 were normalized to that of GAPDH. A bar value <1 indicates that SRSF1 is decreased in tumors. A bar value >1 indicates that SRSF10 is increased in tumors. (D) The positive correlation between the CD46 13−/13+ ratio and expression levels of SRSF1 was observed in bladder cancer samples. Relationships between these two variables were determined by Pearson’s correlation coefficients. The correlation was analyzed using GraphPad Prism 5 software. (E) A CCK-8 assay was utilized to quantify cell viability at each time point. Data are plotted as the mean ± SD of three independent experiments and were analyzed by two-way ANOVA. ∗∗∗p < 0.001. (F) (1) Representative images of cell culture plates following staining for colony formation of the indicated cell lines. (2) The number of colonies was quantified. The data represent mean ± SD and were analyzed by an unpaired two-tailed Student’s t test (n = 3). ∗p < 0.05. n.s., not significant. (G) (1) Migration assay for the indicated cell lines. (2) Number of migrated cells was quantified in five random images from each treatment group. The data represent mean ± SD and were analyzed by an unpaired two-tailed Student’s t test (n = 5). ∗∗p < 0.01, ∗∗∗p < 0.001.

Similar articles

Cited by

References

    1. Sveen A., Kilpinen S., Ruusulehto A., Lothe R.A., Skotheim R.I. Aberrant RNA splicing in cancer; expression changes and driver mutations of splicing factor genes. Oncogene. 2016;35:2413–2427. - PubMed
    1. Climente-González H., Porta-Pardo E., Godzik A., Eyras E. The functional impact of alternative splicing in cancer. Cell Rep. 2017;20:2215–2226. - PubMed
    1. Siegfried Z., Karni R. The role of alternative splicing in cancer drug resistance. Curr. Opin. Genet. Dev. 2018;48:16–21. - PubMed
    1. Jayasinghe R.G., Cao S., Gao Q., Wendl M.C., Vo N.S., Reynolds S.M., Zhao Y., Climente-González H., Chai S., Wang F., Cancer Genome Atlas Research Network Systematic analysis of splice-site-creating mutations in cancer. Cell Rep. 2018;23:270–281.e3. - PMC - PubMed
    1. Yamamoto H., Fara A.F., Dasgupta P., Kemper C. CD46: the “multitasker” of complement proteins. Int. J. Biochem. Cell Biol. 2013;45:2808–2820. - PubMed

LinkOut - more resources