

lncRNA FDNCR promotes apoptosis of granulosa cells by targeting the miR-543-3p/DCN/TGF-β signaling pathway in Hu sheep
- PMID: 33767918
- PMCID: PMC7973142
- DOI: 10.1016/j.omtn.2021.02.030
lncRNA FDNCR promotes apoptosis of granulosa cells by targeting the miR-543-3p/DCN/TGF-β signaling pathway in Hu sheep
Abstract
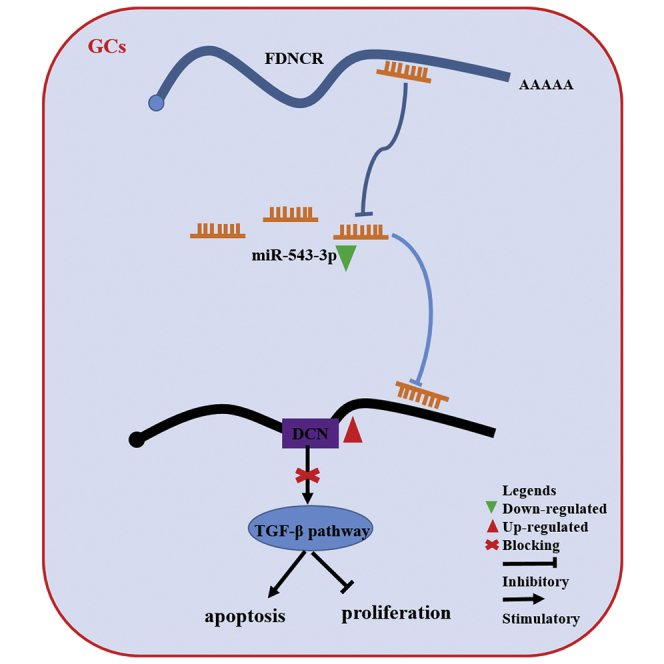
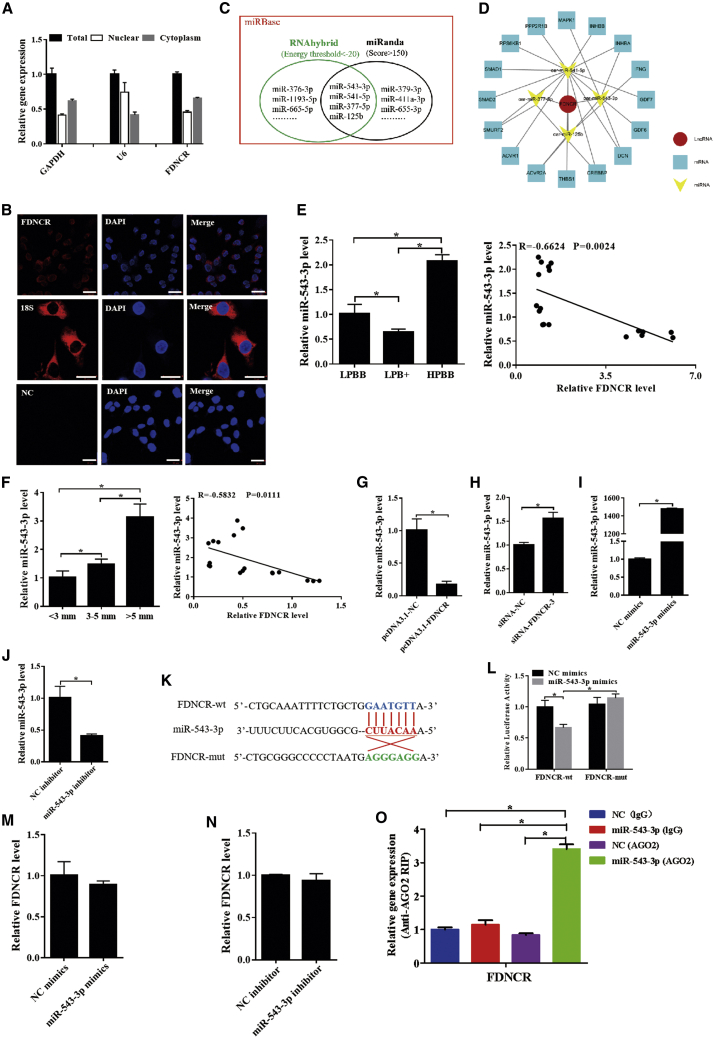
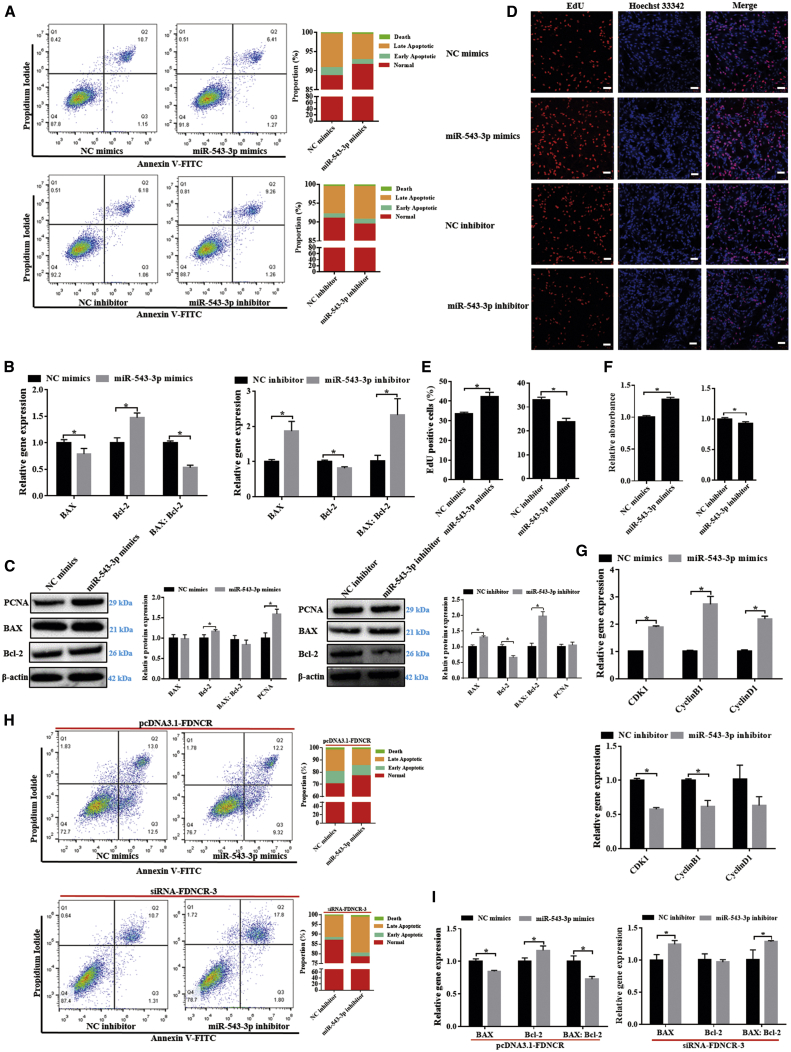
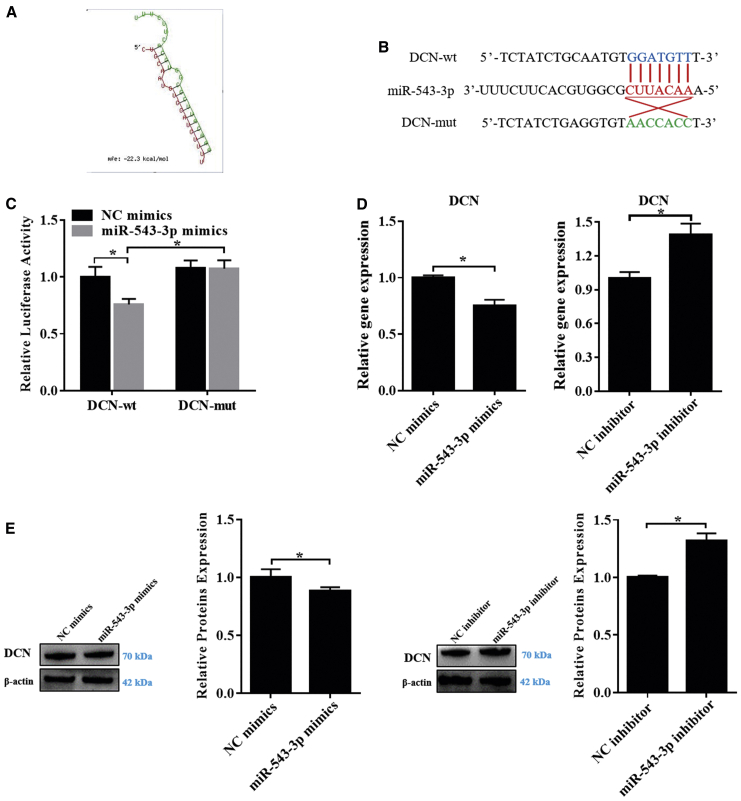
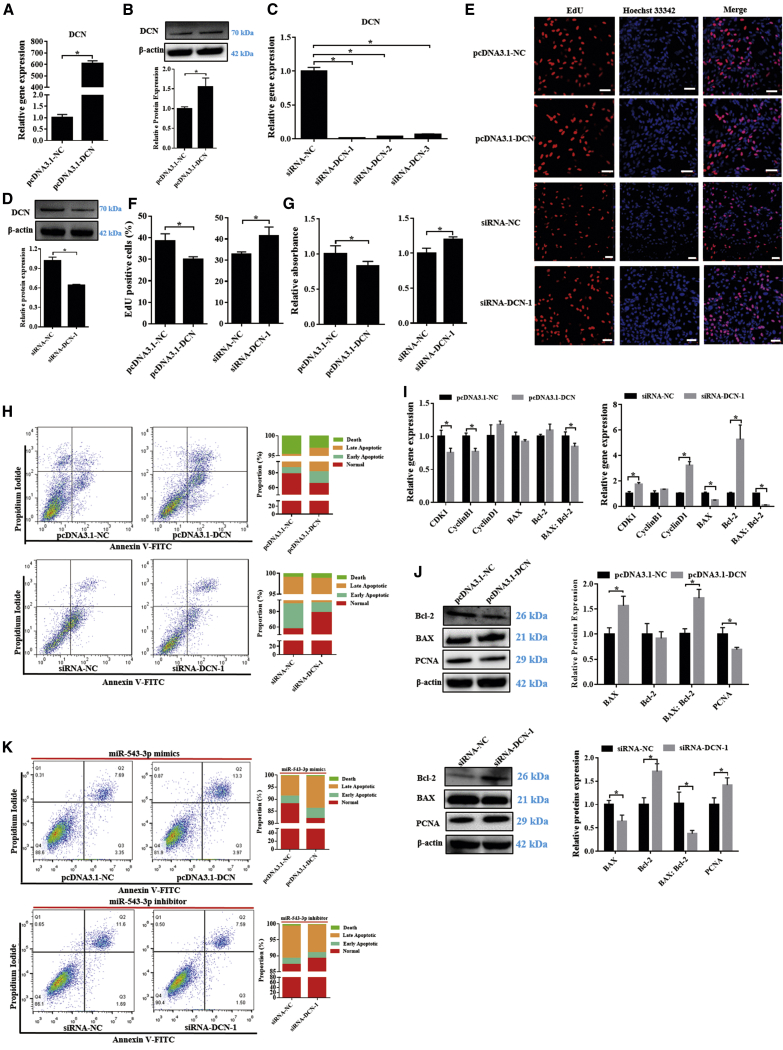
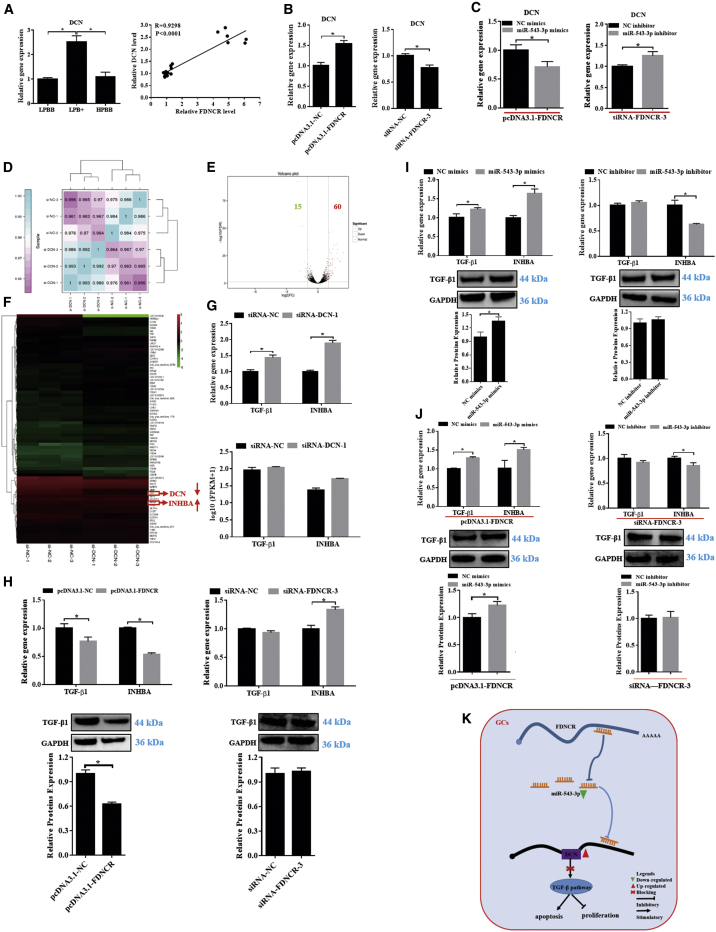
Long non-coding RNAs (lncRNAs) regulate the development of follicles and reproductive diseases, but the mechanisms by which lncRNAs regulate ovarian functions and fertility remain elusive. We profiled the expression of lncRNAs in ovarian tissues of Hu sheep with different prolificacy and identified 21,327 lncRNAs. Many of the lncRNAs were differentially expressed in different groups. We further characterized an lncRNA that was predominantly expressed in the ovaries of the low prolificacy FecB+ (LPB+) group and mainly present in granulosa cells (GCs), and the expression of this lncRNA decreased during follicular development, which we named follicular development-associated lncRNA (FDNCR). Next, we found that FDNCR directly binds miR-543-3p, and decorin (DCN) was identified as a target of miR-543-3p. FDNCR overexpression promoted GC apoptosis through increased expression of DCN, which could be attenuated by miR-543-3p. Furthermore, miR-543-3p increased and FDNCR reduced the expression of transforming growth factor-β (TGF-β) pathway-related genes, including TGF-β1 and inhibin beta A (INHBA), which were upregulated upon DCN silencing. Our results demonstrated that FDNCR sponges miR-543-3p in GCs and prevents miR-543-3p from binding to the DCN 3' UTR, resulting in DCN transactivation and TGF-β pathway inhibition and promotion of GC apoptosis in Hu sheep. These findings provide insights into the mechanisms underlying prolificacy in sheep.
Keywords: FDNCR; Hu sheep; apoptosis; granulosa cells; miR-543-3p.
© 2021 The Author(s).
Conflict of interest statement
The authors declare no competing interests.
Figures
Similar articles
-
LncRNA-412.25 activates the LIF/STAT3 signaling pathway in ovarian granulosa cells of Hu sheep by sponging miR-346.FASEB J. 2022 Sep;36(9):e22467. doi: 10.1096/fj.202200632R. FASEB J. 2022. PMID: 35929417
-
miR-134-3p Regulates Cell Proliferation and Apoptosis by Targeting INHBA via Inhibiting the TGF-β/PI3K/AKT Pathway in Sheep Granulosa Cells.Biology (Basel). 2024 Dec 30;14(1):24. doi: 10.3390/biology14010024. Biology (Basel). 2024. PMID: 39857255 Free PMC article.
-
Genome-wide differential expression profiling of mRNAs and lncRNAs associated with prolificacy in Hu sheep.Biosci Rep. 2018 Apr 27;38(2):BSR20171350. doi: 10.1042/BSR20171350. Print 2018 Apr 27. Biosci Rep. 2018. PMID: 29439142 Free PMC article.
-
Effects of miR-101-3p on goat granulosa cells in vitro and ovarian development in vivo via STC1.J Anim Sci Biotechnol. 2020 Oct 14;11:102. doi: 10.1186/s40104-020-00506-6. eCollection 2020. J Anim Sci Biotechnol. 2020. PMID: 33072314 Free PMC article. Review.
-
Roles of TGF‑β signalling pathway‑related lncRNAs in cancer (Review).Oncol Lett. 2023 Feb 2;25(3):107. doi: 10.3892/ol.2023.13693. eCollection 2023 Mar. Oncol Lett. 2023. PMID: 36817052 Free PMC article. Review.
Cited by
-
TGF-β1 regulates the lncRNA transcriptome of ovarian granulosa cells in a transcription activity-dependent manner.Cell Prolif. 2023 Jan;56(1):e13336. doi: 10.1111/cpr.13336. Epub 2022 Sep 20. Cell Prolif. 2023. PMID: 36125095 Free PMC article.
-
LncGSAR Controls Ovarian Granulosa Cell Steroidogenesis via Sponging MiR-125b to Activate SCAP/SREBP Pathway.Int J Mol Sci. 2022 Oct 12;23(20):12132. doi: 10.3390/ijms232012132. Int J Mol Sci. 2022. PMID: 36293007 Free PMC article.
-
Epigenetic Regulation of miR-25 and Lnc107153 on Expression of Seasonal Estrus Key Gene CHGA in Sheep.Biology (Basel). 2023 Feb 4;12(2):250. doi: 10.3390/biology12020250. Biology (Basel). 2023. PMID: 36829527 Free PMC article.
-
SDNOR, a Novel Antioxidative lncRNA, Is Essential for Maintaining the Normal State and Function of Porcine Follicular Granulosa Cells.Antioxidants (Basel). 2023 Mar 24;12(4):799. doi: 10.3390/antiox12040799. Antioxidants (Basel). 2023. PMID: 37107173 Free PMC article.
-
CREB1 Is Involved in miR-134-5p-Mediated Endometrial Stromal Cell Proliferation, Apoptosis, and Autophagy.Cells. 2023 Oct 31;12(21):2554. doi: 10.3390/cells12212554. Cells. 2023. PMID: 37947633 Free PMC article.
References
-
- Yue G.H. Reproductive characteristics of Chinese Hu sheep. Anim. Reprod. Sci. 1996;44:223–230.
-
- McGee E.A., Hsueh A.J.W. Initial and cyclic recruitment of ovarian follicles. Endocr. Rev. 2000;21:200–214. - PubMed
-
- Chu M.X., Liu Z.H., Jiao C.L., He Y.Q., Fang L., Ye S.C., Chen G.H., Wang J.Y. Mutations in BMPR-IB and BMP-15 genes are associated with litter size in Small Tailed Han sheep (Ovis aries) J. Anim. Sci. 2007;85:598–603. - PubMed
-
- Gootwine E., Reicher S., Rozov A. Prolificacy and lamb survival at birth in Awassi and Assaf sheep carrying the FecB (Booroola) mutation. Anim. Reprod. Sci. 2008;108:402–411. - PubMed
LinkOut - more resources
Full Text Sources
Other Literature Sources
Miscellaneous
