Review
. 2021 Mar 9:9:635102.
doi: 10.3389/fcell.2021.635102. eCollection 2021.

Insights Into Leukocyte Trafficking in Inflammatory Arthritis - Imaging the Joint

Affiliations
Review

Insights Into Leukocyte Trafficking in Inflammatory Arthritis - Imaging the Joint

Julia E Manning et al. Front Cell Dev Biol. .

Abstract

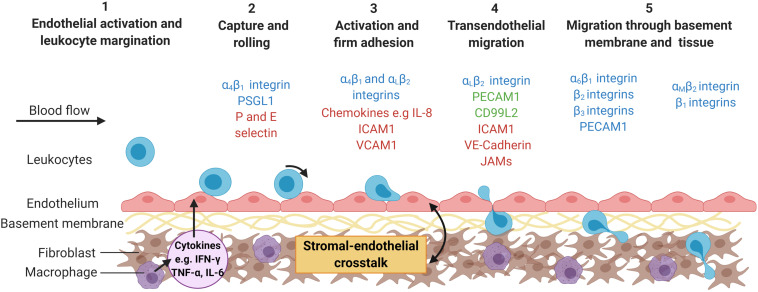
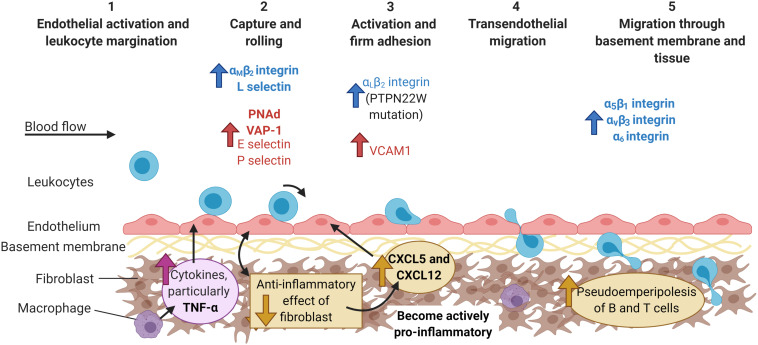
The inappropriate accumulation and activation of leukocytes is a shared pathological feature of immune-mediated inflammatory diseases (IMIDs), such as rheumatoid arthritis (RA) and psoriatic arthritis (PsA). Cellular accumulation is therefore an attractive target for therapeutic intervention. However, attempts to modulate leukocyte entry and exit from the joint have proven unsuccessful to date, indicating that gaps in our knowledge remain. Technological advancements are now allowing real-time tracking of leukocyte movement through arthritic joints or in vitro joint constructs. Coupling this technology with improvements in analyzing the cellular composition, location and interactions of leukocytes with neighboring cells has increased our understanding of the temporal dynamics and molecular mechanisms underpinning pathological accumulation of leukocytes in arthritic joints. In this review, we explore our current understanding of the mechanisms leading to inappropriate leukocyte trafficking in inflammatory arthritis, and how these evolve with disease progression. Moreover, we highlight the advances in imaging of human and murine joints, along with multi-cellular ex vivo joint constructs that have led to our current knowledge base.

Keywords: adhesion; arthritis; imaging; leukocyte; migration.


Conflict of interest statement

JM’s Ph.D. studentship was partially funded by Novartis. The remaining authors declare that the research was conducted in the absence of any commercial or financial relationships that could be construed as a potential conflict of interest.

Figures

FIGURE 1
FIGURE 1
The multi-step leukocyte adhesion cascade. Infection or tissue damage causes the localized release of danger signals, including cytokines, which (1) activate the endothelium causing the expression of capture receptors (P- or E-selectins), adhesion molecules (IgSF members – ICAM-1; VCAM-1) and presentation of chemokines or lipids on their surface (2) (Zhang et al., 2011). Marginated leukocytes are captured, roll along the endothelial surface until (3) they receive an activation signal (typically chemokine mediated) resulting in inside-out signaling and integrin activation (αLβ2-integrin; α4β1-integrin) (Ley et al., 2007). This allows for stabilization of the adhesive interactions (αLβ2-ICAM-1 and α4β1-VCAM-1 interactions) and cytoskeletal rearrangement in the leukocyte allowing (4) them to crawl over the endothelium, migrate across the endothelium (ICAM-1; JAM-1; CD31; VE-cadherin) and into the subendothelial space (Ley et al., 2007), (5) where they encounter the basement membrane and stromal compartment. This process is tightly regulated by the haemodynamic forces of the flowing blood and the stromal derived signals experienced by the endothelium (McGettrick et al., 2012). Some of the major molecules involved in this process are represented in the schematic, with molecules colored according to cell type expressing them; leukocytes = blue; endothelial cells (ECs) = red and expressed by both leukocytes and ECs = green. ICAM-1, Intracellular adhesion protein 1; IL-8, interleukin-8; JAM, junctional adhesion molecule; PECAM-1, platelet endothelial cell adhesion molecule 1; PSGL1, P-selectin glycoprotein ligand-1; VE-cadherin, vascular endothelial cadherin; VCAM-1, vascular adhesion protein 1. Created with BioRender.com.
FIGURE 2
FIGURE 2
Methodologies for imaging leukocyte infiltration. (A) H&E staining (Tucker et al., 2016): decalcified joints are paraffin embedded, sectioned, and stained with H&E to identify leukocyte infiltration. (B) Immuno-fluorescence (Honvo-Houéto and Truchet, 2015; JoVE, 2021): tissue sections are stained with fluorescently tagged antibodies against specific proteins to visualize cellular localization using a fluorescent microscope. Representative image shows a lymph node stained for CD3+ (Red), CD4+ (Blue), and FoxP3+ (Green) T-cells. In (A,B), images courtesy of Miss Jenefa Begum (University of Birmingham). (C) In Situ Hybridization (Menon et al., 2017): an RNA-specific target probe is added to tissue sections, where it hybridizes to its corresponding gene. Amplification probes are added to enhance the detection, which are bound by detection probes. Detection probes can either be fluorescent-, antibody- or radio- labeled. Image of arthritic joint replacement tissue section stained for PDGFRβ (Red), nuclei (Pale Blue), and CD90 (Brown), courtesy of Dr. Triin Major (University of Birmingham). (D) Stamper–Woodruff assay (Hirata et al., 2004): leukocytes are added to frozen tissue sections on slides and rotated for 30 min. Non-adherent cells are washed off and the section stained with nuclear dye and/or antibodies of choice. Image courtesy of Dr. Patricia Lalor and Dr. Sarah Edwards (University of Birmingham, Edwards et al., 2006). (E,F) Static and flow based adhesion assays (Butler et al., 2009): Endothelial cells or the ligand of interest are seeded onto the well, a filter or onto a collagen gel and treated with stimulant(s) of choice (e.g., TNF-α) for the desired amount of time. Stromal cells can be cultured beneath the endothelium to assess how they regulate endothelial recruitment of leukocytes (Munir et al., 2015; Mcgettrick et al., 2017). (E) Leukocytes are added to the well and left to adhere under static conditions, before non-adherent cells washed off and remaining adherent cells imaged via phase contrast microscopy. Image courtesy of Miss Sophie Hopkin (University of Birmingham). (F) Leukocytes are perfused across the surface (e.g., endothelial cells or purified protein/carbohydrate) at a wall shear rate determined by the flow rate of a syringe pump. In (E,F), adherent cells appear circular and phase bright, as they become activated and migrate they change morphology and appear phase dark once underneath the endothelial monolayer. (G) Organ-on-a-chip (Rothbauer et al., 2020): a micro-scale system to mimic the environment within the human body, combining cultured cells and microfluidic systems – where leukocytes are perfused through a channel coated with endothelial cells, with pericytes and stromal cells cultured on the opposite (basal) side to the endothelial cell. (H) PET imaging (White et al., 2017; Momcilovic et al., 2018): cells are tagged using a radioactive tracer that emits a small quantity of Gamma rays. Tagged cells are injected into participants and the location of cells can be tracked and imaged. (I) Two photon microscopy (Chen et al., 2017; Cai et al., 2019): fluorescently labeled cells are visualized and their movement tracked in real-time with two-photon microscope either in vivo and ex vivo. Image of human liver tissue perfused with wheat germ agglutinin and Hoechst and imaged ex vivo, courtesy of Dr. Scott P. Davies (University of Birmingham). (J) Bioluminescence (Lim et al., 2009): cell specific luciferase knock-in lines are visualized using the whole animal in vivo imaging system (IVIS), allowing the tracking of endogenous or injected cells. Image shows 1,1′-dioctadecyltetramethyl indotricarbocyanine Iodide tagged bone marrow mesenchymal stem cells accumulation following injection into wildtype mice; courtesy of Dr. Lozan Sheriff (University of Birmingham). (K) Kaede mice (Porter et al., 2018; Steele et al., 2019): UV light illumination of tissues (e.g., draining lymph nodes) in situ photoconverts cells from green to red fluorescence. The movement of red fluorescent cells to, and their interaction with cells at, distant tissues can be tracked. In (A–F,I), arrows denote leukocytes on the representative images. Created with BioRender.com.
FIGURE 3
FIGURE 3
The multi-step adhesion cascade in chronically inflamed joints. The etiology of most inflammatory arthritides remains unknown. At some point during the initial phases of disease, the endothelial cells up-regulate the expression of the typical adhesion molecules (E and P selectin, VCAM), as well as other molecules usually found in HEV venules (PNAd) or the gut (VAP-1). Furthermore, fibroblasts switch from homeostatically anti-inflammatory, to actively pro-inflammatory with the production of chemokines (CXCL5 and CXCL12) that are shuttled to the endothelium. Leukocytes from arthritic patients exhibit higher expression of integrins, such as αLβ2-, αMβ2-, and α6-, and are recruited to the endothelium via P-selectin (neutrophils) and α4β1-integrin-VCAM-1 interactions (lymphocytes). Increased expression of α5β1, αvβ3, and α6 integrins on leukocytes aids their migration through the basement membrane and tissue, whilst fibroblast interactions with T and B cells increases pseudoemperipolesis. Molecules are colored according to cell type: leukocytes = blue and endothelial cells = red, and highlighted bold to denote major contributors to infiltration during inflammatory arthritis, but not in response to infection or damage. PNAd, peripheral node addressin; VAP-1, vascular adhesion protein 1; VCAM-1, vascular adhesion protein 1. Created with BioRender.com.

References

    1. Abbot S. E., Whish W. J. D., Jennison C., Blake D. R., Stevens C. R. (1999). Tumour necrosis factor α stimulated rheumatoid synovial microvascular endothelial cells exhibit increased shear rate dependent leucocyte adhesion in vitro. Ann. Rheum. Dis. 58 573–581. 10.1136/ard.58.9.573 - DOI - PMC - PubMed
    1. Aletaha D. (2020). Precision medicine and management of rheumatoid arthritis. J. Autoimmun. 110:102405. 10.1016/j.jaut.2020.102405 - DOI - PubMed
    1. Alivernini S., Tolusso B., Petricca L., Bui L., Di Sante G., Peluso G., et al. (2017). Synovial features of patients with rheumatoid arthritis and psoriatic arthritis in clinical and ultrasound remission differ under anti-TNF therapy: a clue to interpret different chances of relapse after clinical remission? Ann. Rheum. Dis. 76 1228–12396. 10.1136/annrheumdis-2016-210424 - DOI - PMC - PubMed
    1. Angyal A., Egelston C., Kobezda T., Olasz K., László A., Glant T. T., et al. (2010). Development of proteoglycan-induced arthritis depends on T cell-supported autoantibody production, but does not involve significant influx of T cells into the joints. Arthritis Res. Ther. 12:R44. - PMC - PubMed
    1. Baeten D., De Keyser F., Demetter P., Cuvelier C., Van den Bosch F., Kruithof E., et al. (2000). Comparative study of the synovial histology in rheumatoid arthritis, spondyloarthropathy, and osteoarthritis: influence of disease duration and activity. Ann. Rheum. Dis. 59 945–953. 10.1136/ard.59.12.945 - DOI - PMC - PubMed