. 2021 Mar 9:9:644667.
doi: 10.3389/fcell.2021.644667. eCollection 2021.

Activation of AMPK Promotes Maturation of Cardiomyocytes Derived From Human Induced Pluripotent Stem Cells

Affiliations

Activation of AMPK Promotes Maturation of Cardiomyocytes Derived From Human Induced Pluripotent Stem Cells

Liang Ye et al. Front Cell Dev Biol. .

Abstract

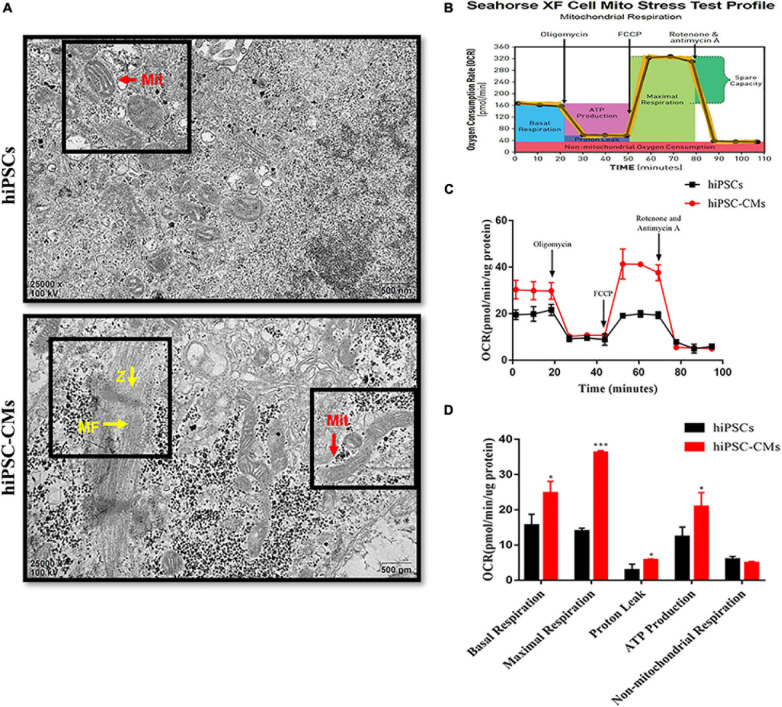
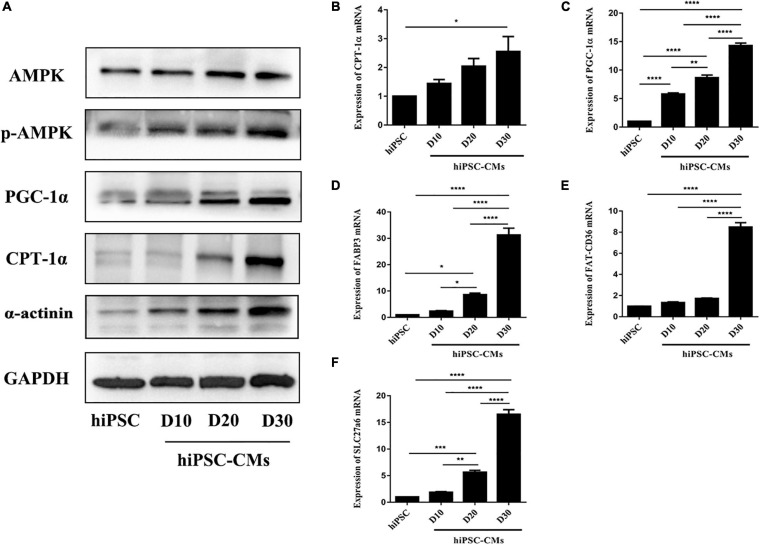
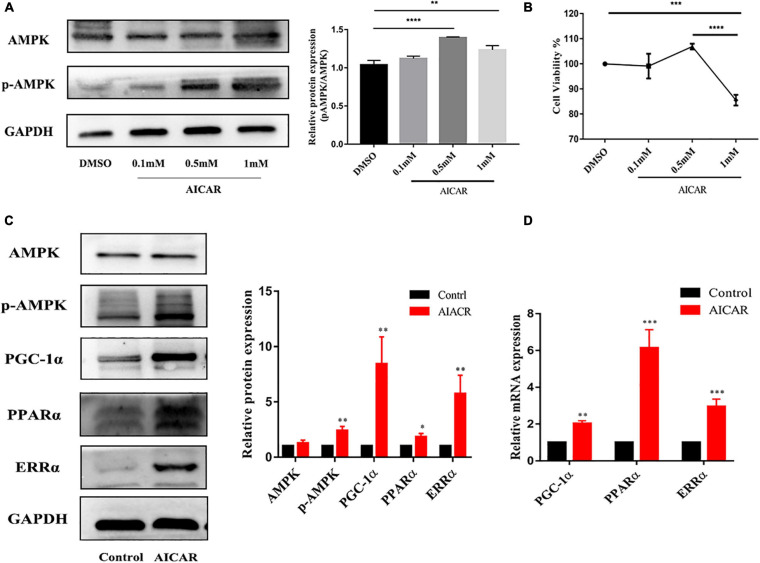
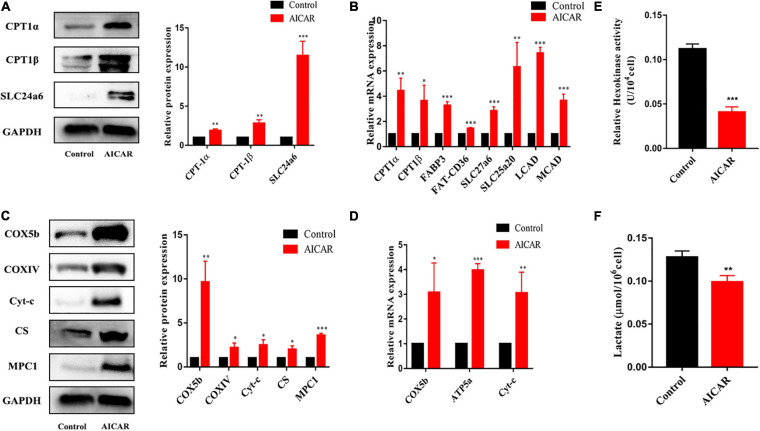
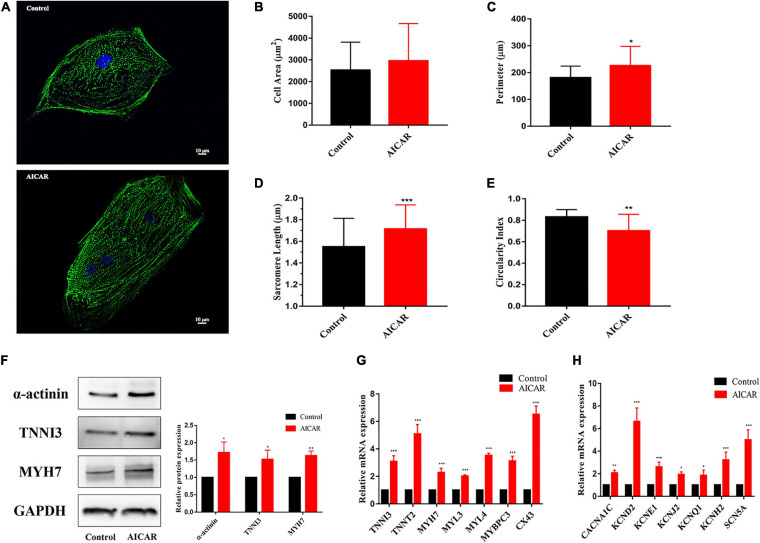
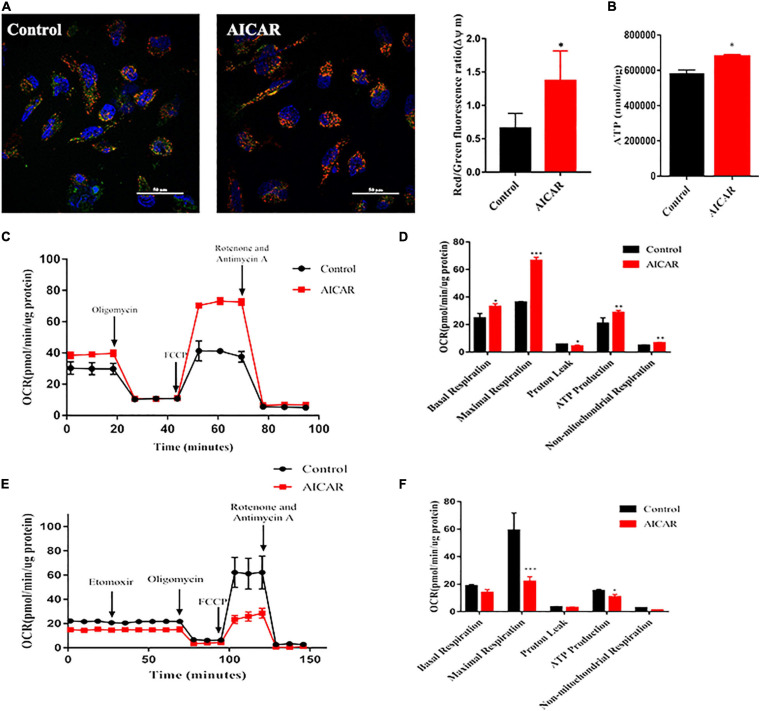
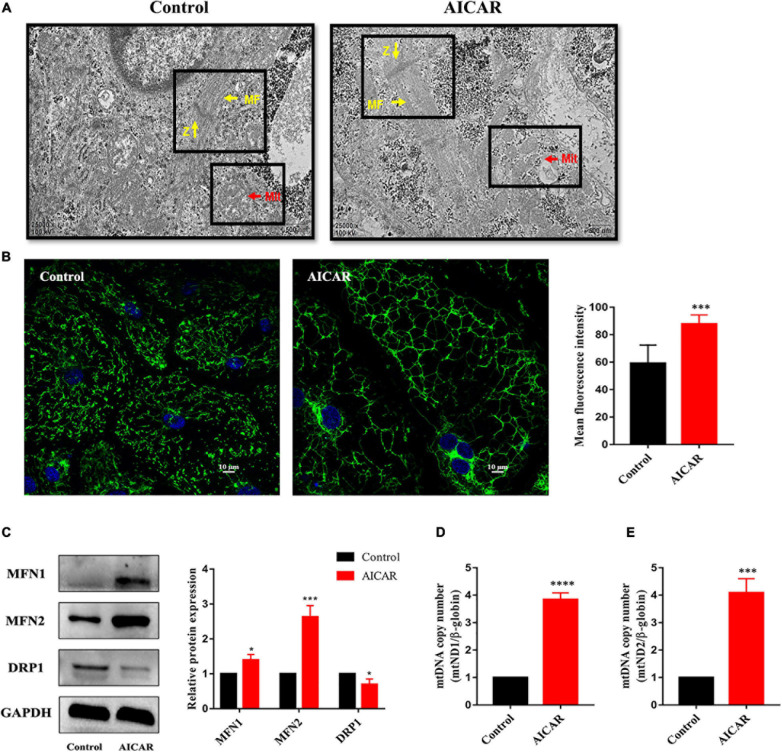
Human induced pluripotent stem cell (iPSC)-derived cardiomyocytes (CMs) (hiPSC-CMs) are a promising cell source for disease modeling, myocardial regeneration, and drug assessment. However, hiPSC-CMs have certain immature fetal CM-like properties that are different from the characteristics of adult CMs in several aspects, including cellular structure, mitochondrial function, and metabolism, thus limiting their applications. Adenosine 5'-monophosphate (AMP)-activated protein kinase (AMPK) is an energy-sensing protein kinase involved in the regulation of fatty acid oxidation and mitochondrial biogenesis in cardiomyocytes. This study investigated the effects of AMPK on the maturation of hiPSC-CMs. Activation of AMPK in hiPSC-CMs significantly increased the expression of CM-specific markers and resulted in a more mature myocardial structure compared to that in the control cells. We found that activation of AMPK improved mitochondrial oxidative phosphorylation (OxPhos) and the oxygen consumption rate (OCR). Additionally, our data demonstrated that activation of AMPK increased mitochondrial fusion to promote the maturation of mitochondrial structure and function. Overall, activation of AMPK is an effective approach to promote hiPSC-CMs maturation, which may enhance the utility of hiPSC-CMs in clinical applications.

Keywords: AMPK; cardiomyocyte maturation; hiPSC-CMs; hiPSCs; mitochondrial.


Figures

FIGURE 1
FIGURE 1
Changes in mitochondrial morphology and respiratory function after differentiation of hiPSCs into hiPSC-derived CMs. (A) Transmission electron microscopy images of hiPSCs and hiPSC-CMs illustrating the differences in mitochondrial morphology. Scale bar = 500 nm. hiPSC-CMs showed more mature, elongated, and large mitochondria with denser intramitochondrial cristae compared to those in hiPSCs. hiPSC-CMs had visible Z-bands and regular arrangement of myofibrils. Z, Z-bands, yellow arrows; MF, myofibrils; yellow arrows; Mit, mitochondria, red arrows. (B) Scheme of the mitochondrial stress test in the cells. (C) Two representative OCR traces of hiPSCs and hiPSC-CMs in response to oligomycin, FCCP, rotenone, and antimycin A (n = 12). (D) Statistical analysis of the differences in basal respiration, maximal respiration, proton leakage, ATP production, and non-mitochondrial respiration (n = 12). *P < 0.05, ***P < 0.001, compared with hiPSCs, unpaired t-test.
FIGURE 2
FIGURE 2
Activation of AMPK during hiPSC-derived cardiomyocyte differentiation. (A) Western blot analysis of AMPK, phospho-AMPK, PGC-1α, CPT-1α, and α-actinin on days 0, 10, 20, and 30 during hiPSC-derived cardiomyocyte differentiation. RT-qPCR analysis of the genes regulating energy metabolism [PGC-1α (B) and CPT-1α (C)] and fatty acid transport and oxidation-related genes [FABP3 (D), FAT-CD36 (E), and SLC27a6 (F)] in hiPSC-derived cardiomyocytes on days 0, 10, 20, and 30 (n = 3). *P < 0.05, **P < 0.01, ***P < 0.001, ****P < 0.0001 one-way ANOVA.
FIGURE 3
FIGURE 3
Activation of AMPK improved the metabolic maturation of hiPSC-CMs. (A) Western blot analysis of AMPK and phospho-AMPK expression in hiPSC-CMs treated with AICAR at various concentrations (0, 0.1, 0.5, and 1 mM). AICAR (0.5 and 1 mM) effectively upregulated the expression of phospho-AMPK (n = 3). (B) CCK-8 assay was performed to assess viability of hiPSC-CMs treated with AICAR at various concentrations (n = 3). **P < 0.01, ***P < 0.001, ****P < 0.0001 one-way ANOVA. (C) Western blot analysis of the effect of AMPK activation by AICAR on the protein expression levels of AMPK, p-AMPK, PGC-1α, PPARα, and ERRα (n = 3). (D) RT-qPCR analysis of the effect of AMPK activation by AICAR on the mRNA expression levels of PGC-1α, PPARα, and ERRα (n = 3). *P < 0.05, **P < 0.01, ***P < 0.001 compared with the control group, unpaired t-test.
FIGURE 4
FIGURE 4
The effects of AMPK activation on the expression of the downstream metabolism-related targets. For (A,C), the same membrane was probed for the indicated proteins, with GAPDH used as the loading control. (A) Western blot analysis of the expression of fatty acid β-oxidation-related proteins (CPT-1α, CPT-1β, and SLC24a6) in hiPSC-CMs treated with AICAR (vs. control) (n = 3). (B) RT-qPCR analysis of the effect of AICAR on the expression of fatty acid β-oxidation-related genes (CPT-1α, CPT-1β, FABP3, FAT-CD36, SLC27a6, SLC25a20, LCAD, and MCAD) (n = 3). (C) Western blot analysis of the expression of mitochondrial OxPhos-related proteins (COX5b, COXIV, Cyt-c, C-S, and MPC1) in hiPSC-CMs treated with AICAR (vs. control) (n = 3). (D) RT-qPCR analysis of the effect of AICAR on the expression of mitochondrial OxPhos-related genes (COX5b, ATP5a, and Cyt-c) (n = 3). (E) Relative hexokinase enzyme activity in hiPSCs treated with AICAR or control (n = 3). (F) Lactate measurements of hiPSCs treated with AICAR or control (n = 3). *P < 0.05, **P < 0.01, ***P < 0.001 compared with the control group, unpaired t-test.
FIGURE 5
FIGURE 5
Activation of AMPK improves the morphological and structural maturation of hiPSC-CMs. (A) Representative immunostaining of α-actinin (green) and Hoechst 33342 (blue) in control or AICAR-treated hiPSC-CMs. Scale bar, 10 μm. Analysis of cell area (B), perimeter (C), sarcomere length (D), and circularity index (E) (n = 80–100 cells/group). AICAR-treated hiPSC-CMs manifested significant changes in perimeter, sarcomere length and circularity index compared to those in the control cells. (F) Western blot analysis of α-actinin, TNNI3, and MYH7 protein expression in hiPSC-CMs treated with AICAR vs. control (n = 3). (G) RT-qPCR analysis of the effect of AICAR on the expression of the cardiomyocyte-related sarcomere protein-encoding gene (TNNI3, TNNT2, MYH7, MYL3, MYL4, MYBPC3, and CX43) (n = 3). (H) RT-qPCR analysis of the effect of AICAR on the expression of electrophysiology-related genes (CACNA1C, KCND2, KCNE1, KCNJ2, KCNQ1, KCNH2, and SCN5A) (n = 3). *P < 0.05, **P < 0.01, ***P < 0.001 compared with the control group, unpaired t-test.
FIGURE 6
FIGURE 6
Activation of AMPK improves the functional maturation of mitochondria in hiPSC-CMs. (A) Mitochondrial membrane potential was measured using a fluorescence probe JC-1 assay system in hiPSC-CMs treated with AICAR vs. control. The ratio of red/green fluorescence represents the level of Δψm (n = 80–100 cells/group). Scale bar, 50 μm. (B) ATP levels of hiPSCs treated with AICAR or control (n = 3). (C) Two representative OCR traces of hiPSCs treated with AICAR or control in response to oligomycin, FCCP, rotenone, and antimycin A (n = 12). (D) Statistical analysis of the differences in basal respiration, maximal respiration, proton leakage, ATP production, and non-mitochondrial respiration (n = 12). (E) Representative fatty acid oxidation of hiPSCs treated with AICAR or control after incubation with the etomoxir, oligomycin, FCCP and rotenone, and antimycin A. (F) Statistical analysis of the differences in basal respiration, maximal respiration, proton leakage, ATP production, and non-mitochondrial respiration (n = 12). *P < 0.05, **P < 0.01, ***P < 0.001 compared with the control group, unpaired t-test.
FIGURE 7
FIGURE 7
Activation of AMPK improves mitochondrial maturation of hiPSC-CMs. (A) Transmission electron microscopy images of hiPSCs treated with AICAR or control showing the differences in mitochondrial morphology. Scale bar, 500 nm. The number of mitochondria in AICAR-treated hiPSC-CMs was increased, and AICAR-treated hiPSC-CMs contained more mitochondrial crista than those in the control. Z, Z-bands, yellow arrows; MF, myofibrils, yellow arrows; Mit, mitochondria, red arrows. (B) MitoTracker green was used to investigate the changes in mitochondrial morphology in hiPSC-CMs treated with AICAR or control. The mean fluorescence intensity of MitoTracker green in hiPSC-CMs treated with AICAR vs. control (n = 80–100 cells/group). Scale bar, 10 μm. (C) Western blot analysis of MFN1, MFN2, and DRP1 protein expression in hiPSC-CMs treated with AICAR (vs. control) (n = 3). Mitochondrial DNA content determined by RT-qPCR using primers for mt-ND1 (D) and mt-ND2 (E) normalized to the housekeeping gene β-globin (n = 3). *P < 0.05, ***P < 0.001, ****P < 0.0001compared with the control group, unpaired t-test.

Similar articles

Cited by

References

    1. Ahmed R. E., Anzai T., Chanthra N., Uosaki H. (2020). A brief review of current maturation methods for human induced pluripotent stem cells-derived cardiomyocytes. Front. Cell Dev. Biol. 8:178. 10.3389/fcell.2020.00178 - DOI - PMC - PubMed
    1. Alaynick W. A. (2008). Nuclear receptors, mitochondria and lipid metabolism. Mitochondrion 8 329–337. 10.1016/j.mito.2008.02.001 - DOI - PMC - PubMed
    1. Arad M., Seidman C. E., Seidman J. G. (2007). AMP-activated protein kinase in the heart: role during health and disease. Circ. Res. 100 474–488. 10.1161/01.RES.0000258446.23525.37 - DOI - PubMed
    1. Bergeron R., Ren J. M., Cadman K. S., Moore I. K., Perret P., Pypaert M., et al. (2001). Chronic activation of AMP kinase results in NRF-1 activation and mitochondrial biogenesis. Am. J. Physiol. Endocrinol. Metab. 281 E1340–E1346. 10.1152/ajpendo.2001.281.6.E1340 - DOI - PubMed
    1. Cliff T. S., Dalton S. (2017). Metabolic switching and cell fate decisions: implications for pluripotency, reprogramming and development. Curr. Opin. Genet. Dev. 46 44–49. 10.1016/j.gde.2017.06.008 - DOI - PMC - PubMed