. 2020 Feb;1(2):184-196.
doi: 10.1038/s43018-020-0028-4. Epub 2020 Feb 24.

Extracellular cGAMP is a cancer cell-produced immunotransmitter involved in radiation-induced anti-cancer immunity

Affiliations

Extracellular cGAMP is a cancer cell-produced immunotransmitter involved in radiation-induced anti-cancer immunity

Jacqueline A Carozza et al. Nat Cancer. 2020 Feb.

Abstract

2'3'-cyclic GMP-AMP (cGAMP) is an intracellular second messenger that is synthesized in response to cytosolic double-stranded DNA and activates the innate immune STING pathway. Our previous discovery of its extracellular hydrolase ENPP1 hinted at the existence of extracellular cGAMP. Here, we detected that cGAMP is continuously exported but then efficiently cleared by ENPP1, explaining why it has previously escaped detection. By developing potent, specific, and cell impermeable ENPP1 inhibitors, we found that cancer cells continuously export cGAMP in culture at steady state and at higher levels when treated with ionizing radiation (IR). In mouse tumors, depletion of extracellular cGAMP decreased tumor-associated immune cell infiltration and abolished the curative effect of IR. Boosting extracellular cGAMP with ENPP1 inhibitors synergized with IR to delay tumor growth. In conclusion, extracellular cGAMP is an anti-cancer immunotransmitter that could be harnessed to treat cancers with low immunogenicity.


Conflict of interest statement

Competing Interests: M.S. and L.L. are scientific co-founders of Angarus Therapeutics, which has exclusive licensing rights to patent PCT/US2018/50018. J.A.C., V.B., K.E.S., M.S., and L.L. are inventors on patent PCT/US2018/50018.

Figures

Extended Data Figure 1 |
Extended Data Figure 1 |. Measuring cGAMP in 293T cGAS cell lines by LC-MS/MS
a, Chemical structures of cGAMP (top) and single isotopically-labeled cGAMP (bottom) used as an internal standard at a concentration of 0.5–1 μM. b-c, Full (7–8 point) standard curves and LC traces of lowest cGAMP standards in 50/50 acetonitrile/water spiked in directly (LOQ = 4 nM) (b) or after concentrating and extracting 12.5x from complete cell culture media (LOQ = 0.3 nM from original sample, 4 nM in concentrated sample) (c). IS = internal standard. R2 = coffecient of determination, determined after linear least squares regression with 1/Y2 weighting. Data are from 1 experiment, representative of (b) 64 independent experiments and (c) 13 independent experiments. d, Calibration of cell number to ATP concentration measured by LC-MS/MS. Data are from one experiment, representative of two independent experiments, 8 individual cell culture replicates are plotted. e, cGAS expression of 293T, 293T cGAS ENPP1−/−, and 293T cGAS ENPP1low cell lines analyzed by western blot (left; full scan of blot available in Source Data). ENPP1 hydrolysis activity of 32P-cGAMP in whole cell lysates from 1 million each of 293T cGAS, 293T cGAS ENPP1−/−, and 293T cGAS ENPP1low cells, measured by TLC and autoradiography (right). Data are from 1 experiment, representative of 5 independent experiments.
Extended Data Figure 2 |
Extended Data Figure 2 |. Development of assays to investigate the mechanism of cGAMP export
a, Schematic of experiment for b. CD14+ PMBCs were stimulated with increasing concentrations of extracellular cGAMP for 16 h. b, IFNB1 mRNA levels were normalized to indicated gene and fold induction was calculated relative to untreated CD14+ cells. Each donor was performed as a one independent experiment; 2 qPCR replicates are plotted with a bar representing the mean. c, Coomassie gel of recombinant mouse ENPP1 purified from media; elution fractions were pooled before use (left). 32P-cGAMP degradation by mouse ENPP1 analyzed by TLC (right). Data are representative of 10 independent experiments. d–e, 293T cGAS ENPP1low cells were incubated with serum-free ATP depletion media (no glucose, 6 mM 2-deoxy-D-glucose, 5 mM NaN3) or serum-free complete media for 1 hour. Levels of analytes were measured: (d) ATP by LC-MS/MS, total protein by BCA, cell death by extracellular lactate dehydrogenase activity, and (e) cGAMP by LC-MS/MS. BQL = below quantification limit. Data are from 1 experiment; 3 cell culture replicates are plotted (except for extracellular cGAMP, where 2 cell culture replicates are plotted). ATP data are representative of 3 independent validations (shown in Supplementary Fig. 5).
Extended Data Figure 3 |
Extended Data Figure 3 |. Characterization of ENPP1 inhibitors QS1 and STF-1084
a, Structure of QS1. b, Inhibition by QS1 (compared to STF-1084, replotted from Fig. 3e). in vitro (32P-cGAMP TLC assay, pH 7.5, purified mouse ENPP1): Ki,app = 6.4 μM, 2 independent experiments are plotted with a bar representing the mean. c, Intracellular, extracellular, and total cGAMP for 293T cGAS ENPP1−/− cells transfected with pcDNA6 (empty or containing human ENPP1) and treated ± QS1 after 24 hours. Data are from 1 experiment, representative of 2 independent validations; 2 cell culture replicates are plotted with a bar representing the mean. d, Permeability of compounds in Caco-2 assay. PA = peak area, IS = internal standard. Compounds were incubated on the apical side of a Caco-2 monolayer for 2 hours. Compound concentration on the basolateral side was monitored by LC-MS/MS. Apparent permeability rates (Papp) were calculated from the slope. Data are representative of 2 independent experiments; single points are plotted. e, Inhibitory activity of STF-1084 against alkaline phosphatase (ALPL) and ENPP2. Data are from 1 experiment, representative of 2 independent validations; 2 reaction replicates are plotted, except for ENPP2 100 uM and 32 nM, where 1 point is plotted. f, Kinome interaction map (468 kinases tested) for STF-1084 depicting kinase inhibition as a percent of control.
Extended Data Figure 4 |
Extended Data Figure 4 |. Intracellular and extracellular cGAMP from cancer cell lines
a, cGAS expression of 4T1-luc WT and 4T1-luc shcGAS analyzed by western blot (full scan of blot available in Source Data). Intracellular cGAMP (chromatograms and quantification displayed) in 4T1-luc WT and shcGAS cells without exogenous stimulation. Concentration reported in units of molecules/cell and nM (estimated using cell volume = 4 pL). IS = internal standard. Data are from 1 experiment; 2 cell culture replicates are plotted. b, Extracellular cGAMP produced by MC38 cells over 48 hours. At time 0, cells were refreshed with media supplemented with 50 μM STF-1084. Line depicts linear regression. Data are from one experiment representative of two independent validations; 2 cell culture replicates are plotted with a bar representing the mean. c, Chromatograms for E0771, Panc02, and NMuMG cell lysate from LC-MS/MS. E0771 cell lysate was spiked with 40 nM cGAMP to determine limit of quantification. IS = internal standard. Data are representative of 2 independent validations. d, cGAS and STING expression of 4T1-luc, MC38, E0771, Panc02, and Neuro-2a cell lines analyzed by western blot (full scan of blot available in Source Data). Data are representative of 3 independent validations. e, Cell viability of cancer cell lines 4T1-luc and E0771 measured by lactate dehydrogenase extracellular activity compared to intracellular activity. At time 0, cells were left untreated or treated with IR (8 Gy or 20 Gy) and refreshed with media supplemented with 50 μM STF-1084. Data are from 1 experiment representative of two independent validations; 2 cell culture replicates are plotted with a bar representing the mean.
Extended Data Figure 5 |
Extended Data Figure 5 |. Validation of Cgas−/− cell lines and tools to neutralize extracellular Cgamp
a, E0771 (left) and 4T1-luc (right) Cgas−/− cells subcloned from CRISPR knockout pools (full scan of blot available in Source Data). Data are representative of two independent validations. Six E0771 Cgas−/− subclones (1, 2, 4, 6, 8, and 9) were pooled before injection into mice. Two 4T1-luc Cgas−/− subclones were pooled before injection into mice. b, 293T cGAS ENPP1low cells were transfected with empty pcDNA6 (0.5 μg/mL) and incubated for 24 hours. Conditioned media was treated with nonbinding or neutralizing STING (1 hour pretreatment) and then incubated with CD14+ PBMCs for 16 h. Extracellular cGAMP measured by LC-MS/MS and IFNB1 expression (mRNA levels were normalized to CD14 and fold induction calculated relative to untreated CD14+ cells). Data are from 1experiment (supported by data in Fig. 5e and Extended Data Fig. 5 c, d); 2 cell culture replicates are plotted. c, Cxcl10 mRNA fold induction (normalized to Actb and untreated cells) in primary mouse bone marrow cells treated with 20 μM cGAMP in the presence of neutralizing or non-binding STING (100 μM) for 16 h. Data are from 1 experiment (supported by data in Fig. 5e and Extended Data Fig. 5 b, d); cell culture replicates plotted are (from left to right) 3, 2, 2, 3, 2, 2. d, Mouse bone marrow-derived macrophages were incubated with 10 uM cGAMP and indicated concentrations of neutralizing STING protein for 2 hours. Levels of pIRF3 and IRF3 were analyzed by western blotting. Data are from 1 experiment (supported by data in Fig. 5e and Extended Data Fig. 5 b, c) (full scan of blot available in Source Data).
Extended Data Figure 6 |
Extended Data Figure 6 |. FACS analysis and tumor growth following extracellular cGAMP depletion in untreated tumors
a, FACS gating scheme for experiments in Fig. 5 f–i, Fig. 7b, c and Extended Data Fig. 6b. b, WT or Cgas−/− E0771 cells (1x10⁶) were orthotopically injected into WT, Cgas−/− or Sting−/− C57BL/6J mice on day 0. Neutralizing STING or non-binding STING was intratumorally injected on day 2. Sample sizes of n mice, from left to right (non-binding STING, neutralizing STING): n = (5, 5); (4, 5); (5, 5); (5, 4). Mean ± SD, unpaired two-tailed t test with Welch’s correction. c, Established E0771 tumors (100 ± 20 mm3) were injected with non-binding (n = 8 mice) or neutralizing STING (n = 9 mice) every other day for the duration of the experiment. Tumor volumes for individual mice are shown. P value for tumor volume determined by pairwise comparisons using post hoc tests with a Tukey adjustment and for Kaplan Meier curve determined using the Log-rank Mantel-Cox test. d, ENPP1 activity in 4T1-luc, E0771, and MDA-MB-231 cells using the 32P-cGAMP degradation assay. Data from 1 experiment, representative of 3 independent validations.
Extended Data Figure 7 |
Extended Data Figure 7 |. Cytokine production in cancer cell lines treated with ionizing radiation
CXCL10 production by cancer cell lines 4T1-luc and E0771 measured by ELISA. At time 0, cells were left untreated or treated with IR (8 Gy or 20 Gy) and refreshed with media supplemented with 50 μM STF-1084. Data are from 1 experiment, representative of 2 independent validations; 2 cell culture replicates are plotted with a bar representing the mean.
Extended Data Figure 8 |
Extended Data Figure 8 |. FACS analysis of tumors treated with ionizing radiation
a, FACS gating scheme for live dead analysis in established tumors. E0771 cells (5x10⁴) were orthotopically injected into WT C57BL/6J mice. The tumors were treated with IR (8 Gy) when they reached 100 ± 20 mm3 and harvested and analyzed by FACS 24h after IR. For caspase activity, a single cell suspension was incubated for 1h with the FAM-FLICA Poly Caspase substrate before FACS stain and analysis. Mean ± SD, unpaired two-tailed t test with Welch’s correction. b, FACS gating scheme for experiments in Fig. 6c, d.
Extended Data Figure 9 |
Extended Data Figure 9 |. 4T1-luc Enpp1−/− tumor growth
a, Validating Enpp1−/− 4T1-luc clones (11 clones were pooled) using the 32P-cGAMP degradation assay (3 day incubation). Lysates were normalized by protein concentrations. Data are from 1 experiment, representative of three independent validations; 2 technical protein concentration replicates are plotted with a bar representing the mean. b, Established 4T1-luc WT (harboring scrambled sgRNA) (n = 10 mice) or Enpp1−/−tumors (n = 10 mice) (100 ± 20 mm3) were monitored without treatment. Tumor volumes for individual mice are shown. c, Established 4T1-luc WT (harboring scrambled sgRNA) (n = 10 mice) or Enpp1−/−tumors (n = 10 mice) (100 ± 20 mm3) were treated with IR (20 Gy) and monitored. Tumor volumes for individual mice are shown. d, Established 4T1-luc WT (harboring scrambled sgRNA) (n = 9 mice) or Enpp1−/−tumors (n = 9 mice) (100 ± 20 mm3) were treated with three intratumoral injections of 10 μg cGAMP on day 2, 4, and 7 and monitored. Tumor volumes for individual mice are shown.
Extended Data Figure 10 |
Extended Data Figure 10 |. A systemic ENPP1 inhibitor delays Panc02 tumor growth as a single agent and synergizes with ionizing radiation
a, Structure of ENPP1 inhibitor STF-1623. b, Inhibition by STF-1623. In vitro (32P-cGAMP TLC assay, pH 7.5, purified mouse ENPP1: Ki,app = 16 nM. 3 independent experiments are plotted. In cells (cGAMP export assay, human ENPP1 transfected into 293T cGAS ENPP1−/− cells): IC50 = 68 nM. Data are from 1 experiment; 2 cell culture replicates are plotted. c, Mean apparent permeability (Papp) for STF-1623 and controls. For PAMPA and MDCK, mean was calculated from 2 cell culture replicates, 1 experiment. For Caco-2, mean was calculated from 2 independent experiments (data for atenolol and propranolol are reproduced from Fig. 3f for comparison). d, Permeability of compounds in Caco-2 assay. PA = peak area, IS = internal standard. Compounds were incubated on the apical side of a Caco-2 monolayer for 2 hours. Compound concentration on the basolateral side was monitored by LC-MS/MS. Apparent permeability rates (Papp) were calculated from the slope. Data are representative of 2 independent experiments; single points are plotted. e, PBMCs were incubated with STF-1623 for 16 h. Data are from one experiment; 2 cell culture replicates are plotted. f, Kinome interaction map (468 kinases tested) for STF-1623 depicting kinase inhibition as a percent of control. g, Intracellular and extracellular cGAMP concentrations for 293T cGAS ENPP1−/− cells transfected with pcDNA6 (empty or containing human ENPP1) and treated ± 2 μM STF-1623 after 24 hours. Data are from 1 experiment; cell culture replicates plotted from left to right are (intracellular) 2, 3, 2, 5 and (extracellular) 2, 3, 2, 3. h, PBMCs were electroporated ± 200 nM cGAMP and incubated ± 2 μM STF-1623 for 16 h. IFNB1 and CXCL10 mRNA levels were normalized to ACTB and fold induction calculated relative to untreated cells. Data are from 1 experiment; 2 cell culture replicates are plotted. i, Mice were injected subcutaneously with 300 mg/kg STF-1623 at time 0. At indicated times, the mouse was sacrificed, blood was drawn by cardiac puncture, and serum isolated after clotting. STF-1623 concentrations were measure by LC-MS/MS. Data are from 1 experiment; 2 mice per time point are plotted except for 8 hours, where 3 mice are plotted. j, Mice bearing established subcutaneous Panc02 tumors (100 ± 20 mm3) were implanted with a subcutaneous pump containing STF-1623 (50 mg/kg/day) on day 0 and left untreated or treated with IR (20 Gy) on day 1. No IR: n = 10 mice, no IR + STF-1623: n = 10 mice, IR (20 Gy): n = 10 mice, IR (20 Gy) + STF-1623: n = 15 mice. Pumps were removed on day 8. Tumor volumes for individual mice are shown. P value determined by pairwise comparisons using post hoc tests with a Tukey adjustment. In b and g, cGAMP is measured by LC-MS/MS. BQL = below quantification limit. In b, e, g, h, and i, replicates are plotted individually with a bar representing the mean.
Figure 1 |
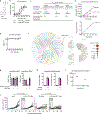
Figure 1 |. cGAMP is exported from 293T cGAS ENPP1−/− cells
a, Intracellular concentrations of cGAMP from 293T cGAS ENPP1−/− cells without exogenous stimulation. At time 0, cells were replenished with serum-free media. Dashed line represents mean cGAMP concentration over all time points. Data are from 1 experiment, representative of 3 independent validations (Supplementary Fig. 1a, b); 2 cell culture replicates are plotted for each time point. b, Intracellular concentrations of cGAMP from 293T WT and 293T cGAS ENPP1−/− cells without exogenous stimulation at steady state. Data are from 1 experiment (supported by experiments in Fig. 2c and Supplementary Fig. 1c); 2 cell culture replicates are plotted. c, Extracellular concentrations of cGAMP from experiment in a. Dashed line represents a linear regression. Data and regression are from 1 experiment, representative of 3 independent validations (Supplementary Fig. 1a, b); 2 cell culture replicates are plotted for each time point. d, Linear regression of cGAMP exported per cell over time. Data reanalyzed from periment in a and c. Linear regression is representative of regressions from 3 independent validations (Supplementary Fig. 1a, b). e, The fraction of extracellular/total cGAMP molecules (left y-axis) (data reanalyzed from experiment in a and c) compared to the fraction of extracellular/total lactate dehydrogenate (LDH) activity as a proxy for cell death (right y-axis). Data from lactate dehydrogenase assay are from 1 experiment, representative of 4 independent validations (Supplementary Fig. 1d–f); 2 cell culture replicates are plotted. Linear regressions were performed for data shown. f, Expression of cGAS in 293T WT, 293T stably expressing mouse cGAS, and 293T stably expressing human cGAS assessed by western blot. Data are from 1 experiment (full scan of blot available in Source Data). g, Intracellular and extracellular concentrations of cGAMP from 293T stably expressing mouse cGAS and 293T stably expressing human cGAS. Cells were transfected ± 0.5 μg/mL empty pcDNA6 vector. After 24 hours, cells were refreshed with serum-free media and incubated for another 24 hours before measuring cGAMP. Data are from 1 experiment, representative of 2 independent validations (Supplementary Fig. 1g); 2 cell culture replicates are plotted. In a, b, c, d, e, and g, cGAMP is measured by LC-MS/MS and replicates are plotted individually with a bar representing the mean.
Figure 2 |
Figure 2 |. Characterization of cGAMP export mechanism in 293T cGAS ENPP1−/− cells
a, Intracellular and extracellular cGAMP from 293T cGAS ENPP1−/− cells measured ± filtering the media (10 kDa MWCO). Data are from 1 experiment, representative of 2 independent experiments (Supplementary Fig. 2a); 2 cell culture replicates are plotted. b, Schematic of experiments in c and d. 293T or 293T cGAS ENPP1low cells were transfected with empty pcDNA6 (0.5 μg/mL) and treated ± 20 nM recombinant mouse ENPP1 (mENPP1). Conditioned media was incubated with CD14+ PBMCs for 16 h. c–d, Extracellular cGAMP and IFNB1 expression (mRNA levels were normalized to CD14 and fold induction calculated relative to untreated CD14+ cells). Data shown in each panel are from 1 experiment; 2 cell culture replicates are plotted. Data in c are representative of 3 independent validations (Supplementary Fig. 2b, c). Data in d are supported by data in Fig. 3b, e, h, j, and Fig. 4a. e–f, The amount of total (e), intracellular (exponential fit), and extracellular (polynomial fit) (f) cGAMP over time produced by 293T cGAS ENPP1−/− cells after transfection with empty pcDNA6 (1.5 μg/mL). Data and fits are from 1 experiment, representative of 3 independent validations (Supplementary Fig. 2d, e). g, cGAMP export rates plotted against intracellular concentration of cGAMP, reanalyzed from data in f. Data are fit with allosteric sigmoidal modelvexport=Vmax[substrate]n/(Khalf)n+[substrate]n, where Vmax = maximal transporter velocity, n = Hill slope, and Khalf = substrate concentration at half Vmax. If we constrain Vmax < 5000 molecules cell−1 s−1, then Km > 60 μM. Analysis is from the same experiment shown in ef, representative of 3 independent validations (Supplementary Fig. 2d, e). h, Potential mechanisms of cGAMP export. In a, c, and d, replicates are plotted individually with a bar representing the mean.
Figure 3 |
Figure 3 |. Development of a cell impermeable ENPP1 inhibitor to enhance extracellular cGAMP activity.
a–b, 293T cGAS ENPP1−/− cells were transfected with pcDNA6 (empty or containing human ENPP1). ENPP1 expression and activity (32P-cGAMP hydrolysis by thin layer chromatography (TLC), pH 9.0) (a, full scan of blot available in Source Data) and cGAMP concentrations (b) are shown. Data are from 1 experiment, representative of 3 independent validations (Supplementary Fig. 3a–d); 2 cell culture replicates are plotted in b. c, Possible cellular locations of ENPP1. d, Structure of ENPP1 inhibitor STF-1084. e, Inhibition by STF-1084. In vitro (32P-cGAMP TLC assay, pH 7.5, purified mouse ENPP1: Ki,app = 110 nM. Three independent experiments are plotted. In cells (cGAMP export assay, human ENPP1 transfected into 293T cGAS ENPP1−/− cells): IC50 = 340 nM. Data are from 1 experiment; 2 cell culture replicates are plotted (supported by data in Fig. 3h, j). f, Mean apparent permeability (Papp) for STF-1084 and controls. For PAMPA and MDCK, mean was calculated from 2 cell culture replicates, 1 experiment. For Caco-2, mean was calculated from 2 independent experiments. g, PBMCs were incubated with STF-1084 for 16 h. Data are from one experiment, representative of 2 independent validations (Supplementary Fig. 3e); 3 cell culture replicates are plotted. h, Intracellular and extracellular cGAMP for 293T cGAS ENPP1−/− cells transfected with pcDNA6 (empty or containing human ENPP1) and treated ± 10 μM STF-1084 after 24 hours. Data are from 1 experiment, representative of 2 independent validations (Supplementary Fig. 3f); 3 cell culture replicates are plotted. i, Schematic of experiment in j. 293T cGAS ENPP1low cells were transfected with human ENPP1 and treated ± 10 μM STF-1084. Conditioned media was incubated with CD14+ PBMCs for 16 h. j, Extracellular cGAMP and IFNB1 expression (mRNA levels were normalized to CD14 and fold induction calculated relative to untreated CD14+ cells). Data are from 1 experiment (supported by data in Fig. 2d, Fig. 3b, e, h, and Fig. 4a); 2 cell culture replicates are plotted. k, PBMCs were electroporated ± 200 nM cGAMP and incubated ± 50 μM STF-1084 for 16 h. IFNB1 and CXCL10 mRNA levels were normalized to ACTB and fold induction calculated relative to untreated cells. Data are from 1 experiment, representative of 2 independent experiments (Supplementary Fig. 3g, h); 2 cell culture replicates are plotted. In b, e, g, h, j, and k, replicates are plotted individually with a bar representing the mean. BQL = below quantification limit.
Figure 4 |
Figure 4 |. Cancer cells continuously export cGAMP in culture at steady state and ionizing radiation further increases export
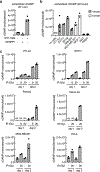
a, Extracellular cGAMP produced by 4T1-luc cells after 48 hours in serum-containing media in the absence or presence of 50 μM STF-1084. Conditioned media without STF-1084 was also incubated with 10 nM of recombinant mENPP1 overnight. Data are from 1 experiment (supported by data in Fig. 3b, e, h, and j; 3 cell culture replicates are plotted. b, Extracellular cGAMP produced by 4T1-luc (5 cell culture replicates from 2 independent experiments), E0771 (2 cell culture replicates), MC38 (2 cell culture replicates), NMuMG (3 cell culture replicates), MDA-MB-231 (2 cell culture replicates), MCF-7 (2 cell culture replicates), 293T (3 cell culture replicates), and primary human PBMCs (6 cell culture replicates from 2 donors) measured after 48 h in the presence of 50 μM STF-1084. BQL = below quantification limit. Data are from 1 experiment except where indicated for 4T1-luc. c, Extracellular cGAMP produced by cancer cell lines 4T1-luc, E0771, Panc02, Neuro-2a, MDA-MB-231, and HeLa after 24 and 48 hours. At time 0, cells were left untreated or treated with IR (8 Gy or 20 Gy) and refreshed with media supplemented with 50 μM STF-1084. Data for each cell line are from 1 experiment. For 4T1-luc and E0771, data are representative of 2 independent validations (Supplementary Fig. 4); 2 cell culture replicates. In all panels, cGAMP is measured by LC-MS/MS and replicates are plotted individually with a bar representing the mean. BQL = below quantification limit.
Figure 5 |
Figure 5 |. Extracellular cGAMP is produced by cancer cells and sensed by host STING
a, Experimental setup to assess the role of extracellular cGAMP in vivo. b, Coomassie gel of recombinant cytosolic mouse WT and R237A STING. Data are representative of 5 independent experiments. c, Binding curves for neutralizing STING (WT) and non-binding STING (R237A) determined by a membrane binding competition assay with 35S-cGAMP. Data from 2 independent experiments are plotted. d, Structure of WT STING with cGAMP with R237 highlighted in pink (PDB ID 4LOJ). e, IFNB1 mRNA fold induction in CD14+ PBMCs treated with 2 μM cGAMP in the presence of neutralizing or non-binding STING (2 μM to 100 μM, 2.5-fold dilutions). Data are from 1 experiment (supported by data in Extended Data Fig. 5 b–d); 2 qPCR replicates are plotted with a bar representing the mean. f–i, The indicated cells (1x10⁶ of E0771 or 1x10⁶ of 4T1-luc) of the indicated genetic background (WT or Cgas−/−) were orthotopically injected into mice (C57BL/6 for E0771 or BALB/cJ for 4T1-luc) of the indicated genetic background (WT, Cgas−/−, or Sting−/−) on day 0. Non-binding STING, neutralizing STING, PBS, or recombinant mouse ENPP1 (mENPP1) were intratumorally injected on day 2. Tumors were harvested and analyzed by FACS on day 3. Sample sizes of n mice, from left to right (non-binding STING, neutralizing STING): (f) n = (5, 5); (4, 5); (5, 5); (5, 4). (g) n = (5, 5); (5, 5); (5, 4). (h) n = (2, 3); (5, 5). (i) n = (5, 6). Mean ± SD, unpaired two-tailed t test with Welch’s correction. j, E0771 cells (5x10⁴) were orthotopically injected into WT (n = 10 mice) or Enpp1−/− (n = 6 mice) C57BL/6J mice. P value for tumor volume determined by pairwise comparisons using post hoc tests with a Tukey adjustment and for Kaplan Meier curve determined using the Log-rank Mantel-Cox test.
Figure 6 |
Figure 6 |. Extracellular cGAMP is responsible for the efficacy of ionizing radiation
a, E0771 cells (5x10⁴) were orthotopically injected into WT (n = 17 mice) or Sting/− (n = 9 mice) C57BL/6J mice. The tumors were treated with IR (8 Gy) when they reached 100 ± 20 mm3. Tumor volumes for individual mice are plotted. b, E0771 cells (5x10⁴) were orthotopically injected into WT C57BL/6J mice. The tumors were treated with IR (8 Gy) when they reached 100 ± 20 mm3 and injected with non-binding (n = 8 mice) or neutralizing STING (n = 10 mice) every other day for the duration of the experiment. Tumor volumes for individual mice are plotted. c–d, E0771 cells (5x10⁴) were orthotopically injected into WT C57BL/6J mice. The tumors were treated with IR (8 Gy) when they reached 100 ± 20 mm3 and injected with non-binding (n = 5 mice) or neutralizing STING (n = 5 mice) on days 2 and 4 after IR. Tumors were harvested and analyzed by FACS on day 5. Mean ± SD, unpaired two-tailed t test.
Figure 7 |
Figure 7 |. Genetic and pharmacological inhibition of ENPP1 increases immune detection of cancer and synergizes with ionizing radiation
a, ENPP1 expression in human cancers. Data are represented as box plots showing range of mRNA expression levels. RNA sequencing data from the TCGA Research Network (https://www.cancer.gov/tcga) PanCanAtlas and visualized with cBioPortal. b, 4T1-luc WT or Enpp1−/− cells (1x10⁶) were orthotopically injected into WT BALB/cJ mice on day 0. Tumors were left untreated or treated with IR (20 Gy) on day 2. Tumors were harvested and analyzed by FACS on day 3. n = 5 mice for all groups. Mean ± SD, unpaired two-tailed t test with Welch’s correction. c, 4T1-luc cells (1x10⁶) were orthotopically injected into WT BALB/cJ mice on day 0. Tumors were treated with IR (20 Gy) and intratumorally injected with PBS (n = 4 mice) or STF-1084 (n = 5 mice) on day 2. Tumors were harvested and analyzed by FACS on day 3. Mean ± SD, unpaired two-tailed t test with Welch’s correction. d, Established 4T1-luc WT (harboring scrambled sgRNA) or Enpp1−/− tumors (100 ± 20 mm3) were treated once with IR (20 Gy) followed by three intratumoral injections of 10 μg cGAMP on day 2, 4, and 7 after IR (n = 10 mice for WT, n = 11 mice for Enpp1−/−). Tumor volumes for individual mice are shown. P value determined by pairwise comparisons using post hoc tests with a Tukey adjustment at day 20. In the Enpp1−/−4T1-luc + IR (20 Gy) + cGAMP treatment group, 3/11 mice were tumor free verified by bioluminescent imaging (tumor area outlined in red). d, Established 4T1-Luc tumors (100 ± 20 mm3) were treated once with IR (20 Gy) followed by three intratumoral injections of 10 μg cGAMP alone (n = 9 mice) or 10 μg cGAMP + 100 μL of 1 mM STF-1084 (n = 10 mice) on day 2, 4, and 7 after IR. Tumor volumes for individual mice are shown. P value determined by pairwise comparisons using post hoc tests with a Tukey adjustment at day 40.

References

    1. Wu J et al. Cyclic GMP-AMP is an endogenous second messenger in innate immune signaling by cytosolic DNA. Science (80-. ). 339, 826–30 (2013). - PMC - PubMed
    1. Sun L, Wu J, Du F, Chen X & Chen ZJ Cyclic GMP-AMP Synthase Is a Cytosolic DNA Sensor That Activates the Type I Interferon Pathway. Science (80-. ). 339, 786–791 (2013). - PMC - PubMed
    1. Li X-D et al. Pivotal Roles of cGAS-cGAMP Signaling in Antiviral Defense and Immune Adjuvant Effects. Science (80-. ). 341, 1390–1394 (2013). - PMC - PubMed
    1. Barber GN STING: infection, inflammation and cancer. Nat. Rev. Immunol 15, 760–770 (2015). - PMC - PubMed
    1. Ishikawa H, Ma Z & Barber GN STING regulates intracellular DNA-mediated, type i interferon-dependent innate immunity. Nature 461, 788–792 (2009). - PMC - PubMed

Methods References:

    1. Vilalta M, Rafat M, Giaccia AJ & Graves EE Recruitment of Circulating Breast Cancer Cells Is Stimulated by Radiotherapy. Cell Rep 8, 402–409 (2014). - PMC - PubMed
    1. Kato K et al. Expression, purification, crystallization and preliminary X-ray crystallographic analysis of Enpp1. Acta Crystallogr. Sect. F Struct. Biol. Cryst. Commun 68, 778–782 (2012). - PMC - PubMed
    1. Amend SR, Valkenburg KC & Pienta KJ Murine hind limb long bone dissection and bone marrow isolation. J. Vis. Exp 2016, 3–6 (2016). - PMC - PubMed
    1. Sanjana NE, Shalem O & Zhang F Improved vectors and genome-wide libraries for CRISPR screening. Nat. Methods 11, 783–784 (2014). - PMC - PubMed
    1. Kato K et al. Crystal structure of Enpp1, an extracellular glycoprotein involved in bone mineralization and insulin signaling. Proc. Natl. Acad. Sci. U. S. A 109, 16876–81 (2012). - PMC - PubMed

Publication types

Substances