. 2021 Mar;2(3):312-326.
doi: 10.1038/s43018-020-00171-8. Epub 2021 Feb 11.

Combined inhibition of Aurora-A and ATR kinase results in regression of MYCN-amplified neuroblastoma

Affiliations

Combined inhibition of Aurora-A and ATR kinase results in regression of MYCN-amplified neuroblastoma

Isabelle Roeschert et al. Nat Cancer. 2021 Mar.

Abstract

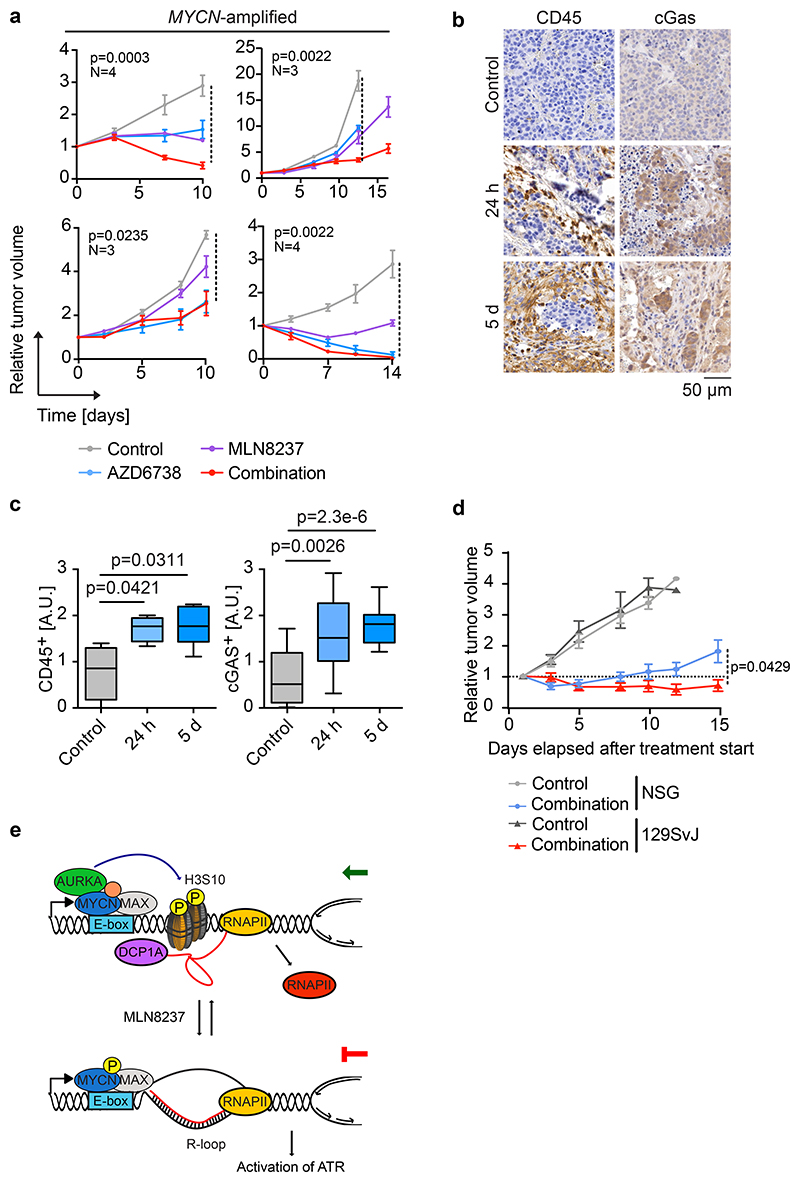
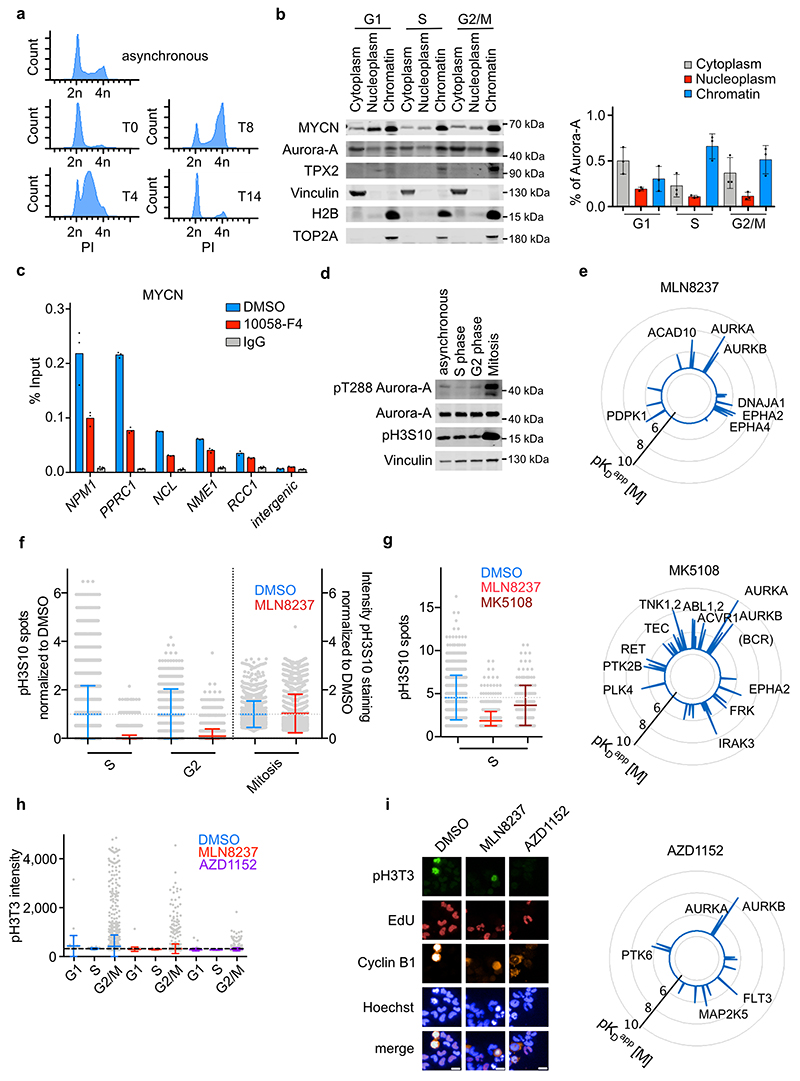
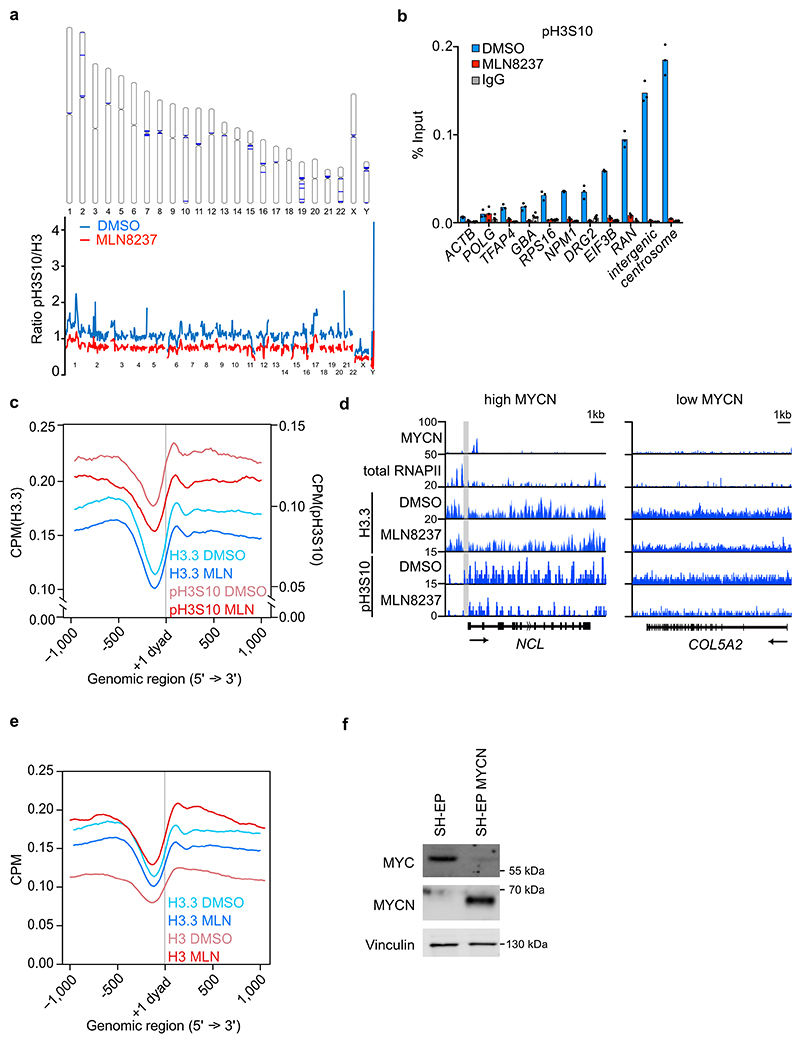
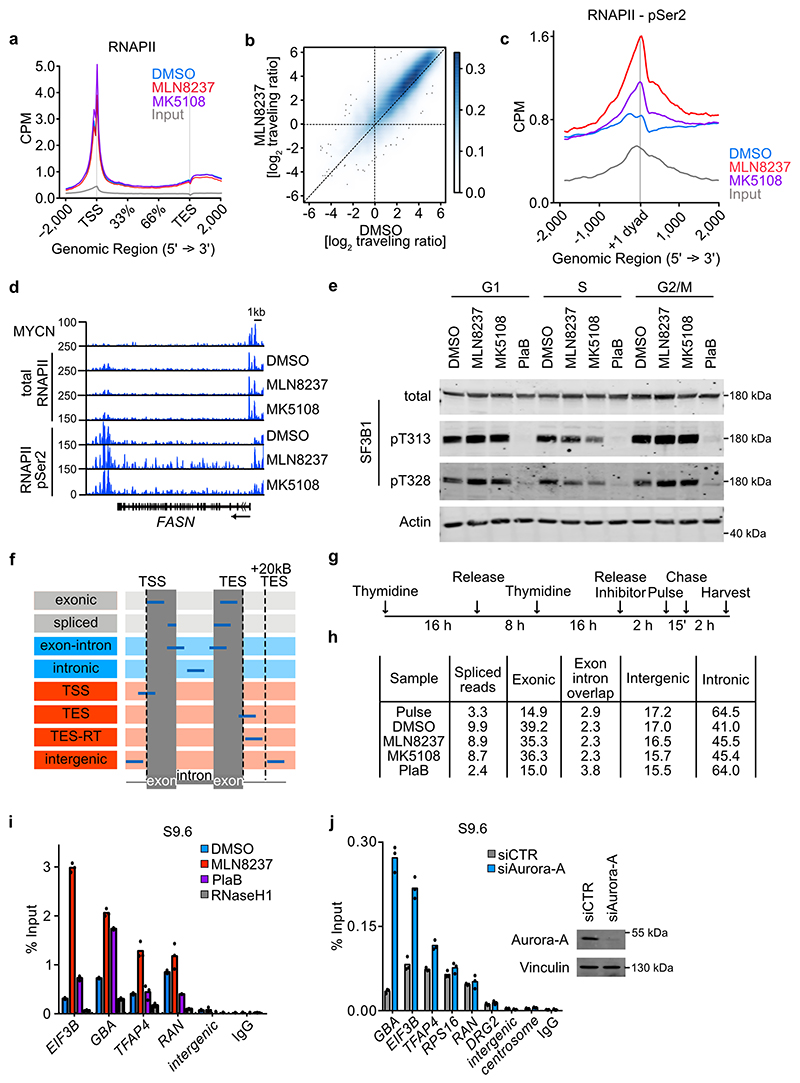
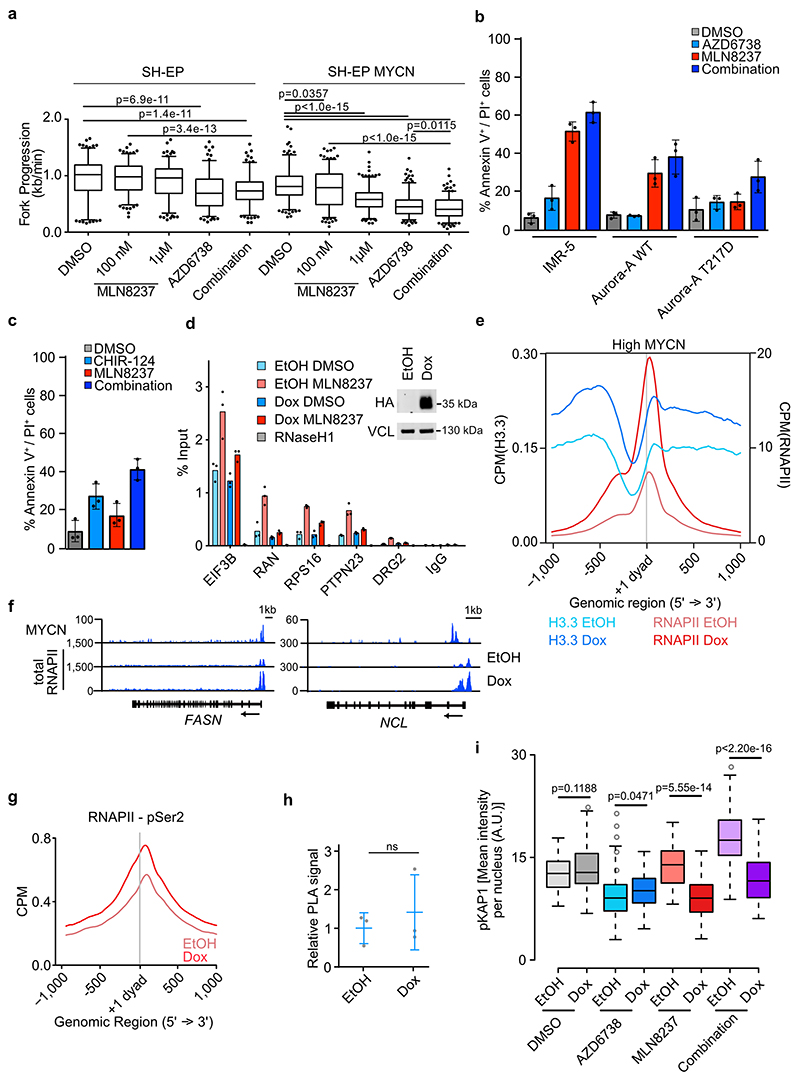
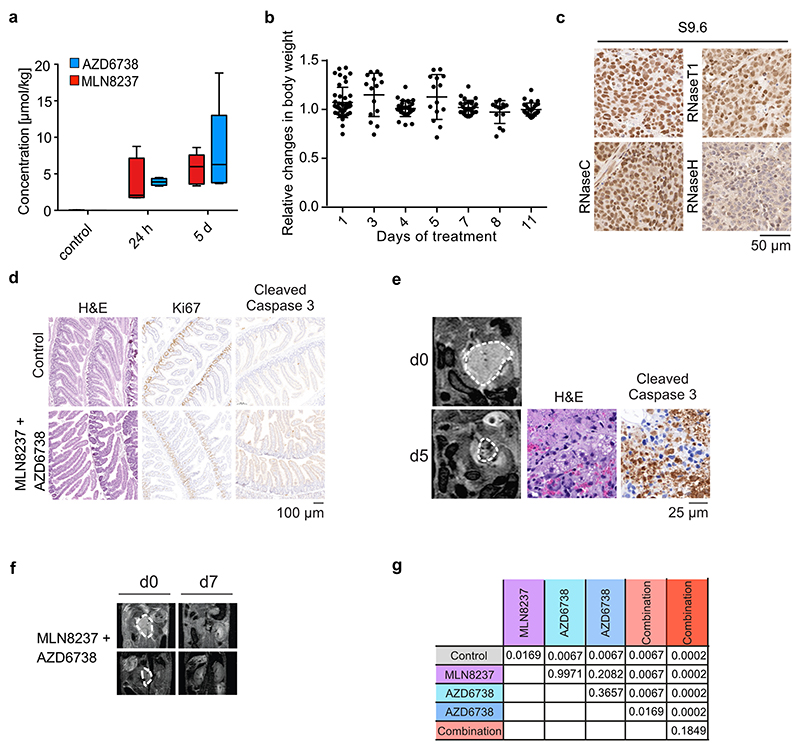
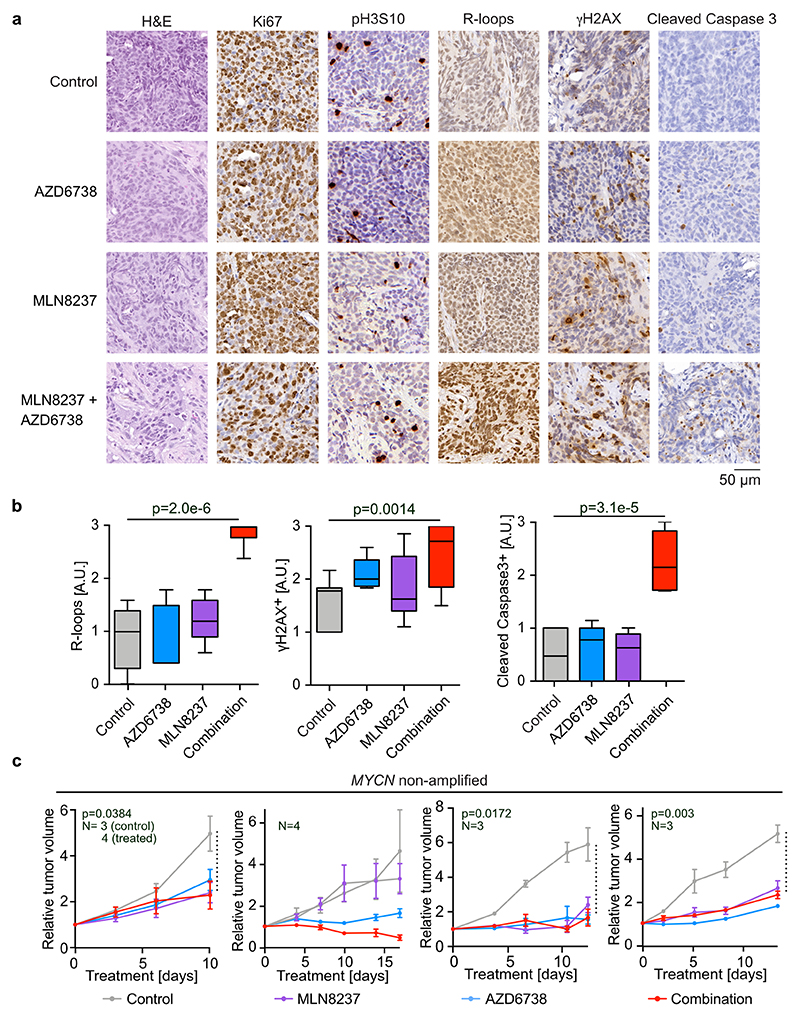
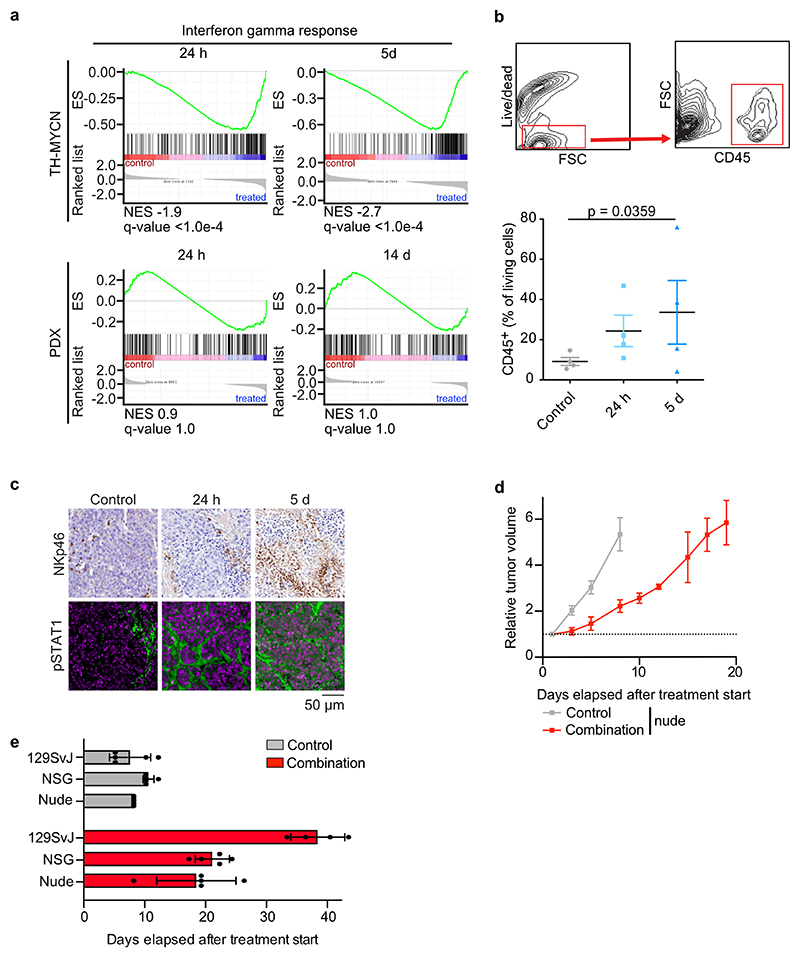
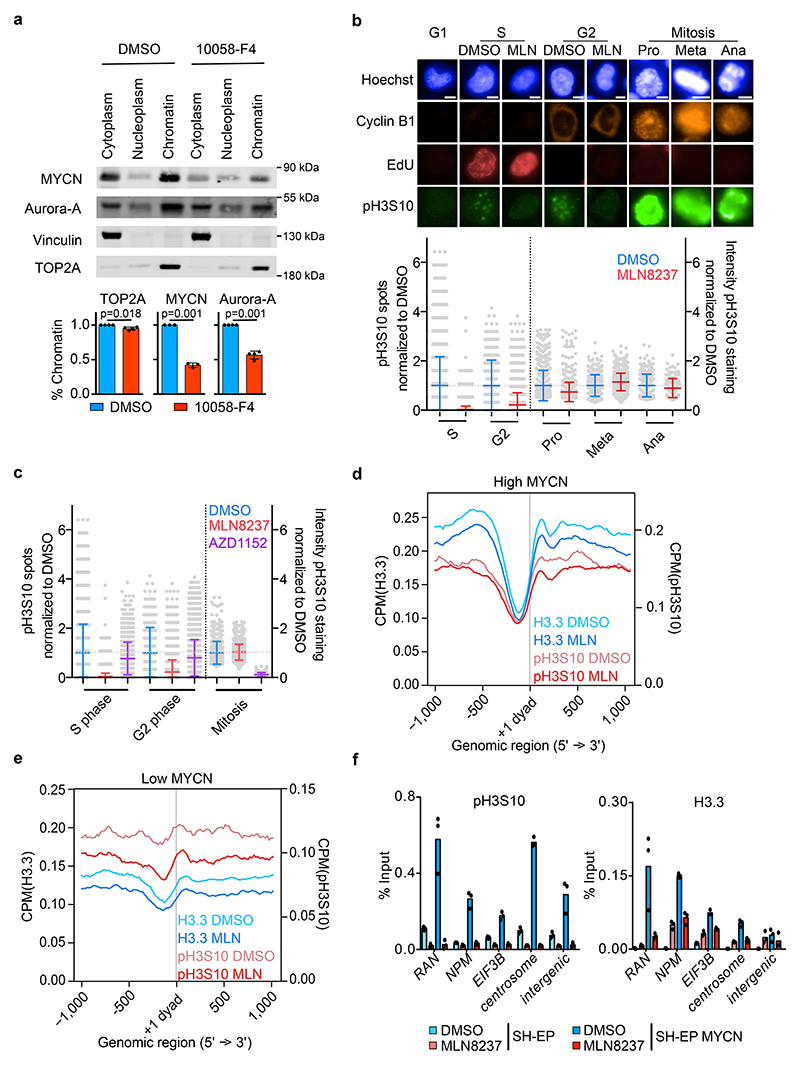
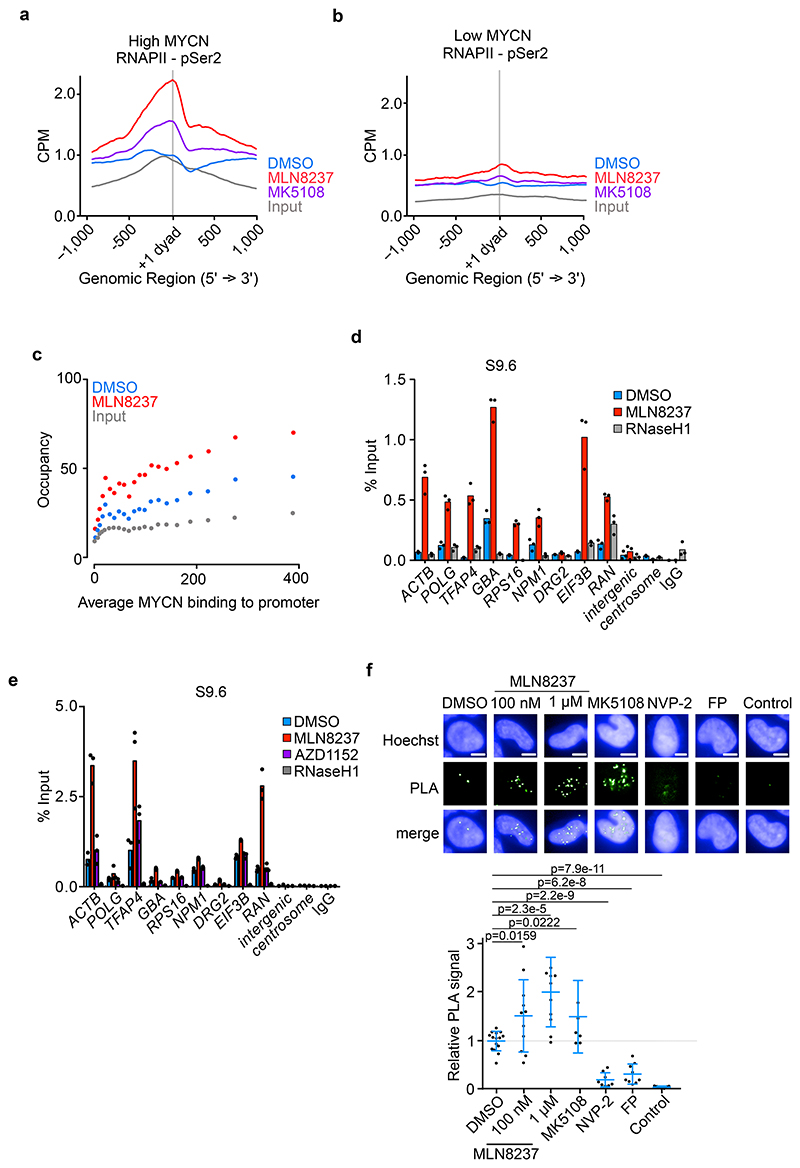
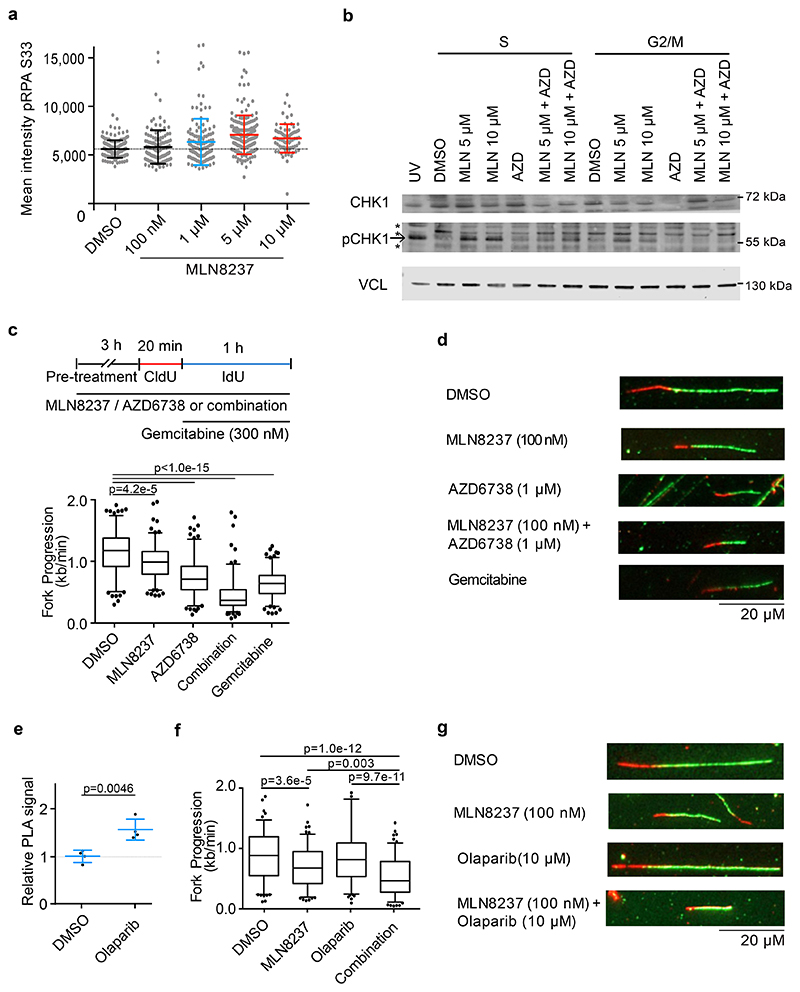
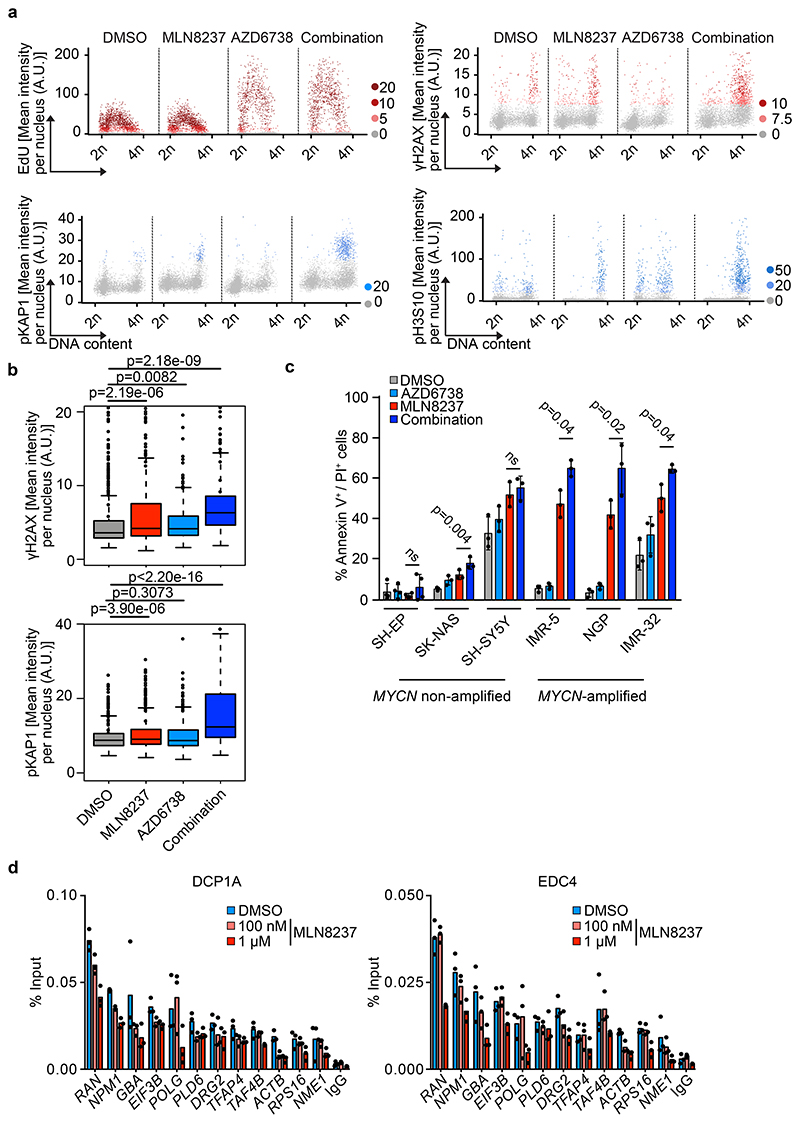
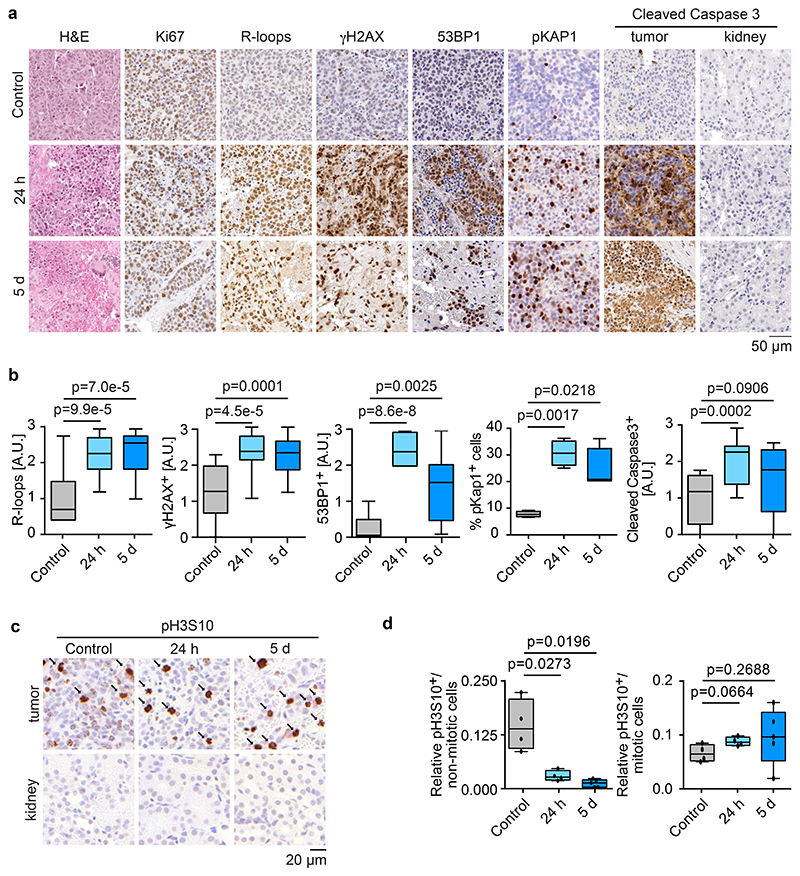
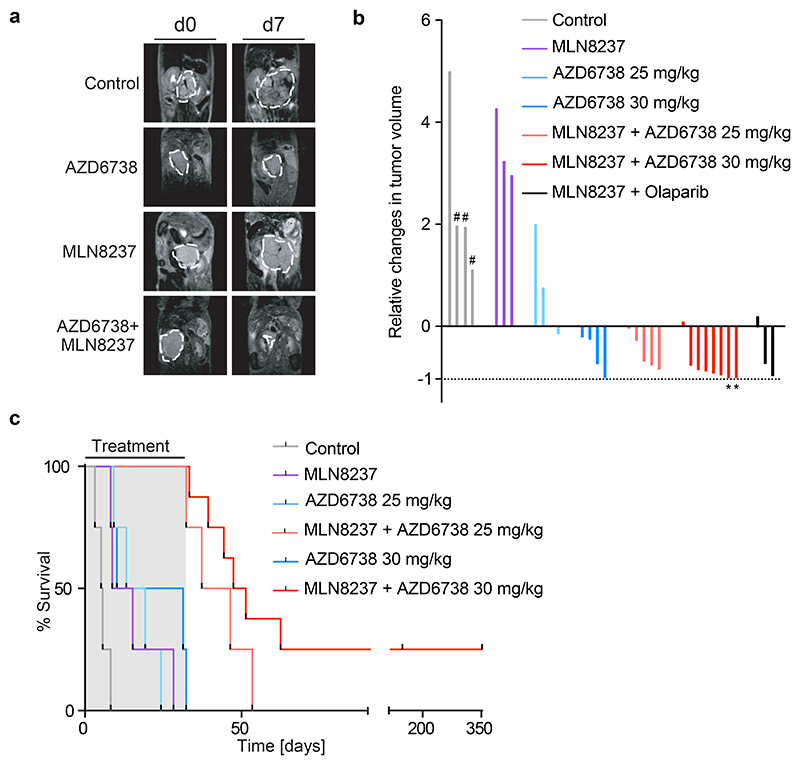
Amplification of MYCN is the driving oncogene in a subset of high-risk neuroblastoma. The MYCN protein and the Aurora-A kinase form a complex during S phase that stabilizes MYCN. Here we show that MYCN activates Aurora-A on chromatin, which phosphorylates histone H3 at serine 10 in S phase, promotes the deposition of histone H3.3 and suppresses R-loop formation. Inhibition of Aurora-A induces transcription-replication conflicts and activates the Ataxia telangiectasia and Rad3 related (ATR) kinase, which limits double-strand break accumulation upon Aurora-A inhibition. Combined inhibition of Aurora-A and ATR induces rampant tumor-specific apoptosis and tumor regression in mouse models of neuroblastoma, leading to permanent eradication in a subset of mice. The therapeutic efficacy is due to both tumor cell-intrinsic and immune cell-mediated mechanisms. We propose that targeting the ability of Aurora-A to resolve transcription-replication conflicts is an effective therapy for MYCN-driven neuroblastoma (141 words).


Conflict of interest statement

Conflict of Interest The authors declare no competing interests.

Figures

Figure 7
Figure 7. Combination therapy engages the immune system.
a. Relative changes in tumor volume of four MYCN-amplified PDX models during treatment with indicated inhibitors. Shown is the mean ± S.E.M.. Each experimental cohort had at least three animals. P-values comparing the control to the combination were calculated using unpaired two-sided t-test. b. Histology of representative tumor sections showing CD45- and cGAS-positive cells in tumors of TH-MYCN mice treated with combined Aurora-A/ATR inhibition. Each group has a minimum of four animals. c. Box plots of CD45-(left) and cGAS-positive (right) staining in tumor sections in (d). P-values were calculated using unpaired two-sided t-test using Welch’s correction (n≥12 sections from at least 4 animals from each condition were evaluated). d. Relative changes in tumor volume of subcutaneous allografts in NSG or 129SvJ mice after treatment with vehicle or a combination of AZD6738 (25 mg/kg every day) and MLN8237 (15mg/kg, 5 days on, 2 days off). Shown is the mean ± S.E.M.. Each group consist of five animals. P-value comparing the relative tumor volume of NSG and 129SvJ treated with the combination at day 15 was calculated using unpaired two-tailed t-test. e. Model summarizing our findings. For clarity of presentation only one nucleosome is shown.
Extended Data Figure 1
Extended Data Figure 1. Aurora-A phosphorylates H3S10 in S phase
a. Propidium-Iodide stained FACS profiles of IMR-5 cells synchronized at the G1/S boundary by a double-thymidine block (T0). Asynchronous cells are shown as controls. Cells were released from the block for 4 h into S phase, for 8 h into G2/M phase and for 14 h into G1 phase Data representative of 3 independent experiments with similar results. b. Fractionation of synchronized MYCN-amplified IMR-5 neuroblastoma cells. (Left): Immunoblots of equal aliquots of each fraction were probed for the indicated proteins. Data representative of 3 independent experiments with similar results. (Right): Quantitation of Aurora-A levels in each cell cycle phase. Shown is mean ± S.D. (n=3 independent experiments). c. MYCN ChIP at indicated loci in asynchronous IMR-5 cells treated for 4 h with 10058-F4 (100 μM). IgG control was used as control for antibody specificity. Data are presented as mean of technical triplicates. Data representative of 3 independent experiments with similar results. d. Immunoblots of indicated proteins of IMR-5 cells either asynchronous, synchronized by double thymidine block into S or G2 phase or synchronized into mitosis by incubation with nocodazole for 16 h. Data representative of 2 independent experiments with similar results. e. Radar blots documenting specificity of Aurora kinase inhibitors: MLN8237, MK5108, AZD1152; data are from. f. Quantification of pH3S10 staining in IMR-5 cells treated for 8 h with MLN8237 (1 μM) relative to control (DMSO) cells; each grey dot represents a cell. In S and G2 phase number of spots and in mitotic cells intensity of pH3S10 signal relative to DMSO is shown. Data are presented as mean ± S.D. (n≥614 cells per condition examined over 3 independent experiments). g. Quantification of pH3S10 staining of IMR-5 cells in S phase treated for 8 h with 100 nM MLN8237, 1 μM MK5108 or DMSO as control. Each dot represents one cell. Data are presented as mean ± S.D. (n≥147 cells per condition examined over 3 independent experiments). h. Quantification of pH3T3 intensity in IMR-5 cells treated for 8 h with 100 nM MLN8237, 100 nM AZD1152 or DMSO as control; each grey dot represents a cell. Shown is the mean ± S.D. (n≥47 cells per condition examined over 3 independent experiments). i. Representative example pictures of 3 independent experiments with similar results. White line indicates 15 μm.
Extended Data Figure 2
Extended Data Figure 2. Effects of Aurora-A inhibition on H3.3 and pH3S10
a. (Top): Ideogram illustrating the 50 bins with the strongest reduction in pH3S10 MLN8237 as compared to pH3S10 DMSO (blue rectangles). (Bottom): Levels of pH3S10 relative to total H3 along all chromosomes of S phase-synchronized IMR-5 cells treated for 4 h with 1 μM MLN8237 (red line) and DMSO (blue line) (n=2 independent experiments). b. pH3S10 ChIP at indicated loci in S phase synchronized IMR-5 cells treated for 4 h with 1 μM MLN8237. IgG control was used as control for antibody specificity. Data are presented as mean of technical triplicates Data representative of 3 independent experiments with similar results c. Metagene plot of ChIP-Rx signal for histone H3.3 and pH3S10 in S phase-synchronized IMR-5 cells treated for 4 h with MLN8237 (1 μM) or DMSO. The graph is centered on the first nucleosome (“+1 dyad”) downstream of the TSS for N=14,340 genes. (n=2 independent replicates). d. Browser tracks of MYCN, total RNAPII, H3.3 and pH3S10 of ChIP-Rx at a MYCN high (left) and low (right) bound locus. Nucleosome-free zone is indicated in grey. e. Metagene plot of ChIP-Rx signal for histone H3 and histone H3.3 in S phase-synchronized IMR-5 cells treated for 4 h with 1 μM MLN8237 or DMSO. The signal is centered on the first nucleosome (“+1 dyad”) located downstream of the TSS for N=14,340 genes (n=3 independent experiments). f. Immunoblot of asynchronous SH-EP and SH-EP MYCN cells. Vinculin was used as loading control. Data representative of 3 independent experiments with similar results.
Extended Data Figure 3
Extended Data Figure 3. Aurora-A impacts RNAPII, splicing and R loop formation in S phase
a. Metagene plot of all expressed genes (N=17,533) illustrating distribution of ChIP-Rx signal of total RNAPII within transcribed regions in S phase-synchronized IMR-5 cells treated for 4 h with 1 μM MLN8237, 1 μM MK5108 or solvent control (DMSO) (n=2 independent experiments). b. 2D Kernel density plot showing RNAPII traveling ratio in S phase-synchronized cells treated for 4 h with MLN8237 (1 μM) and in control (DMSO) cells (n=2 independent experiments). c. Metagene plot of ChIP-Rx signal for RNAPII pSer2 in S phase-synchronized IMR-5 cells treated for 2 h with MLN8237 (1 μM), MK5108 (1 μM) or DMSO. The signal is centered on the first nucleosome (“+1 dyad”) located within 300 nt downstream of the TSS for n=14,340 genes (n=2 independent replicates). d. Browser tracks of MYCN, total RNAPII and RNAPII pSer2 of ChIP-Rx at FASN gene. e. Immunoblots of IMR-5 cells that were synchronized for the indicated cell cycle phase and treated with Pladienolide B (PlaB;1 μM), MLN8237 (1 μM), MK5108 (1 μM) or DMSO (4 h). Actin was used as loading control. Data representative of 3 independent experiments with similar results. f. Definition of read categories; blue lines show where reads were mapped to; grey categories (exonic, spliced) reads represent mature mRNA, blue reads categories (exon-intron, intronic) represents non-spliced pre-mRNA, red categories (TSS, TES, TES-RT, intergenic) represents RNA without coding sequence. TSS: Transcription start site, TES: transcription end site. g. Diagram showing the setup of the 4sU-sequencing experiments in S phase-synchronized IMR-5 cells. h. Mean percentage of reads recovered in each category described in (f) (n=3 independent experiments). All treatments (PlaB, MK, MLN) significantly reduce the percentage of spliced reads relative to the “DMSO” control (p<1.0e-15 using paired two-tailed t test and Wilcoxon matched-pairs signed rank test). i. DRIP using S9.6 antibody after 8 h of 1 μM MLN8237 or 1 μM PlaB treatment. Incubation with RNaseH1 and IgG were used as controls. Shown is the mean of technical triplicates. Data representative of 2 independent experiments with similar results. j. (Left) DRIP using S9.6 antibody after 48 h of siAurora-A treatment. Shown is the mean of technical triplicates. (Right) Immunoblot of siRNA-transfected IMR-5 cells. Vinculin was used as loading control. Data representative of 2 independent experiments with similar results.
Extended Data Figure 4
Extended Data Figure 4. Characterization of DNA replication and R-loop formation
a. Quantification of fork progression of SH-EP and SH-EP MYCN cells pretreated for 3 h with 100 nM or 1 μM MLN8237, 1 μM of AZD6738 or a combination (100 nM MLN8237 and 1 μM AZD6738). P-values were calculated using unpaired two-tailed t-test comparing two conditions (n≥168 fibers per condition were examined over 2 independent experiments). b. Annexin-V/PI FACS of IMR-5 or IMR-5 cells with inducible Aurora-A WT and T217D. After pre-treatment for 24 h with doxycycline to induce Aurora-A WT and T217D, cells were treated for 48 h with MLN8237 (100 nM), AZD6738 (1 μM) or both. Shown is the mean ± S.D. (n=3 independent experiments). c. Annexin-V/PI FACS of IMR-5 treated for 48 h with MLN8237 (100 nM), CHIR-124 (1 μM) or both. Shown is the mean ± S.D. (n=3 independent experiments). d. DNA-RNA-Immunoprecipitation (DRIP) using S9.6 antibody of IMR-5 cells expressing a doxycycline inducible HA-RNaseH1. After 24 h doxycycline treatment, cells were treated for 8 h with 1 μM MLN8237. Incubation with RNaseH1 and IgG were used as controls for non-specific chromatin binding. Shown is the mean of technical triplicates. Data representative of 2 independent experiments with similar results. Insert shows expression of HA-RNaseH1 in asynchronous IMR-5 cells upon doxycycline treatment for 24 h. Vinculin (VCL) was used as loading control. Data representative of 3 independent experiments with similar results. e. Metagene plot of ChIP-Rx signal for total RNAPII and H3.3 in S phase-synchronized RNaseH1-IMR-5 cells treated for 24 h with doxycycline to induce RNaseH1 expression or EtOH (as control). Data show mean for N=3,731 genes. The signal is centered on the first nucleosome (“+1 dyad”) located within 300 nt downstream of the TSS (n=2 independent experiments). f. Browser tracks of MYCN and total RNAPII of ChIP-Rx in (e) at FASN and NCL gene. g. Metagene plot of ChIP-Rx signal for RNAPII pSer2 in S phase-synchronized RNaseH1-IMR-5 cells treated for 24 h with doxycycline (to induce RNaseH1 expression) or EtOH (as control). Data shown for n=14,340 genes. The signal is centered on the first nucleosome ("+1 dyad") located within 300 nt downstream of the TSS for 14,340 genes (n=2 independent experiments). h. Quantification of PLA signals between RNAPII and PCNA in asynchronous RNaseH1-IMR-5 cells treated for 24 h with doxycycline to induce RNaseH1 expression. Each dot represents mean PLA signal of all cells in one well compared to solvent control. Shown is the mean ± S.D.. P-value was calculated using unpaired two-tailed t-test relative to DMSO control (n=3 independent experiments). i. Boxplot showing intensity of pKAP1 staining in mitotic cells upon the treatment with the indicated drugs (8 h) and induction of RNaseH1 expression for 24 h. P-value was calculated using two-tailed t-test between EtOH and Dox of each condition (n≥50 cells per condition were examined over 2 independent experiment).
Extended Data Figure 5
Extended Data Figure 5. Treatment is not toxic and tumor specific
a. Boxplot showing the concentration of indicated inhibitors in the tumor tissue of mice treated for 24 h or 5 days. N=4 mice (control, 24 h treatment), 5 mice (5 days treatment). b. Relative changes in body weight of mice treated with MLN8237 and AZD6738 compared to mice treated with vehicle control. Shown is the mean ± S.D. N=42 mice (control), 43 mice (treated). c. Staining of tumor tissue with S9.6 incubated with different RNases to document specificity of S9.6. staining for R-loops (n=1 section for each experimental condition). d. Histology of proliferative gut tissue in untreated (top) and treated (bottom) mice showing H&E, Ki-67 and cleaved caspase 3 staining. N=2 mice (control), 3 mice treated). e. Representative MRI as well as sections of a tumor treated with a combination of MLN8237 and olaparib (N=3 animals were evaluated). f. MRI sections of the two long term-surviving mice at day 0 and after 7 days of treatment with the combination of AZD6738 (30 mg/kg) and MLN8237 (15 mg/kg). Dashed white lines indicate tumor circumference. g. P-values calculated using Mantel-Cox log-rank test comparing the survival of different groups shown in Figure 6c.
Extended Data Figure 6
Extended Data Figure 6. Therapeutic efficacy in Patient-derived xenograft models
a. Histology of representative tumor sections of MYCN-amplified PDX models treated as indicated. AZD6738 was administered at 50 mg/kg every day and MLN8237 at 7.5 mg/kg on a 5 days on, 2 days off schedule. Shown are stainings from tumors recovered after treatment for 14 days. Each group comprises three animals. b. Box plot showing quantification of R-loop-, γH2AX- and cleaved caspase 3-positive cells in tumor sections. P-values were calculated using unpaired two-tailed t-test using Welch’s correction (n≥9 sections from animals described in panel (a) were evaluated). c. Relative changes in tumor volume of four MYCN non-amplified PDX models upon treatment with the indicated inhibitors. Shown is the mean ± S.E.M. N indicates the animal number for each experimental cohort. P-values comparing control and combination (indicated with a black dashed line) were calculated using unpaired two-sided t-test.
Extended Data Figure 7
Extended Data Figure 7. Aurora-A/ATR inhibition engages the immune system
a. GSEA signatures showing response of a hallmark gene set indicating Interferon gamma response in the TH-MYCN (top) and a PDX (bottom) model. b. (Top): Representative pictures by flow cytometry showing cell gating. (Bottom): Populations of CD45+ immune cells in the tumor microenvironment after treatment of TH-MYCN mice with the combination of AZD6738 (25 mg/kg) and MLN8237. Shown is the mean ± S.E.M.. Significance was calculated using unpaired two-tailed t-test (N=4 animals from each condition were evaluated). c. Histology of representative tumor sections showing NKp46-positive cells and pSTAT1 in tumors of TH-MYCN mice treated with combined Aurora-A/ATR inhibition. N=4 mice (control, 24 h treatment), 5 mice (5 days treatment). d. Relative changes in tumor volume of subcutaneous xenografts in nude mice after treatment with vehicle or the combination of MLN8237 and AZD6738 (25 mg/kg). Shown is the mean ± S.E.M. (N=5 animals per group). e. Bar graph showing the survival of allograft mice treated with MLN8237 and AZD6738. Shown is the mean ± S.E.M. (N=4 animals per group).
Figure 1
Figure 1. Aurora-A controls histone H3 phosphorylation in S phase.
a. (Top): Immunoblots of indicated proteins from S phase-synchronized IMR-5 cells that were treated for 4 h with 100 μM 10058-F4 or DMSO. (Bottom): Quantitation of relative levels of chromatin-bound proteins. Shown is the mean ± standard deviation (S.D.). P-values were calculated using paired two-tailed t-test relative to DMSO (n=3; unless specified otherwise, n indicates the number of independent biological replicates). b. Immunofluorescence staining of pH3S10, EdU, Cyclin B1 and Hoechst staining (Top): Pictures illustrating pH3S10 staining in each cell cycle phase. Scale bar is 5 μm. (Bottom): Quantification of pH3S10 staining in IMR-5 cells treated for 8 h with MLN8237 (100 nM) relative to control (DMSO) cells; each grey dot represents a cell. In S and G2 phase number of spots and in mitotic cells intensity of pH3S10 signal compared to DMSO is shown. Shown is the mean ± S.D. (n≥137 cells examined over 3 independent experiments). c. Quantification of pH3S10 staining in IMR-5 cells treated for 8 h with 100 nM MLN8237 (data are the same as in Figure 1b) or 100 nM AZD1152 relative to control (DMSO) cells; each grey dot represents a cell. In S and G2 phase number of spots and in mitotic cells intensity of pH3S10 signal compared to DMSO is shown. Shown is the mean ± S.D. (n≥390 cells were examined over 3 independent experiments). d. Metagene plot of ChIP-Rx signal for histone H3.3 and pH3S10 in S phase-synchronized IMR-5 cells treated for 4 h with 1 μM MLN8237 or DMSO. The signal is centered on the first nucleosome (“+1 dyad”) located downstream of the TSS. Shading is ± S.E.M for 3,000 expressed genes with highest MYCN promoter occupancy. (n=3). e. Metagene plot as in (d) for 3,000 expressed genes with lowest MYCN promoter occupancy. f. pH3S10 (left) and histone H3.3 (right) ChIP at indicated loci after 4 h incubation with MLN8237 (1 μM) in SH-EP and in SH-EP MYCN cells synchronized in S phase. Shown is the mean ± S.D. of technical triplicates from a representative experiment (n=2).
Figure 2
Figure 2. Aurora-A inhibition induces transcription-replication conflicts.
a. Metagene plot of ChIP-Rx signal for RNAPII pSer2 in S phase-synchronized IMR-5 cells treated for 4 h with MLN8237 (1 μM), MK5108 (1 μM) or DMSO. The signal is centered on the first nucleosome (“+1 dyad”) located within 300 nt downstream of the TSS. Data show mean +/- S.E.M. as a shade for the 3,000 expressed genes with highest MYCN promoter occupancy (n=2). b. Metagene plot as in (a) filtered for the 3,000 expressed genes with lowest MYCN promoter occupancy. c. Bin plots of average RNAPII pSer2 ChIP-Rx occupancy around the first exon-intron boundary (+/- 200 nt) from S phase-synchronized IMR-5 cells treated for 2 h with MLN8237 (1 μM) or DMSO. Shown is the mean ± S.E.M for the 3,000 genes in each bin. Genes were ordered by MYCN occupancy (n=2). d. DNA-RNA-Immunoprecipitation (DRIP) using S9.6 antibody, detecting R-loops at the indicated loci after MLN8237 (1 μM, 8 h) treatment. Incubation with RNaseH1 and IgG were used as controls for non-specific chromatin binding. Shown is the mean ± S.D. of technical triplicates from a representative experiment (n=3). e. DNA-RNA-Immunoprecipitation (DRIP) using S9.6 antibody, indicating R-loops at the indicated loci after 8 h of 1 μM MLN8237 or 1 μM AZD1152 treatment. Incubation with RNaseH1 and IgG were used as controls for non-specific chromatin binding. Shown is the mean ± S.D. of technical triplicates from a representative experiment (n=2). f. Proximity Ligation Assay between RNAPII and PCNA in asynchronous IMR-5 cells treated for 8 h with the indicated inhibitors (MLN8237, MK5108 (1 μM), NVP-2 (200 nM) or Flavopiridol (FP; 200 nM)). Control shows primary antibodies only in cells treated with 1 μM MLN8237. (Top): Example pictures of PLA in different conditions. (Bottom): Quantification of PLA signals. Each dot represents mean PLA signal of all cells in one well compared to solvent control. Shown is the mean ± S.D.. P-values were calculated comparing treatment to DMSO using unpaired two-tailed t-test. White line indicates 5 μm (n≥6).
Figure 3
Figure 3. Aurora-A/ATR inhibition reduces replication fork progression.
a. pRPA S33 staining in IMR-5 cells treated for 8 h with indicated concentration of Aurora-A inhibitor. Shown is the mean intensity in each condition ± S.D.; each dot represents one cell (n≥73 cells examined over 3 independent experiments). Color indicates significant difference of mean from control (blue: p=0.0004; red: p<0.0001, DMSO vs. MLN 5 μM p<1.0e-15, DMSO vs. MLN 10 μM p=1.9e-13). b. Immunoblots of cell cycle synchronized IMR-5 cells treated for 4 h (S phase) or 8 h (G2/M phase) with MLN8237 (MLN) and AZD6738 (AZD, 1μM) or DMSO as control. UV light was used as positive control. Vinculin was used as loading control. Arrow marks specific band while (*) indicate non-specific bands (n=3). c. Fork progression speed in IMR-5 cells treated for 3 h with 100 nM MLN8237, 1 μM of AZD6738 or a combination of both. Experimental setup is shown on top. Cells were incubated 20 min with CldU, followed by incubation for 1 h with IdU. Gemcitabine (300 nM) was used as positive control. P-value was calculated using unpaired two-tailed t-test comparing two conditions (n≥142 fibers were examined over 2 independent experiments). d. Representative example pictures of fibers treated as and quantified in (c). e. Quantification of PLA signal between RNAPII and PCNA in asynchronous IMR-5 cells treated for 8 h with 10 μM Olaparib. Each dot represents mean PLA signal of all cells in one well compared to solvent control. Shown is the mean ± S.D.. P-value was calculated compared to DMSO using unpaired two-tailed t-test (n=4). f. Quantification of fork progression measured by fiber assays of IMR-5 cells pretreated for 3 h with 100 nM MLN8237, 10 μM of Olaparib or the combination. P-values were calculated using unpaired two-tailed t-test (n≥128 fibers were examined over 2 independent experiments). g. Representative example pictures of fibers treated as and quantified in (c).
Figure 4
Figure 4. Aurora-A/ATR inhibition induces DNA damage.
a. High-content microscopy-based analysis of MYCN-amplified NGP cells treated for 8 h with 100 nM MLN8237, 1 μM AZD6738 or a combination and assessed for EdU incorporation, γH2AX, pKAP1 and pH3S10. Each dot represents a single cell and is color-coded according to mean fluorescent intensity (n≥3,837 cells were examined over 3 independent experiments). A.U. arbitrary units. Quantification is shown in (b). b. Quantification of γH2AX (upper panel) and pKAP1 (lower panel) signals shown in (a) (n≥3,837 cells were examined over 3 independent experiments). c. Annexin-V/PI FACS of the indicated cell lines (MYCN non-amplified: SH-EP, SK-NAS, SH-SY5Y; MYCN-amplified: IMR-5, NGP, IMR-32) treated for 48 h with DMSO, MLN8237 (100 nM), AZD6738 (1 μM) or both. Shown is the mean ± S.D., p-values were calculated using paired two-tailed t-test (n=3). d. DCP1A (left) and EDC4 (right) ChIP at indicated loci after 4 h of 100 nM or 1 μM MLN8237 treatment in S phase synchronized IMR-5 cells. IgG control was used as control for antibody specificity. Data are presented as mean ± S.D. of technical triplicates from a representative experiment (n=3).
Figure 5
Figure 5. Treatment responses to combined Aurora-A/ATR inhibition.
a. Representative sections of tumors of untreated, 24 h treated or 5 days treated TH-MYCN mice showing haemotoxylin and eosin (H&E), Ki67, R-loops, γH2AX, 53BP1, pKAP1 and cleaved caspase 3. The second column on the cleaved caspase staining shows kidney tissue of tumor-bearing mice treated for the same time. Each group has a minimum of four animals. b. Box plots show quantification of R-loop-, γH2AX-, 53BP1-, pKAP1- and cleaved caspase 3-positive cells in tumor sections. P-values were calculated using unpaired two-tailed t-test using Welch’s correction (n≥12 sections from at least 4 animals from each condition were evaluated). c. Representative sections of tumors of untreated, 24 h or 5 days treated TH-MYCN mice showing H3S10 phosphorylation. Arrows mark mitotic cells. The second row shows staining of adjacent kidney tissue. Each group has a minimum of four animals. d. Relative number of pH3S10-positive non-mitotic (left) and mitotic cells (right) shown in panel b. P-value was calculated using an unpaired two-tailed t-test using Welch’s correction (n≥12 sections from at least 4 animals were evaluated for each condition).
Figure 6
Figure 6. Therapeutic efficacy of combined Aurora-A/ATR inhibitor treatment.
a. Representative MRI sections of mice at day 0 and day 7 of treatment with vehicle, MLN8237 (15 mg/kg), AZD6738 (25 mg/kg) or both. Dashed white lines indicate tumor circumference. b. Waterfall plot showing relative changes in tumor volume during the first seven days of the beginning of treatment with indicated drugs. Control animals marked with hash (#) show measurement at day 4. Mice which survived the treatment for up to 150 days are marked with an asterisk (*). c. Kaplan Meier survival curve of TH-MYCN mice treated as indicated. AZD6738 was administered at 25-30 mg/kg every day and MLN8237 at 15 mg/kg on a 5 days on, 2 days off schedule. Shaded area indicates duration of the combination treatment (ended at 32 days, 56 doses) (n=8 animals for MLN8237 + AZD6738 (30 mg/kg), n=4 for all other experimental cohorts). P-values are shown in Extended Data Figure 5g.

References

    1. Dang CV. MYC on the path to cancer. Cell. 2012;149:22–35. doi: 10.1016/j.cell.2012.03.003. - DOI - PMC - PubMed
    1. Soucek L, et al. Modelling Myc inhibition as a cancer therapy. Nature. 2008;455:679–683. doi: 10.1038/nature07260. - DOI - PMC - PubMed
    1. Rickman DS, Schulte JH, Eilers M. The Expanding World of N-MYC-Driven Tumors. Cancer Discov. 2018;8:150–163. doi: 10.1158/2159-8290.CD-17-0273. - DOI - PubMed
    1. Walz S, et al. Activation and repression by oncogenic MYC shape tumour-specific gene expression profiles. Nature. 2014;511:483–487. doi: 10.1038/nature13473. - DOI - PMC - PubMed
    1. Sabo A, et al. Selective transcriptional regulation by Myc in cellular growth control and lymphomagenesis. Nature. 2014;511:488–492. doi: 10.1038/nature13537. - DOI - PMC - PubMed

Additional References to Methods

    1. Olson CM, et al. Pharmacological perturbation of CDK9 using selective CDK9 inhibition or degradation. Nat Chem Biol. 2018;14:163–170. doi: 10.1038/nchembio.2538. - DOI - PMC - PubMed
    1. Chao SH, et al. Flavopiridol inhibits P-TEFb and blocks HIV-1 replication. The Journal of biological chemistry. 2000;275:28345–28348. doi: 10.1074/jbc.C000446200. - DOI - PubMed
    1. Michelena J, et al. Analysis of PARP inhibitor toxicity by multidimensional fluorescence microscopy reveals mechanisms of sensitivity and resistance. Nat Commun. 2018;9:2678. doi: 10.1038/s41467-018-05031-9. - DOI - PMC - PubMed
    1. Ginno PA, Lott PL, Christensen HC, Korf I, Chedin F. R-loop formation is a distinctive characteristic of unmethylated human CpG island promoters. Mol Cell. 2012;45:814–825. doi: 10.1016/j.molcel.2012.01.017. - DOI - PMC - PubMed
    1. Boguslawski SJ, et al. Characterization of monoclonal antibody to DNA.RNA and its application to immunodetection of hybrids. Journal of immunological methods. 1986;89:123–130. - PubMed

Publication types

Substances