. 2021 Jul;134(7):2181-2196.
doi: 10.1007/s00122-021-03815-0. Epub 2021 Mar 25.

Genomic prediction models trained with historical records enable populating the German ex situ genebank bio-digital resource center of barley (Hordeum sp.) with information on resistances to soilborne barley mosaic viruses

Affiliations

Genomic prediction models trained with historical records enable populating the German ex situ genebank bio-digital resource center of barley (Hordeum sp.) with information on resistances to soilborne barley mosaic viruses

Maria Y Gonzalez et al. Theor Appl Genet. 2021 Jul.

Abstract

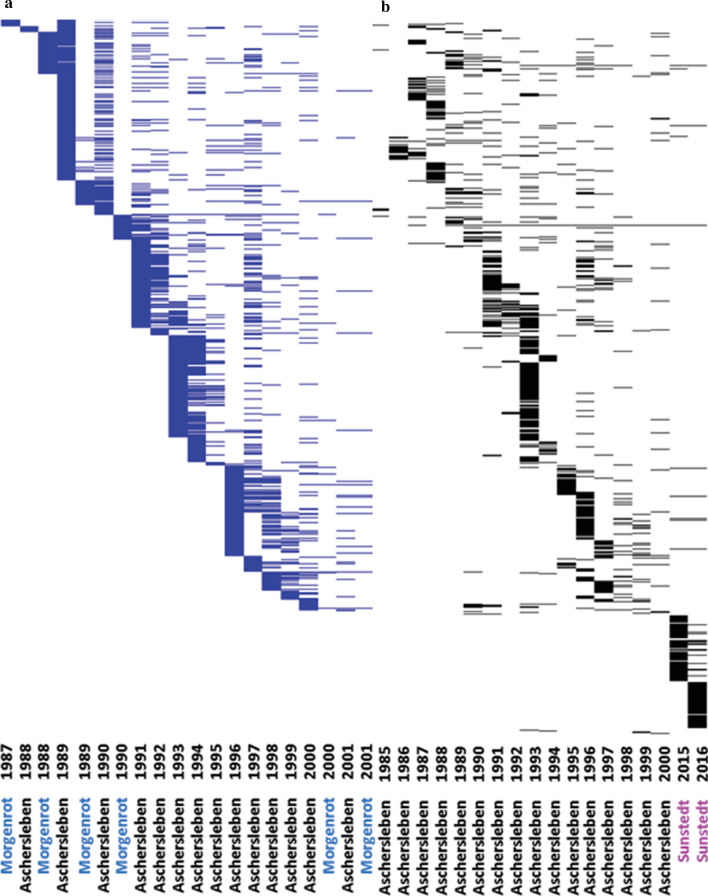
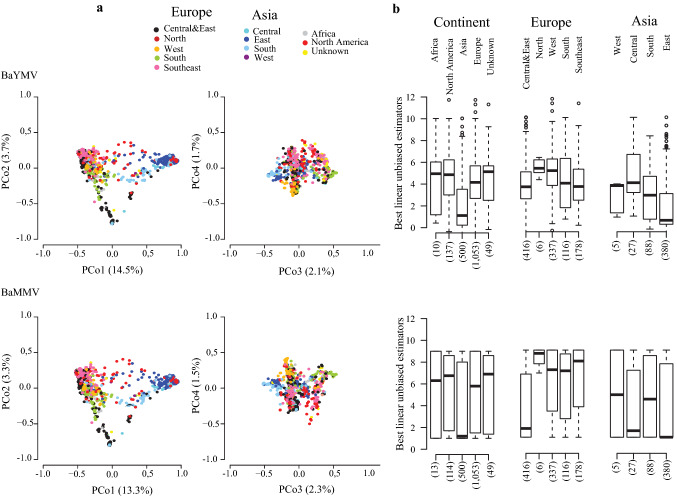
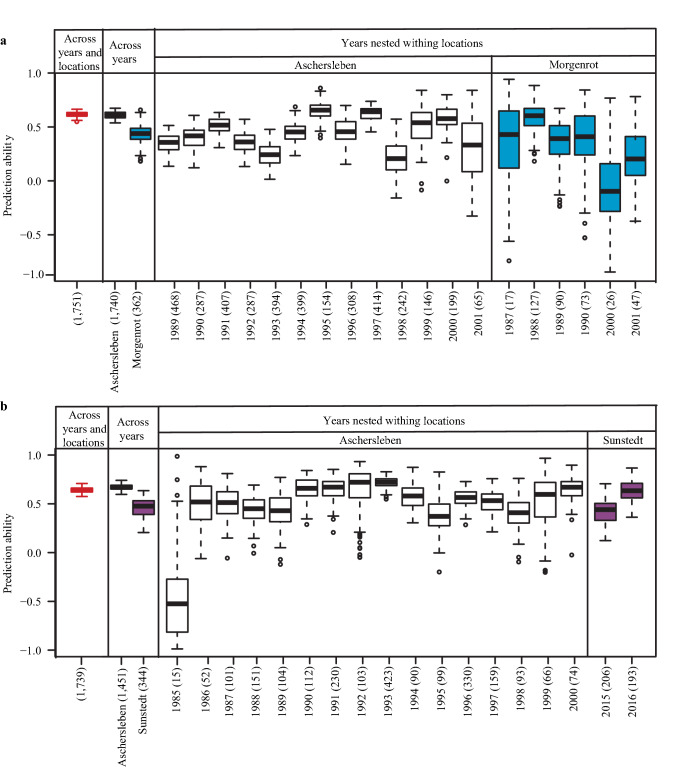
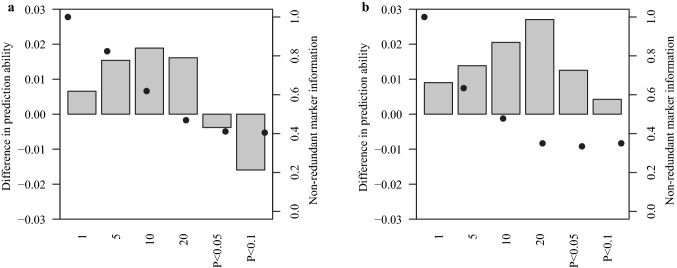
Genomic prediction with special weight of major genes is a valuable tool to populate bio-digital resource centers. Phenotypic information of crop genetic resources is a prerequisite for an informed selection that aims to broaden the genetic base of the elite breeding pools. We investigated the potential of genomic prediction based on historical screening data of plant responses against the Barley yellow mosaic viruses for populating the bio-digital resource center of barley. Our study includes dense marker data for 3838 accessions of winter barley, and historical screening data of 1751 accessions for Barley yellow mosaic virus (BaYMV) and of 1771 accessions for Barley mild mosaic virus (BaMMV). Linear mixed models were fitted by considering combinations for the effects of genotypes, years, and locations. The best linear unbiased estimations displayed a broad spectrum of plant responses against BaYMV and BaMMV. Prediction abilities, computed as correlations between predictions and observed phenotypes of accessions, were low for the marker-assisted selection approach amounting to 0.42. In contrast, prediction abilities of genomic best linear unbiased predictions were high, with values of 0.62 for BaYMV and 0.64 for BaMMV. Prediction abilities of genomic prediction were improved by up to ~ 5% using W-BLUP, in which more weight is given to markers with significant major effects found by association mapping. Our results outline the utility of historical screening data and W-BLUP model to predict the performance of the non-phenotyped individuals in genebank collections. The presented strategy can be considered as part of the different approaches used in genebank genomics to valorize genetic resources for their usage in disease resistance breeding and research.


Conflict of interest statement

All authors declare that they have no conflict of interest.

Figures

Fig. 1
Fig. 1
Layout of historical records of susceptibilities to barley yellow mosaic viruses: a BaYMV (blue) and b BaMMV (black) of 2083 winter barley accessions, which were phenotyped in Aschersleben, Morgenrot and Sunstedt during the period 1985–2016. The y-axis corresponds to the accessions, sorted by the first year in that a particular accession was tested (color figure online)
Fig. 2
Fig. 2
Genetic and phenotypic diversity as a function of geographic origins, presented for 2083 accessions evaluated for susceptibilities to mosaic viruses BaYMV (upper half) and BaMMV (lower half) in the period 1985–2016 at up to 2 locations. a Biplots taking into account the first four principal coordinates (PCo) from a PCo analysis performed on the Rogers’ distance matrix among accessions. The different colors represent the varied geographic origins according to the passport data of accessions. b Distributions of the best linear unbiased estimations (BLUEs) of accessions according to their geographic origins. The numbers in brackets refer to the total number of accessions in each geographic origin (color figure online)
Fig. 3
Fig. 3
Cross-validated prediction abilities of genome-wide predictions using GBLUP for a BaYMV and b BaMMV susceptibility estimated based on three data levels (i) across locations and years, (ii) across years, and (iii) years nested within locations. The numbers in brackets refer to the total number of accessions in each data set
Fig. 4
Fig. 4
Cross-validated prediction abilities for a BaYMV and b BaMMV susceptibilities considering six different significant thresholds for associated markers: (i) the first, (ii) first 5, (iii) first 10, and (iv) first 20 most significant SNPs, as well as SNPs whose associations were significant at (v) P-value < 0.05 and (vi) P-value < 0.1
Fig. 5
Fig. 5
Average differences in cross-validated prediction abilities between GBLUP and W-BLUP for a BaYMV and b BaMMV susceptibilities considering six different significant thresholds for associated markers: (i) the first, (ii) first 5, (iii) first 10, and (iv) first 20 most significant SNPs, as well as SNPs whose associations were significant at (v) P-value < 0.05 and (vi) P-value < 0.1. Black dots indicate the average percentage of the total information provided by associated markers which are non-redundant (color figure online)
Fig. 6
Fig. 6
Comparison among genome-wide prediction using W-BLUP and marker-assisted selection (MAS) for non-phenotyped winter barley accessions maintained at the IPK genebank. W-BLUP based on first 10 SNPs for BaYMV, and first 20 SNPs for BaMMV having the lowest P-values for associations during GWAS. MAS stand for a the highest associated marker for BaYMV susceptibility and for the most associated markers at chromosomes 3H b and 4H c for BaMMV susceptibility. Each diagram was divided into I-IV quadrants, each quadrant included the respective percentage of accessions. Culling levels defined by vertical lines separated the 10% less susceptible genotypes detected by genomic prediction. Culling levels delineated by horizontal lines stand for the population mean, and separated the susceptible accessions (upper) from the less susceptible ones (lower) according to allelic effects in MAS

References

    1. Arruda MP, Lipka AE, Brown PJ, Krill AM, Thurber C, Brown-Guedira G, Dong Y, Foresman BJ, Kolb FL. Comparing genomic selection and marker-assisted selection for Fusarium head blight resistance in wheat (Triticum aestivum L.) Mol Breed. 2016;36:84. doi: 10.1007/s11032-016-0508-5. - DOI
    1. Barton NH, Etheridge AM, Véber A. The infinitesimal model: definition, derivation, and implications. Theor Popul Biol. 2017;118:50–73. doi: 10.1016/j.tpb.2017.06.001. - DOI - PubMed
    1. Benjamini Y, Hochberg Y. Controlling the false discovery rate: a practical and powerful approach to multiple testing. J R Stat Soc Series B (Methodol) 1995;57:289–300. doi: 10.1111/j.2517-6161.1995.tb02031.x. - DOI
    1. Bernal-Vasquez AM, Utz HF, Piepho HP. Outlier detection methods for generalized lattices: a case study on the transition from ANOVA to REML. Theor Appl Genet. 2016;129:787–804. doi: 10.1007/s00122-016-2666-6. - DOI - PubMed
    1. Bernardo R. Breeding for quantitative traits in plants. Woodbury: Stemma Press; 2010.

Substances

Supplementary concepts

LinkOut - more resources