. 2021 Mar 20;7(1):veab020.
doi: 10.1093/ve/veab020. eCollection 2021 Jan.

The evolutionary dynamics of endemic human coronaviruses

Affiliations

The evolutionary dynamics of endemic human coronaviruses

Wendy K Jo et al. Virus Evol. .

Abstract

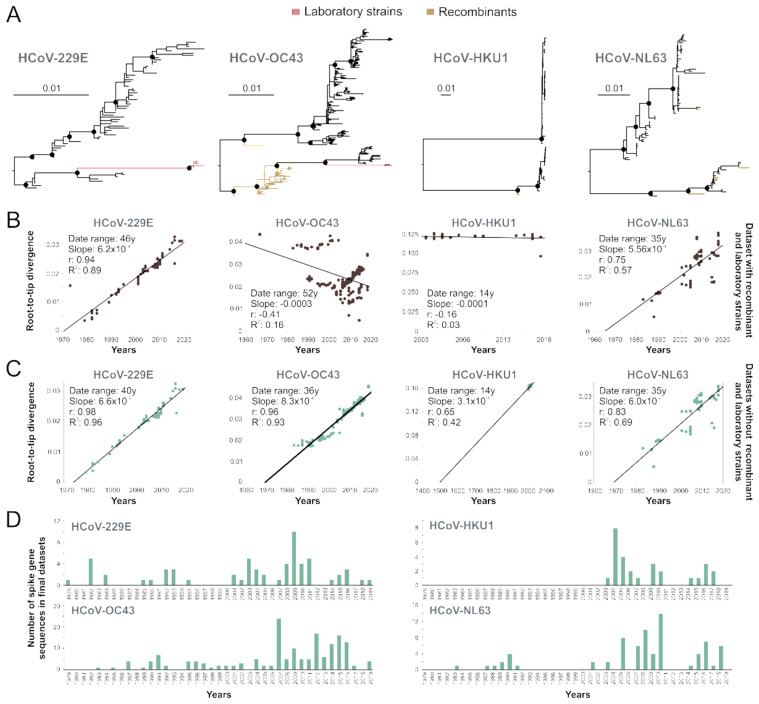
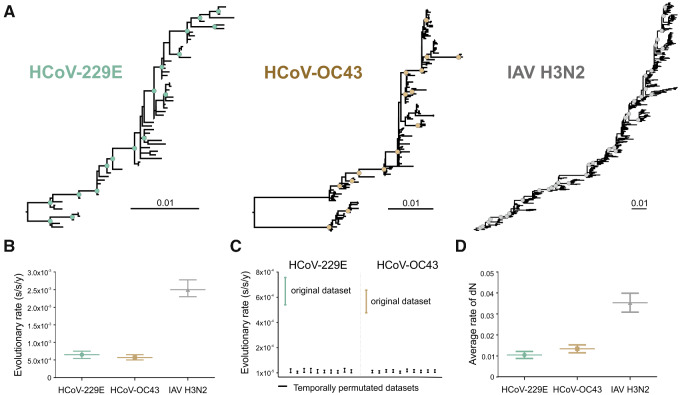
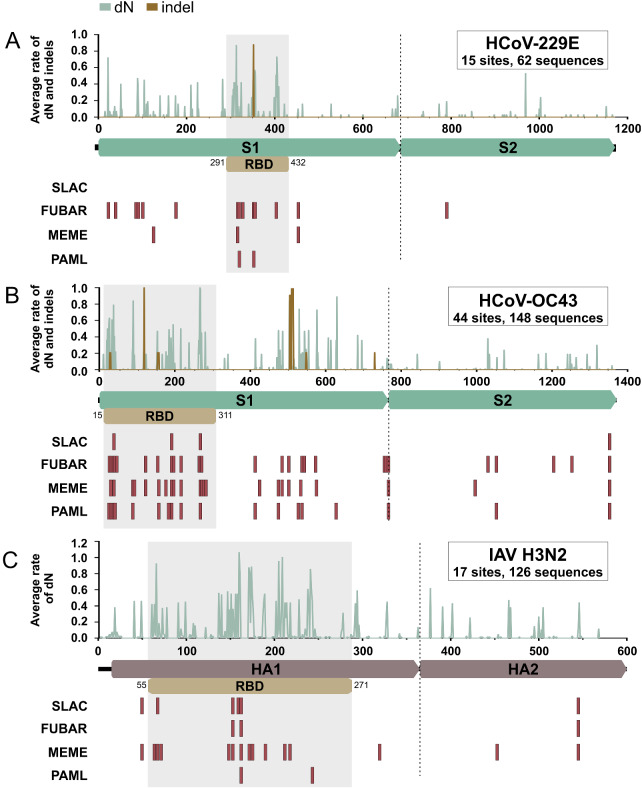
Community protective immunity can affect RNA virus evolution by selecting for new antigenic variants on the scale of years, exemplified by the need of annual evaluation of influenza vaccines. The extent to which this process termed antigenic drift affects coronaviruses remains unknown. Alike the severe acute respiratory syndrome coronavirus-2 (SARS-CoV-2), seasonal human coronaviruses (HCoV) likely emerged from animal reservoirs as new human pathogens in the past. We therefore analyzed the long-term evolutionary dynamics of the ubiquitous HCoV-229E and HCoV-OC43 in comparison with human influenza A virus (IAV) subtype H3N2. We focus on viral glycoprotein genes that mediate viral entry into cells and are major targets of host neutralizing antibody responses. Maximum likelihood and Bayesian phylogenies of publicly available gene datasets representing about three decades of HCoV and IAV evolution showed that all viruses had similar ladder-like tree shapes compatible with antigenic drift, supported by different tree shape statistics. Evolutionary rates inferred in a Bayesian framework were 6.5 × 10⁻⁴ (95% highest posterior density (HPD), 5.4-7.5 × 10⁻⁴) substitutions per site per year (s/s/y) for HCoV-229E spike (S) genes and 5.7 × 10⁻⁴ (95% HPD, 5-6.5 × 10⁻⁴) s/s/y for HCoV-OC43 S genes, which were about fourfold lower than the 2.5 × 10⁻³ (95% HPD, 2.3-2.7 × 10⁻³) s/s/y rate for IAV hemagglutinin (HA) genes. Coronavirus S genes accumulated about threefold less (P < 0.001) non-synonymous mutations (dN) over time than IAV HA genes. In both IAV and HCoV, the average rate of dN within the receptor binding domains (RBD) was about fivefold higher (P < 0.0001) than in other glycoprotein gene regions. Similarly, most sites showing evidence for positive selection occurred within the RBD (HCoV-229E, 6/14 sites, P < 0.05; HCoV-OC43, 23/38 sites, P < 0.01; IAV, 13/15 sites, P = 0.08). In sum, the evolutionary dynamics of HCoV and IAV showed several similarities, yet amino acid changes potentially representing antigenic drift occurred on a lower scale in endemic HCoV compared to IAV. It seems likely that pandemic SARS-CoV-2 evolution will bear similarities with IAV evolution including accumulation of adaptive changes in the RBD, requiring vaccines to be updated regularly, whereas higher SARS-CoV-2 evolutionary stability resembling endemic HCoV can be expected in the post-pandemic stage.

Keywords: evolutionary rate; genetic variability; human coronaviruses; mutations; vaccine.


Figures

Figure 1.
Figure 1.
Phylogeny of endemic human coronaviruses. (A) ML phylogenies of complete glycoprotein genes of HCoV-229E, HCoV-OC43, HCoV-HKU1, and HCoV-NL63. Circles at nodes indicate support of ≥80 SH-alrt/≥95 UFBoot for major clades. Scale bars indicate number of nucleotide substitutions per site. (B) Linear regression of root-to-tip genetic distances over time in years of whole datasets. (C) Linear regression plots of HCoV datasets excluding recombinant sequences and laboratory strains. The date range, slope (rate), correlation coefficient, and R2 are shown in the graph. (D) Number of HCoV spike gene sequences per year after exclusion of recombinant and laboratory strains retrieved from NCBI (detailed in Supplementary Table S1).
Figure 2.
Figure 2.
Linear regression plots of root-to-tip divergence over time of major sub-lineages of HCoV-HKU1. Circles at nodes in the ML phylogeny relying on complete spike genes indicate support of ≥80 SH-alrt/≥95 UFBoot for major clades. Scale bars indicate number of nucleotide substitutions per site. Linear regression of root-to-tip genetic distances over time in years after exclusion of recombinant sequences (detailed in Table S1). The date range, slope (rate), correlation coefficient (r), and R2 are shown in the graph.
Figure 3.
Figure 3.
Evolution of HCoV-229E , HCoV-OC43 and IAV H3N2 over time. (A) Maximum likelihood phylogenies relying on complete viral glycoprotein datasets. Circles at nodes indicate support of ≥80 SH-alrt/≥95 UFBoot for major clades. Scale bars indicate number of nucleotide substitutions per site. Sequences used are detailed in Supplementary Table S1. (B) Evolutionary rates in substitution per site per year (s/s/y) with 95 per cent HPD intervals inferred in a Bayesian framework relying on complete viral glycoprotein datasets. (C) Comparison between the 95 per cent HPD intervals of the evolutionary rates of the HCoV-229E S (teal) final dataset with date-randomized datasets (n = 10, black), and of the HCoV-OC43 S (mustard) final dataset with date-randomized datasets (n = 10, black). (D) Average rate of non-synonymous substitutions (dN ± SEM) for HCoV-229E S, HCoV-OC43 S, and IAV H3N2 HA from 2001 to 2019.
Figure 4.
Figure 4.
Mutations and sites under positive selection in endemic HCoV and IAV glycoprotein genes. (A–C) Average rate of non-synonymous mutations (dN) and indel mutations at each position along the glycoprotein genes of HCoV-229E, HCoV-OC43, and IAV H3N2 are depicted in green (dN) and brown (indel). Sites under positive selection are depicted as red bars below gene sketches. The HCoV-229E RBD position is based on GenBank accession no. MH048989 according to Li et al. (2019). The HCoV-OC43 RBD position is based on GenBank accession no. AY903460 according to Hulswit et al. (2019). The IAV H3N2 RBD position is based on GenBank accession no. CY173187 according to DuBois et al. (2011).

References

    1. Al-Khannaq M. N. et al. (2016) ‘ Diversity and Evolutionary Histories of Human Coronaviruses NL63 and 229E Associated with Acute Upper Respiratory Tract Symptoms in Kuala Lumpur, Malaysia’, The American Journal of Tropical Medicine and Hygiene, 94: 1058–64. - PMC - PubMed
    1. Al Khatib H. A. et al. (2019) ‘ Epidemiological and Genetic Characterization of pH1N1 and H3N2 Influenza Viruses Circulated in MENA Region during 2009-2017’, BMC Infectious Diseases, 19: 314. - PMC - PubMed
    1. Anisimova M. et al. (2011) ‘ Survey of Branch Support Methods Demonstrates Accuracy, Power, and Robustness of Fast Likelihood-Based Approximation Schemes’, Systematic Biology, 60: 685–99. - PMC - PubMed
    1. Bedford T. et al. (2015) ‘ Global Circulation Patterns of Seasonal Influenza Viruses Vary with Antigenic Drift’, Nature, 523: 217–20. - PMC - PubMed
    1. Boni M. F. et al. (2020) ‘ Evolutionary Origins of the SARS-CoV-2 Sarbecovirus Lineage Responsible for the COVID-19 Pandemic’, Nature Microbiology, 5: 1408–17, - PubMed