. 2023 Jan;53(1):149-159.
doi: 10.1017/S0033291721001306. Epub 2021 Mar 26.

Trust in government regarding COVID-19 and its associations with preventive health behaviour and prosocial behaviour during the pandemic: a cross-sectional and longitudinal study

Collaborators, Affiliations

Trust in government regarding COVID-19 and its associations with preventive health behaviour and prosocial behaviour during the pandemic: a cross-sectional and longitudinal study

Qing Han et al. Psychol Med. 2023 Jan.

Abstract

Background: The effective implementation of government policies and measures for controlling the coronavirus disease 2019 (COVID-19) pandemic requires compliance from the public. This study aimed to examine cross-sectional and longitudinal associations of trust in government regarding COVID-19 control with the adoption of recommended health behaviours and prosocial behaviours, and potential determinants of trust in government during the pandemic.

Methods: This study analysed data from the PsyCorona Survey, an international project on COVID-19 that included 23 733 participants from 23 countries (representative in age and gender distributions by country) at baseline survey and 7785 participants who also completed follow-up surveys. Specification curve analysis was used to examine concurrent associations between trust in government and self-reported behaviours. We further used structural equation model to explore potential determinants of trust in government. Multilevel linear regressions were used to examine associations between baseline trust and longitudinal behavioural changes.

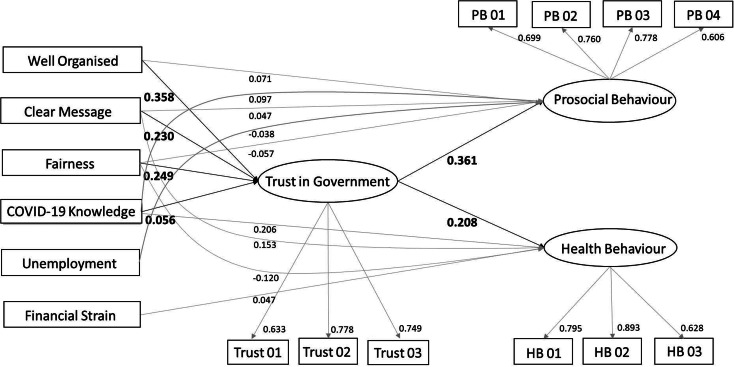
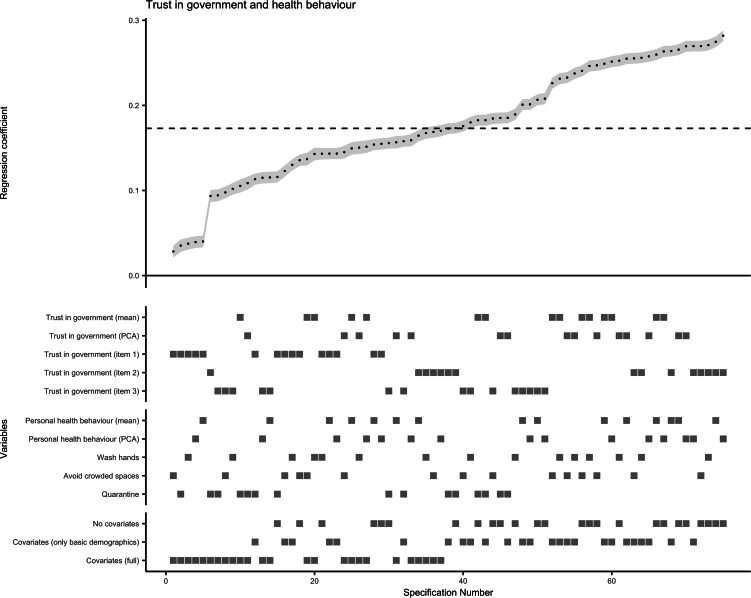
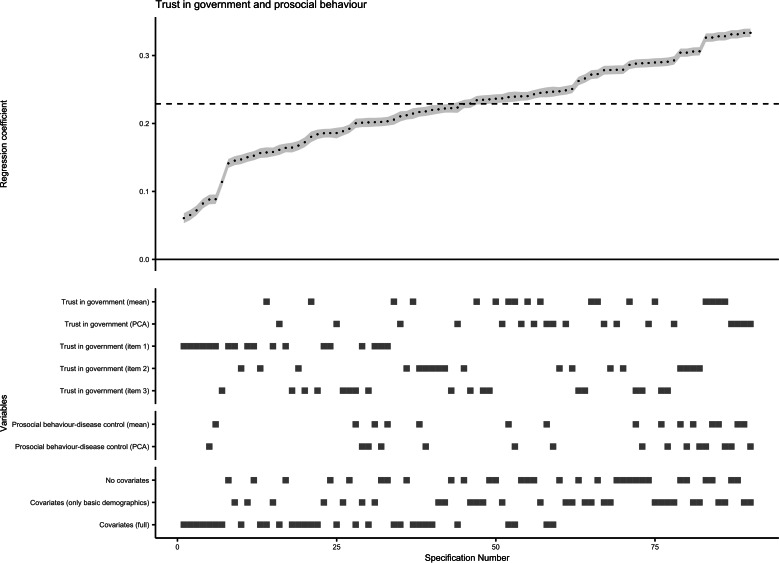
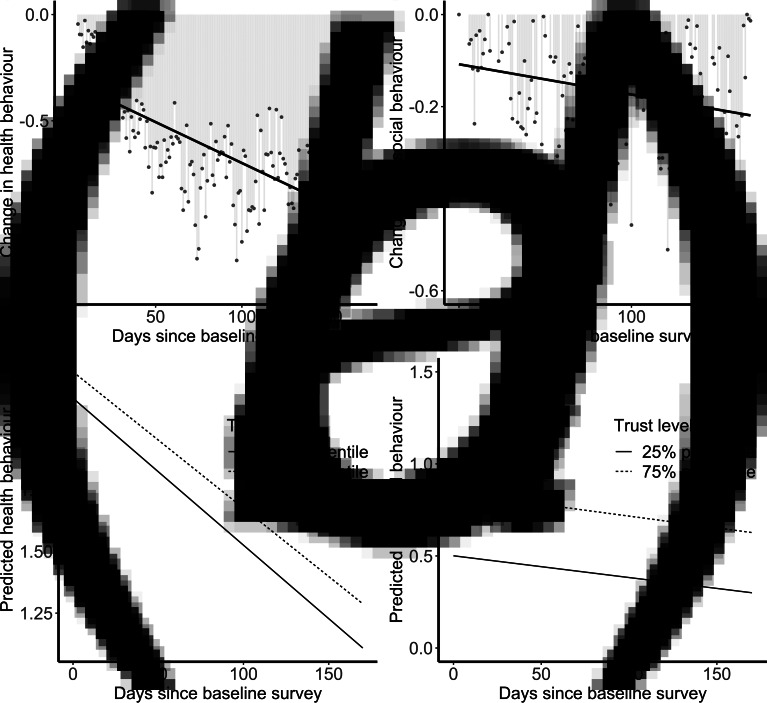
Results: Higher trust in government regarding COVID-19 control was significantly associated with higher adoption of health behaviours (handwashing, avoiding crowded space, self-quarantine) and prosocial behaviours in specification curve analyses (median standardised β = 0.173 and 0.229, p < 0.001). Government perceived as well organised, disseminating clear messages and knowledge on COVID-19, and perceived fairness were positively associated with trust in government (standardised β = 0.358, 0.230, 0.056, and 0.249, p < 0.01). Higher trust at baseline survey was significantly associated with lower rate of decline in health behaviours over time (p for interaction = 0.001).

Conclusions: These results highlighted the importance of trust in government in the control of COVID-19.


Figures

Fig. 1.
Fig. 1.
Results of SEM analysis. Note. Only paths with significant regression coefficients (p < 0.05) are plotted. Standardised β coefficients are displayed on the lower-right side of the corresponding paths. Trust 01-03 refer to the three items of trust in government; HB 01-03 refer to the three items of health behaviour; PB 01-04 refer to the four items of prosocial behaviour.
Fig. 2.
Fig. 2.
Scatter plots of country-level mean values of health behaviour items (a) and prosocial behaviour items (b) against mean values of trust in government items. Note. Data on 23 countries from the five continents are displayed as circles in each plot. Each colour corresponds to a particular continent. Three items on trust in government were harmonised into 7-point scale from −3 (strongly disagree) to 3 (strongly agree); three items on health behaviour and four items on prosocial behaviour were in similar scale from −3 to 3.
Fig. 3.
Fig. 3.
Results of specification curve analysis for trust in government and adoption of personal health behaviour. Note. The standardised β coefficients for the association of trust in government with health behaviour obtained from all 75 specifications (listed on the x axis) are plotted at the upper half of the graph. Each point represents the standardised β coefficient of one specification, and the error bar (in grey) represents the corresponding standard error. The dashed line indicates the median standardised β coefficient (median standardised β = 0.173, median standard error = 0.007, median sample size = 23 693). At the lower half of the graph, the corresponding specifications for each level of the three model specification factors are displayed as squares.
Fig. 4.
Fig. 4.
Results of specification curve analysis for trust in government and adoption of prosocial behaviour. Note. The standardised β coefficients for the association of trust in government with prosocial behaviour obtained from all 90 specifications (listed on the x axis) are plotted at the upper half of the graph. Each point represents the standardised β coefficient of one specification, and the error bar (in grey) represents the corresponding standard error. The dashed line indicates the median standardised β coefficient (median standardised β = 0.229, median standard error = 0.006, median sample size = 23 693). At the lower half of the graph, the corresponding specifications for each level of the three model specification factors are displayed as squares; the four individual items of prosocial behaviour were omitted due to the figure size.
Fig. 5.
Fig. 5.
Longitudinal changes in health and prosocial behaviours and the influences of baseline trust in government. Note. The average differences between follow-up survey and baseline survey in mean score of three health behaviour items (a) and mean score of two prosocial behaviour items (b) were plotted against time since baseline survey. A negative value indicates a decline of behaviour adoption at follow-up survey. Items on behaviour were in a 7-point scale from −3 (strongly disagree) to 3 (strongly agree). The lower half of the graph shows the predicted values (marginal means) of mean score of health behaviours (c) and mean score of prosocial behaviours (d) across time, obtained from multilevel linear regressions. The solid line in (c) and (d) represents the predicted values at the 25% percentile of baseline mean score of trust in government (−0.5 in a −3 to 3 scale); the dashed line represents the predicted values at the 75% percentile of baseline mean score of trust in government (1.5 in a −3 to 3 scale).

Similar articles

Cited by

References

    1. Alsan, M., & Wanamaker, M. (2018). Tuskegee and the health of black men. Quarterly Journal of Economics, 133(1), 407–455. 10.1093/qje/qjx029. - DOI - PMC - PubMed
    1. Anderson, R. M., Heesterbeek, H., Klinkenberg, D., & Hollingsworth, T. D. (2020). How will country-based mitigation measures influence the course of the COVID-19 epidemic? Lancet (London, England), 395(10228), 931–934. 10.1016/S0140-6736(20)30567-5. - DOI - PMC - PubMed
    1. Bargain, O., & Aminjonov, U. (2020). Trust and compliance to public health policies in times of COVID-19. Journal of Public Economics, 192, 104316. 10.1016/j.jpubeco.2020.104316. - DOI - PMC - PubMed
    1. Bingenheimer, J. B., & Raudenbush, S. W. (2004). Statistical and substantive inferences in public health: Issues in the application of multilevel models. Annual Review of Public Health, 25, 53–77. 10.1146/annurev.publhealth.25.050503.153925. - DOI - PubMed
    1. Blair, R. A., Morse, B. S., & Tsai, L. L. (2017). Public health and public trust: Survey evidence from the Ebola Virus Disease epidemic in Liberia. Social Science & Medicine, 172, 89–97. 10.1016/j.socscimed.2016.11.016. - DOI - PubMed

Publication types