. 2021 Apr 16;135(7):865-884.
doi: 10.1042/CS20201366.

Down-regulation of STAT3 enhanced chemokine expression and neutrophil recruitment in biliary atresia

Affiliations

Down-regulation of STAT3 enhanced chemokine expression and neutrophil recruitment in biliary atresia

Ming Fu et al. Clin Sci (Lond). .

Abstract

Biliary atresia (BA) is an immune-related disorder and signal transducer and activator of transcription 3 (STAT3) is a key signalling molecule in inflammation. The present study was designed to clarify the function of STAT3 in BA. STAT3 expression was examined in patients and a mouse BA model in which STAT3 levels were further altered with a specific inhibitor or activator. Neutrophil accumulation and the levels of the neutrophil chemoattractants (C-X-C motif) ligand 1 (CXCL1) and IL-8 were determined. The effects of STAT3 inhibition on IL-8 expression were examined in human biliary epithelial cell (BEC) cultures. Functional changes in liver STAT3+ neutrophils in the mouse model were analysed with 10× single cell RNA-seq methods. Results showed STAT3 and p-STAT3 expression was reduced in BA liver tissue compared with control samples. Administration of a STAT3 inhibitor increased jaundice and mortality and reduced body weight in BA mice. In contrast, the STAT3 activator ameliorated BA symptoms. Extensive neutrophil accumulation together with CXCL1 up-regulation, both of which were suppressed by an anti-CXCL1 antibody, were observed in the STAT3 inhibitor-treated group. Recombinant IL-8 administration increased disease severity in BA mice, and the STAT3 activator had the reverse effect. Inhibiting STAT3 increased apoptosis of human BECs together with up-regulated IL-8 expression. RNA-seq analysis revealed reduced the numbers of STAT3 expressing neutrophil in BA which was accompanied by marked enhanced interferon-related antiviral activities. In conclusion, STAT3 reduction, enhanced IL-8 and CXCL1 expression and promoted the accumulation of interferon-responsive neutrophils resulting in BEC damage in BA.

Keywords: Biliary atresia; Neutrophil chemoattractants; STAT3.


Conflict of interest statement

The authors declare that there are no competing interests associated with the manuscript.

Figures
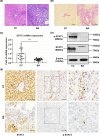
Figure 1
Figure 1. Tissue fibrosis and the expression of STAT3 in BA
(A) HE staining showed the cellular infiltrate in CC and BA patient liver samples. The scale bar represents 50 μm. (B) Picrosirius Red staining shows fibrosis in CC and BA patient liver samples. (C) mRNA expression of STAT3 measured by quantitative PCR. ***P<0.001 (n=20 for CC and n=28 for BA). (D) Protein expression of STAT3 and the activated form p-STAT3 determined by Western blotting. N=4 for both CC and BA; one set of representative results is shown. (E) Immunohistochemical staining showed expression of STAT3 and p-STAT3 in BA and CC patient liver samples. The portal areas are shown, and the arrows indicate the positions where BECs can be observed. The solid arrows indicate these features in the CC samples, and the dashed arrows indicate these features in BA. The scale bar represents 50 μm.
Figure 2
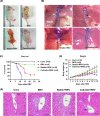
Figure 2. Effect of STAT3 inhibition and activation on a mouse model of BA
The STAT3 inhibitor Stattic (25 μg/g body weight, n=10) or activator Colivelin (1 μg/g body weight, n=6) was given 4 h before RRV inoculation, and mouse morphology, body weight and survival time were recorded. (A) Effects of Stattic and Colivelin on BA syndrome. Photographs of the mice were taken on day 9 after RRV inoculation. (B) Photographs of the portal areas after dissection under a dissecting microscope. Cholangiography was achieved by injection of 0.4% Methylene Blue. The dashed blue line shows the outline of the gallbladder and bile duct. The asterisks depict BA. (C) Effects of Stattic and Colivelin on BA mouse survival. (D) Effects of Stattic and Colivelin on BA mouse body weight changes. (E) HE staining showing the hepatic bile ducts and cellular infiltration in the Stattic and Colivelin treatment groups. The scale bar represents 50 μm. Abbreviations: BD, bile duct; PV, portal vein.
Figure 3
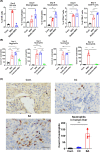
Figure 3. Effects of changes in STAT3 expression on immune cell regulation
(A) Effects of STAT3 inhibition on NK cell, macrophage, neutrophil, CD4+ T cell and CD8+ T cell numbers in the liver determined using flow cytometric analysis. Cell suspensions were obtained from the liver at the end of experiments and labelled with the appropriate antibodies for immune cell analysis. At least three sets of experiments were performed, and a representative experiment is shown here. Data were obtained on day 9 after RRV inoculation (other time point analyses are presented in the Supplementary Data). Data were collected from the experiments and evaluated by statistical analysis. *P<0.05, **P<0.01, ***P<0.001. (B) Effects of STAT3 inhibition or activation on neutrophil accumulation determined by immunohistochemical staining on days 3, 6, 9 and 12 after RRV inoculation. The number of immune-positive signals was counted, calculated and analysed. **P<0.01, ***P<0.001. (C) Immunohistochemical staining of neutrophils in samples from normal controls (transplantation donor liver samples), CC patients and BA patients. The cell numbers in the different categories were evaluated (n=5 in the control group, CC and BA groups; ***P<0.001). The scale bar represents 50 μm.
Figure 4
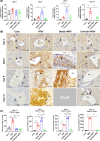
Figure 4. Effect of changes in STAT3 levels on expression of the chemoattractant CXCL1 in a BA mouse model
(A) CXCL1 gene expression in response to Stattic or Colivelin treatment was examined by quantitative PCR on days 3, 6, 9 and 12 after RRV inoculation. **P<0.01, ***P<0.001. (B) Immunohistochemical staining for CXCL1 was used to assess BA-model mice treated with Stattic and Colivelin. The black arrows represent CXCL1+ cells; the scale bar represents 50 μm. (C) Immunohistochemical staining and positive cells were quantified and analysed. ***P<0.001. Abbreviations: BD, bile duct; PV, portal vein.
Figure 5
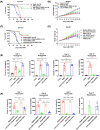
Figure 5. Administration of an anti-CXCL1 antibody or human recombinant IL-8 (rhIL-8) to BA-model mice and the effects of combining the antibody treatment with STAT3 inhibition or activation
(A) Changes in survival in BA-model mice induced by an anti-CXCL1 antibody (n=10) or rhIL-8 (n=8) compared with RRV inoculation alone or no treatment. (B) The body weight changes corresponding to (A). (C) Changes in mouse survival induced by the anti-CXCL1 antibody in the Stattic + RRV group (n=11) compared with the Stattic + RRV group (n=10) and by Colivelin in the rhIL-8 + RRV group (n=9) compared with the rhIL-8 + RRV group (n=8). (D) The body weight changes corresponding to (B). (E) Neutrophil counts corresponding to (A) determined by immunohistochemical staining with an anti-neutrophil antibody. *P<0.05, **P<0.01, ***P<0.001. (F) Neutrophil counts for the data in (C) determined by immunohistochemical staining. *P<0.05, **P<0.01, ***P<0.001.
Figure 6
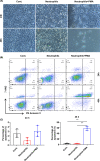
Figure 6. Effects of neutrophil activation on BEC cultures
(A) Human BECs were cultured as described previously. Neutrophils isolated from PBMCs were activated with PMA and added to the BEC cultures for another 24 or 48 h, and then the cultures were photographed. (B) Apoptosis in single-BEC suspensions cocultured with activated neutrophils was analysed by flow cytometry. At least three sets of experiments were performed, and one representative graph is shown. (C) Apoptosis in BECs co-cultured at 24 and 48 h with activated neutrophils was evaluated. ***P<0.001.
Figure 7
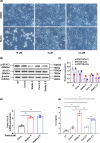
Figure 7. Inhibition of STAT3 in BEC cultures
(A) Human BECs were cultured in epithelial cell medium for 48 h, and then different concentrations of Stattic were added to the cultures and incubated for another 24 h before cell morphology was analysed. (B,C) Western blotting shows the expression of p-STAT3 and STAT3 in cell cultures treated with different concentrations of Stattic for 12 h. Cont., control group with Stattic; Stattic 5, Stattic at a dose of 5 μM. (D) mRNA expression of chemoattractant IL-8 in human BEC cultures was measured by quantitative PCR. The cont.2.5 and cont.5 group correspond to the control groups for the STAT3 inhibitor Stattic with 2.5 and 5 μM, with the same volume of DMSO as solvent of Stattic. ***P<0.001. (E) IL-8 secretion into the supernatant of the cell culture was assessed by ELISA, *P<0.05, ***P<0.001.
Figure 8
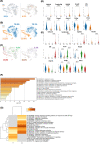
Figure 8. Altered gene expression in STAT3+ neutrophils in BA liver
The 10× single-cell RNA-seq was used in the experiments. (A) The results were analysed using Loupe Cell Browser with t-SNE method. The percentages of STAT3+ cells in NC and RRV groups is presented. (B) The two subclusters of Gr-1+ cells was showed using Ly6G and Ly6C as markers and the percentage was indicated. (C) The expression of STAT3 in each subclusters and the percentage was indicated. (D) Five up- and down-regulated genes each in BA compared with the control group. *P<0.1, **P<0.05, ***P<0.01 and ****P<0.001, the P-values adjusted using the Benjamini–Hochberg correction for multiple testes was showed in the graph. (E) Five up- and down-regulated genes expressed in the sub clusters compared BA and control group with Ly6G+ and Ly6C+indicted. The significant P-value label was the same as previous. (F) Metascape analysis showing the enrichment of gene expression in different signalling pathway and interaction of molecules in the context of genes that are highly differentially expressed between NC and RRV groups. (G) The analysis of the most highly expressed genes and comparison of the each subcluster to determine functional differences.

Similar articles

Cited by

References

    1. Hartley J.L., Davenport M. and Kelly D.A. (2009) Biliary atresia. Lancet 374, 1704–1713 10.1016/S0140-6736(09)60946-6 - DOI - PubMed
    1. Girard M. and Panasyuk G. (2019) Genetics in biliary atresia. Curr. Opin. Gastroenterol. 35, 73–81 10.1097/MOG.0000000000000509 - DOI - PubMed
    1. Arikan C., Berdeli A., Kilic M., Tumgor G., Yagci R.V. and Aydogdu S. (2008) Polymorphisms of the ICAM-1 gene are associated with biliary atresia. Dig. Dis. Sci. 53, 2000–2004 10.1007/s10620-007-9914-1 - DOI - PubMed
    1. Arikan C., Berdeli A., Ozgenc F., Tumgor G., Yagci R.V. and Aydogdu S. (2006) Positive association of macrophage migration inhibitory factor gene-173G/C polymorphism with biliary atresia. J. Pediatr. Gastroenterol. Nutr. 42, 77–82 10.1097/01.mpg.0000192247.55583.fa - DOI - PubMed
    1. Shih H.H., Lin T.M., Chuang J.H., Eng H.L., Juo S.H., Huang F.C.et al. . (2005) Promoter polymorphism of the CD14 endotoxin receptor gene is associated with biliary atresia and idiopathic neonatal cholestasis. Pediatrics 116, 437–441 10.1542/peds.2004-1900 - DOI - PubMed

Publication types