. 2021 Apr;35(4):e21278.
doi: 10.1096/fj.202002151R.

Proteomics characterization of mitochondrial-derived vesicles under oxidative stress

Affiliations

Proteomics characterization of mitochondrial-derived vesicles under oxidative stress

Goutham Vasam et al. FASEB J. 2021 Apr.

Abstract

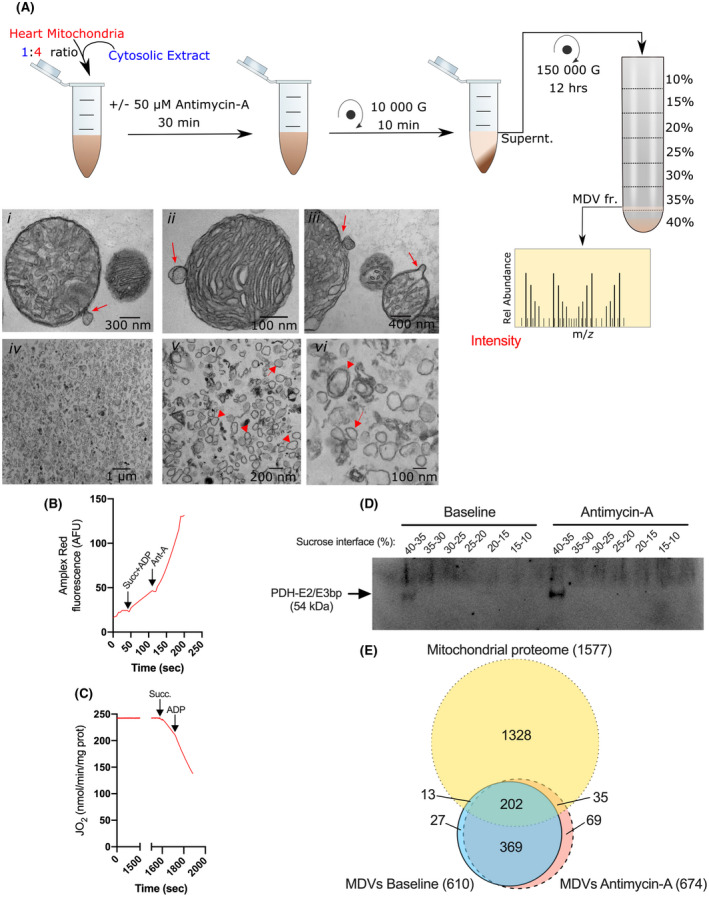
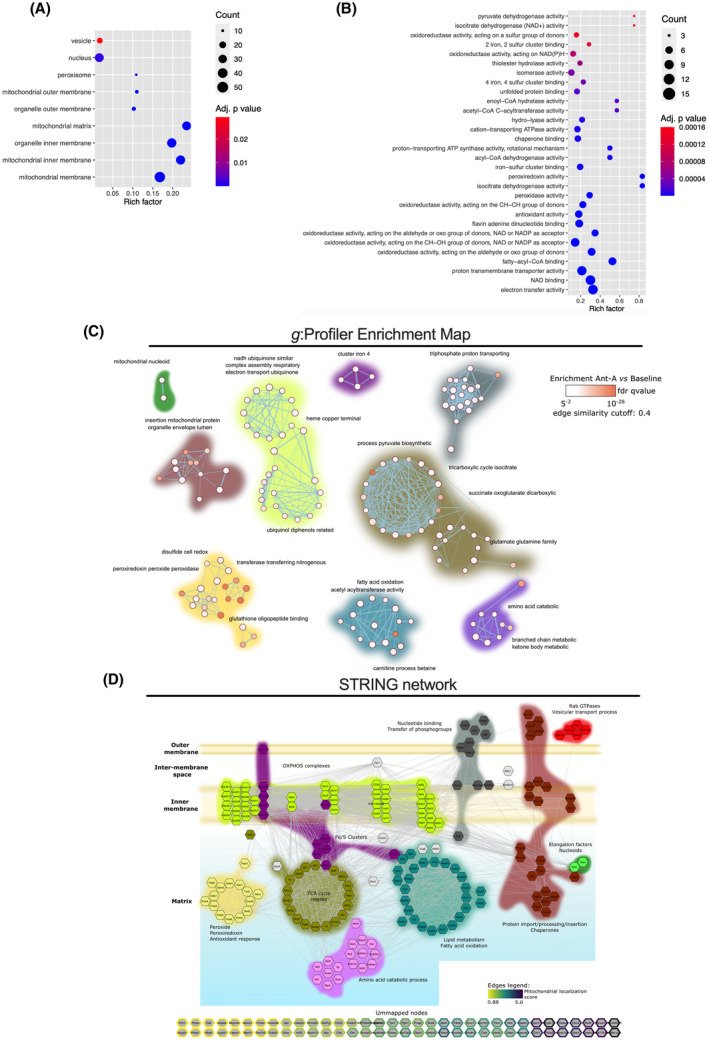
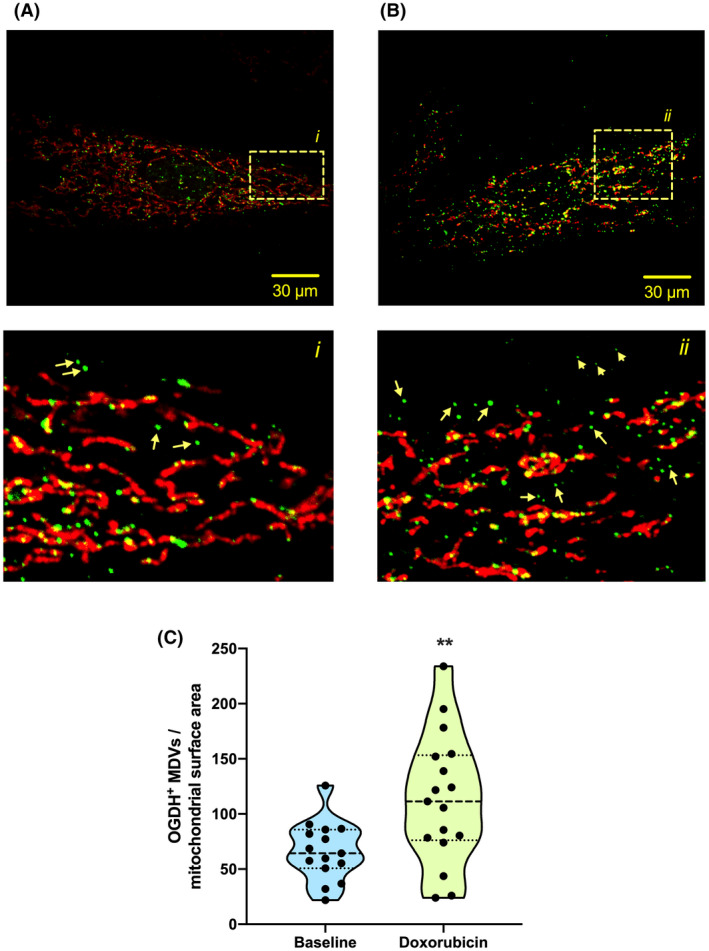
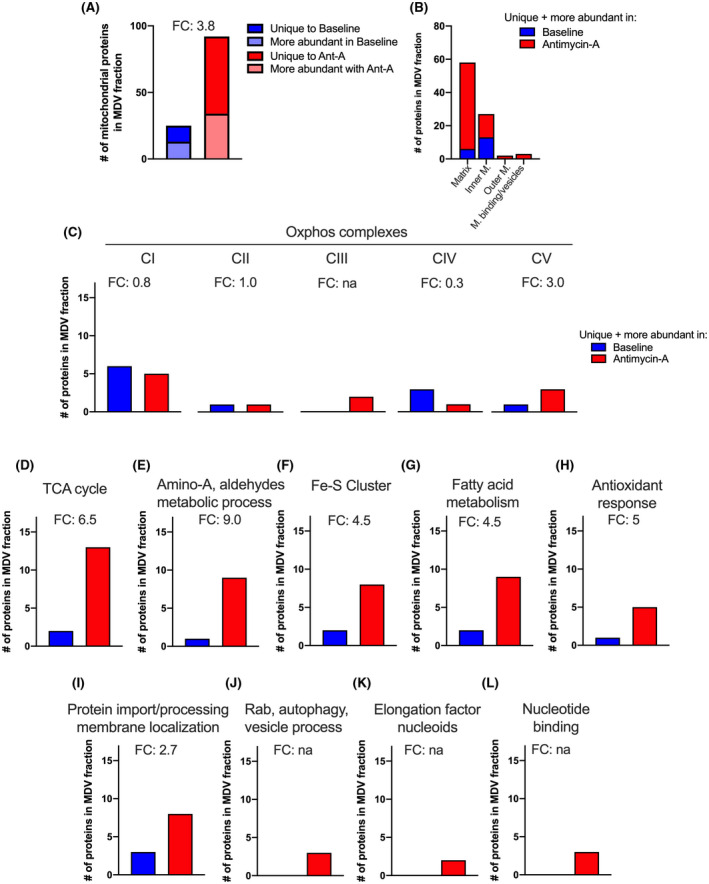
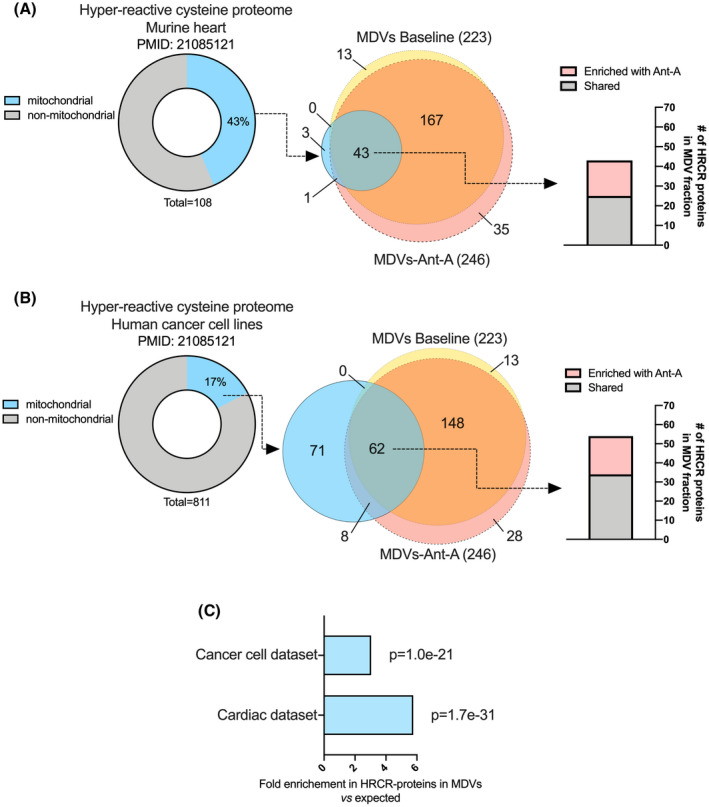
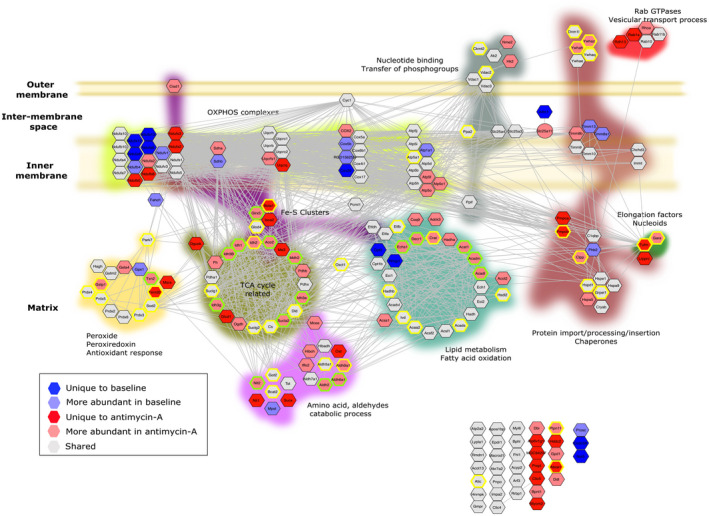
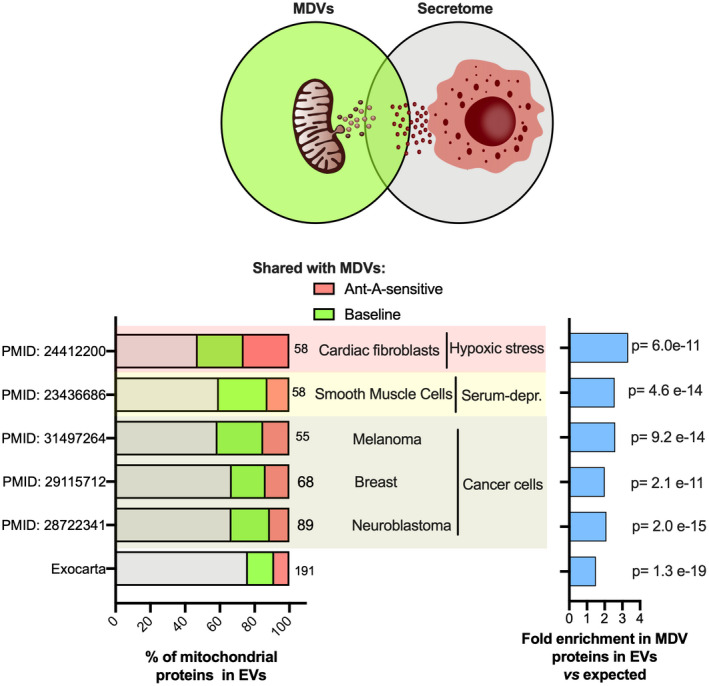
Mitochondria share attributes of vesicular transport with their bacterial ancestors given their ability to form mitochondrial-derived vesicles (MDVs). MDVs are involved in mitochondrial quality control and their formation is enhanced with stress and may, therefore, play a potential role in mitochondrial-cellular communication. However, MDV proteomic cargo has remained mostly undefined. In this study, we strategically used an in vitro MDV budding/reconstitution assay on cardiac mitochondria, followed by graded oxidative stress, to identify and characterize the MDV proteome. Our results confirmed previously identified cardiac MDV markers, while also revealing a complete map of the MDV proteome, paving the way to a better understanding of the role of MDVs. The oxidative stress vulnerability of proteins directed the cargo loading of MDVs, which was enhanced by antimycin A (Ant-A). Among OXPHOS complexes, complexes III and V were found to be Ant-A-sensitive. Proteins from metabolic pathways such as the TCA cycle and fatty acid metabolism, along with Fe-S cluster, antioxidant response proteins, and autophagy were also found to be Ant-A sensitive. Intriguingly, proteins containing hyper-reactive cysteine residues, metabolic redox switches, including professional redox enzymes and those that mediate iron metabolism, were found to be components of MDV cargo with Ant-A sensitivity. Last, we revealed a possible contribution of MDVs to the formation of extracellular vesicles, which may indicate mitochondrial stress. In conclusion, our study provides an MDV proteomics signature that delineates MDV cargo selectivity and hints at the potential for MDVs and their novel protein cargo to serve as vital biomarkers during mitochondrial stress and related pathologies.

Keywords: hyper-reactive cysteine residues; mitochondrial iron transport; mitochondrial quality control; mitochondrial stress; mitochondrial-derived vesicle proteome.


Conflict of interest statement

The authors report no conflicts of interest in this work.

Figures

FIGURE 1
FIGURE 1
Overview of the in vitro budding assay employed to survey the MDV proteome following graded oxidative stress. A, 5 mg of freshly isolated cardiac mitochondria were incubated at 37°C and ambient PO2, in a budding medium supplemented with a cytosolic extract as per the indicated proportion. Parallel experiments were performed in the absence or presence of the complex III inhibitor antimycin A (Ant‐A: 50 µM), which allowed comparison to be made at two levels of oxidative stress (ie, baseline and antimycin A). The cytosolic extract used for the budding assay was prepared in large quantities on a separate day and kept frozen in aliquots, which allowed to use the same extract across all experimental replicates and conditions. Following incubation, mitochondria were rapidly sedimented and the supernatant was processed for the isolation of MDV fractions as indicated. Images i‐iii show TEM micrographs of individual organelles actively budding single or double‐membrane vesicles of 60‐150 nm in diameter (Direct Magnification: 49 000×). Images iv‐vi show the accumulation of vesicular structures of the same size range at the 35%‐40% sucrose interface (Direct Magnification: 1900 and 30 000×). Arrowheads point to double‐membrane MDVs, while arrows point to single membrane MDVs (B): Amplex Red fluorescence tracing showing differences in the rate of H2O2 release achieved when mitochondria are incubated under baseline (ie, in presence of succinate and ADP) or in presence of antimycin A. C, Oxygraph trace of mitochondria incubated for 30 min at room temperature. The capacity to respond to the addition of succinate and ADP confirms that bioenergetic integrity is well maintained. D, Equal volume of the various sucrose interfaces recovered were submitted to SDS‐PAGE and probed with an antibody directed against the MDV marker PDHE2/E3bp. PDH immunoreactivity was observed only at the 35%‐40% interface, which was subsequently used for MS/MS analysis. E, Venn diagram representing the overlap between the Rattus norvegicus mitochondrial proteome, and proteins identified in the MDV fractions following incubation under baseline or antimycin A conditions. Proteins in the mitochondrial proteome included 1127 known mitochondrial proteins and 431 proteins with a predicated mitochondrial location based on the MitoMiner 4.0 database 19 (http://mitominer.mrc‐mbu.cam.ac.uk/release‐4.0/impi.do). For the MDV fractions, proteins detected in at least two‐thirds of experimental replicates (FDR < 0.01) within any experimental condition are considered. Number in parentheses indicates the total number of proteins in each set of data
FIGURE 2
FIGURE 2
Characterization of the mitochondrial proteins identified in the combined MDV dataset. Functional Enrichment analysis of over‐represented GO cellular component (A) and biological process/molecular function (B) in the combined MDV dataset (baseline and antimycin A) performed using g:Profiler. Proteins with a known predicted mitochondrial localization were included in the analysis. Maximum size of functional categories was set at 90 to filter out large annotations that provide limited interpretative value. 21 The g:SCS algorithm was used for multiple hypothesis testing corrections using a default alpha threshold of 0.05 for significance. Enrichment is expressed as a rich factor, which represents the ratio of the number of proteins observed for a given GO term to the total number of proteins for this term. Circle size reflects the number of proteins per GO term, while color indicates the level of significance. C, g:Profiler enrichment map illustrating the main mitochondrial processes represented in the MDV proteome. Nodes, edges, and node color represent individual GO terms, mutual overlap, and the level of significance of enrichment, respectively. The auto‐annotation tool was used on Cytoscape to automatically generate cluster labels. D, High confidence (interaction score > 0.7 based on default active interaction sources) STRING network of mitochondrial proteins identified in the MDV fractions. GO enrichment data were used to manually cluster proteins based on biological process and location, providing a detailed map of the MDV proteome. The color code used to identify clusters is the same for panels C and D
FIGURE 3
FIGURE 3
Generation of OGDH‐positive MDV in cardiac myoblasts. H9c2 cardiac myoblasts cultured in galactose‐containing media and treated with vehicle (A) or 25 μM doxorubicin (B) for 30 min. Cells were immunolabeled for the TOM20 (red) and the OGDH (green). Numbered panels below are the magnifications of the respective boxed areas shown in the top panels. C, Quantification of OGDH+/TOM20 MDVs in control and doxorubicin‐treated cells at 30 min (three independent experiments per group, 5‐6 random fields of view). The number of vesicles in each cell is expressed per unit of mitochondrial surface area. Statistical comparison was made between doxorubicin and control using a two‐tailed nonparametric Mann‐Whitney test: a, P < .01
FIGURE 4
FIGURE 4
Differential analysis of the MDV proteome at baseline and following exposure to antimycin A. A, Total number of mitochondrial proteins enriched in the MDV fraction in one experimental condition vs the other. This includes proteins that were uniquely detected in one experimental condition and proteins that were significantly (FDR < 15%) more abundant based on LFQ values. B, Submitochondrial localization of mitochondrial proteins detected as unique or more abundant in each of the experimental condition. C‐L, Number of enriched (ie, unique and more abundant) mitochondrial proteins associated with specific mitochondrial processes and molecular functions under baseline and antimycin A conditions. Fold change (FC) is indicated for each process/molecular function
FIGURE 5
FIGURE 5
Enrichment of proteins containing hyper‐reactive cysteine residues in MDVs. Two proteomics datasets published by Weerapana et al 29 were used to examine the potential enrichment of MDVs with proteins harboring hyper‐reactive cysteine residues (HRCRs). The first dataset contained 108 HRCR proteins identified in the soluble fraction of murine heart (A), while the second dataset contained 811 HRCR proteins identified in various human cancer cell lines (MCF7, MDA‐MB‐231, and Jurkat) (B). For each comparison, the percentage of mitochondrial proteins in the HRCR dataset was determined using the MitoMiner 4.0 database. Venn diagrams were then used to determine the number of mitochondrial proteins harboring HRCRs present in MDVs under baseline and antimycin A conditions. Mitochondrial proteins known to harbor HRCRs were strongly enriched in MDVs. C, Fold enrichments in mitochondrial HRCR proteins in MDVs vs the mitochondrial proteome along with their hypergeometric test p values
FIGURE 6
FIGURE 6
Differential analysis of the MDV proteome at baseline and after exposure to antimycin A. The STRING network of mitochondrial proteins identified in the MDVs (see Figure 2 for details) was used to map proteins that were differentially enriched under baseline or antimycin A conditions, and to identify those reported to harbor hyper‐reactive cysteine residues. 29 Proteins labeled in dark blue or red were uniquely detected in one of the two experimental conditions. Proteins labeled in pale blue or red were identified in both experimental conditions, but their abundance differed significantly (FDR < 15%). Proteins labeled in grey were present in both experimental conditions and did not show any significant difference. Proteins with hyper‐reactive cysteine residues identified in the murine heart and cancer cell lines are labeled with green and yellow borders, respectively
FIGURE 7
FIGURE 7
Shared proteomic signature among MDVs and extracellular vesicles. The proportion of mitochondrial proteins that appear in both MDVs and EVs, which might predict the MDVs fate of contributing to the extracellular vesicles, was estimated by comparing the MDV proteome with the ExoCarta database and the proteome of six other publicly available EV datasets obtained under various stress conditions. A, A depiction of shared mitochondrial proteomic profile between MDVs and EVs. B, The total number of mitochondrial proteins in the EV datasets derived from the ExoCarta database, cardiac fibroblasts under hypoxia (PMID—24412200 35 ]), serum‐starved smooth muscle cells (PMID—23436686 31 ), and cancerous cells (PMIDs – 31 497 264, 29 115 712 & 28722341 32 , 33 , 34 ) was determined using the MitoMiner 4.0 database. The percentage of mitochondrial proteins from each EV dataset that was common to MDV proteome and among those that were sensitive to antimycin A were indicated. C, Fold change of actual vs expected percentage of MDV mitochondrial proteins observed in EVs with respect to mitochondrial proteome along with their hypergeometric test p values

References

    1. Mashburn LM, Whiteley M. Membrane vesicles traffic signals and facilitate group activities in a prokaryote. Nature. 2005;437(7057):422‐425. - PubMed
    1. Deatherage BL, Cookson BT. Membrane Vesicle Release in Bacteria, Eukaryotes, and Archaea: a Conserved yet Underappreciated Aspect of Microbial Life. Infection and Immunity. 2012;80(6):1948‐1957. 10.1128/IAI.06014-11 - DOI - PMC - PubMed
    1. Li Z, Clarke AJ, Beveridge TJ. Gram‐negative bacteria produce membrane vesicles which are capable of killing other bacteria. J Bacteriol. 1998;180(20):5478‐5483. - PMC - PubMed
    1. Kadurugamuwa JL, Beveridge TJ. Membrane vesicles derived from Pseudomonas aeruginosa and Shigella flexneri can be integrated into the surfaces of other Gram‐negative bacteria. Microbiology. 1999;145(8):2051‐2060. - PubMed
    1. Soubannier V, McLelland G‐L, Zunino R, et al. A vesicular transport pathway shuttles cargo from mitochondria to lysosomes. Curr Biol. 2012;22(2):135‐141. - PubMed

Publication types

Substances