

mTOR-mediated calcium transients affect cardiac function in ex vivo ischemia-reperfusion injury
- PMID: 33769701
- PMCID: PMC7995667
- DOI: 10.14814/phy2.14807
mTOR-mediated calcium transients affect cardiac function in ex vivo ischemia-reperfusion injury
Abstract
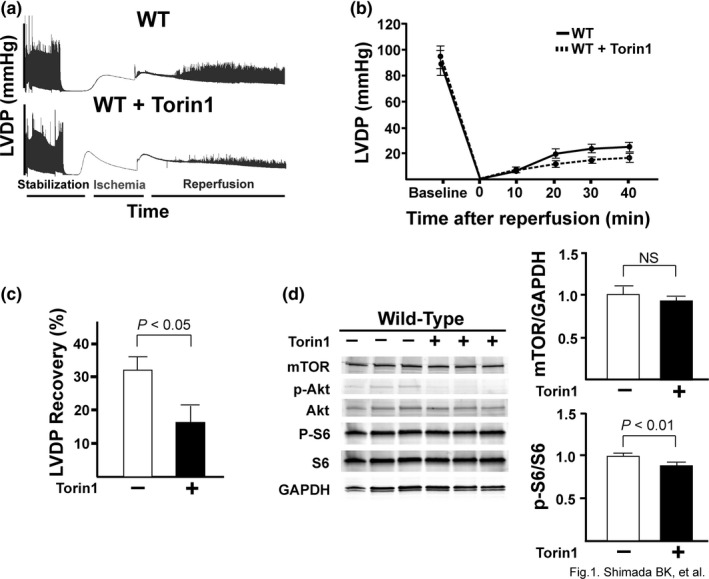
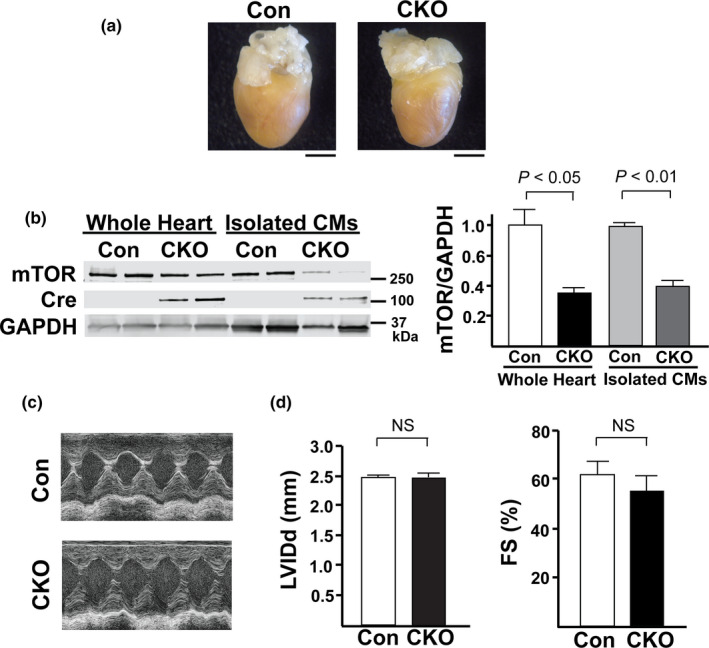
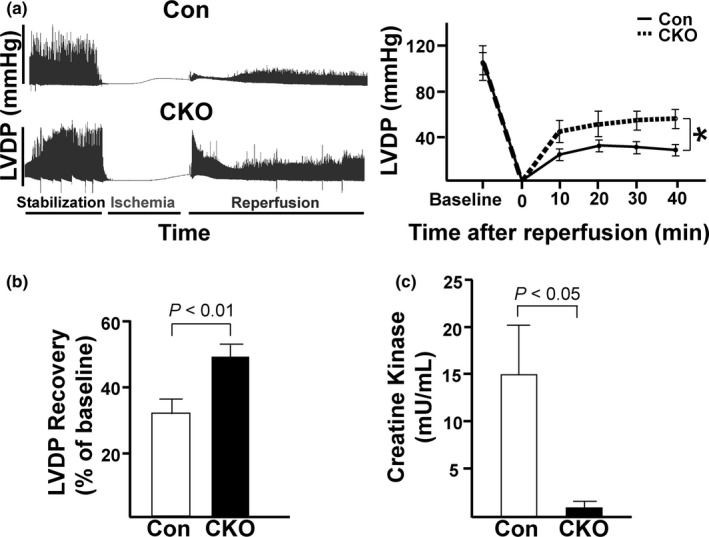
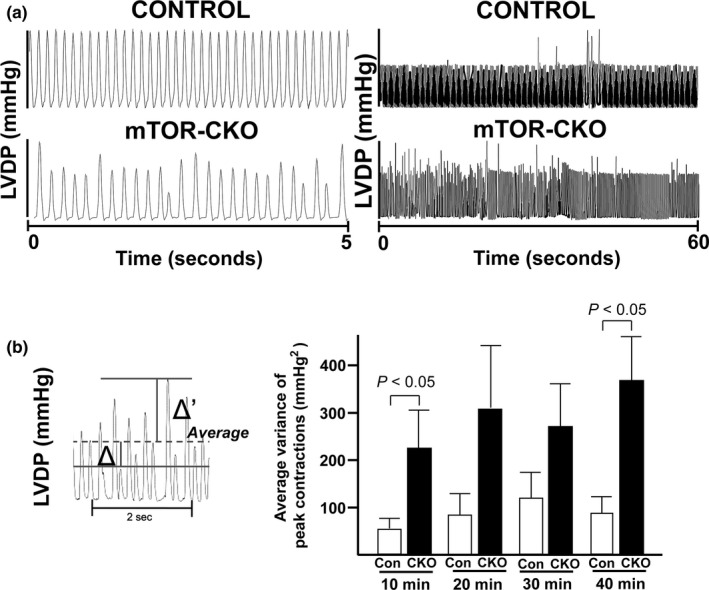
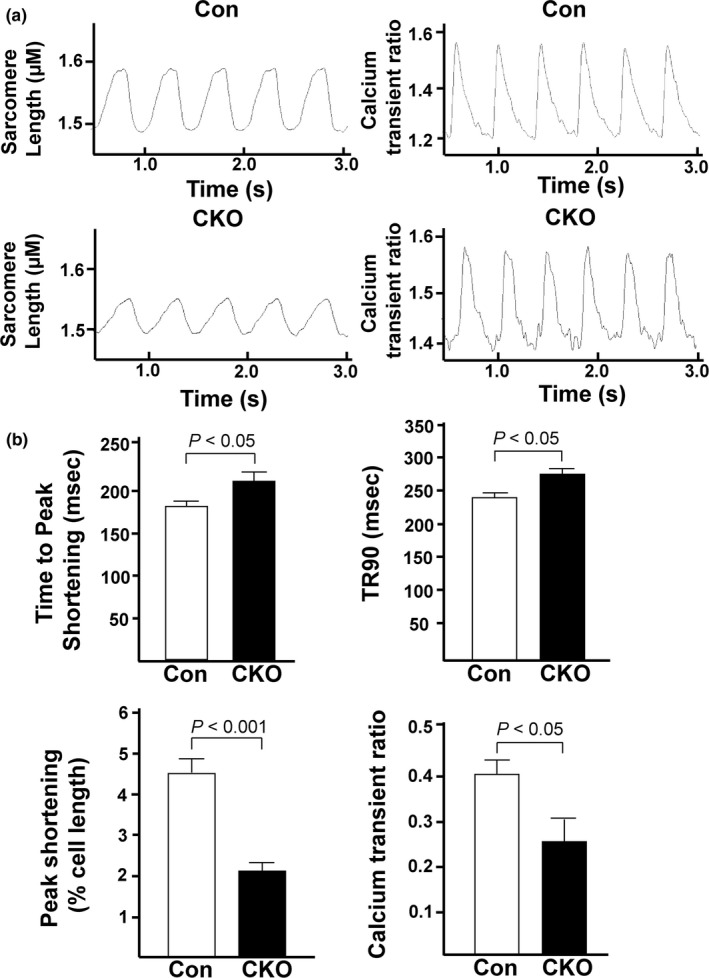
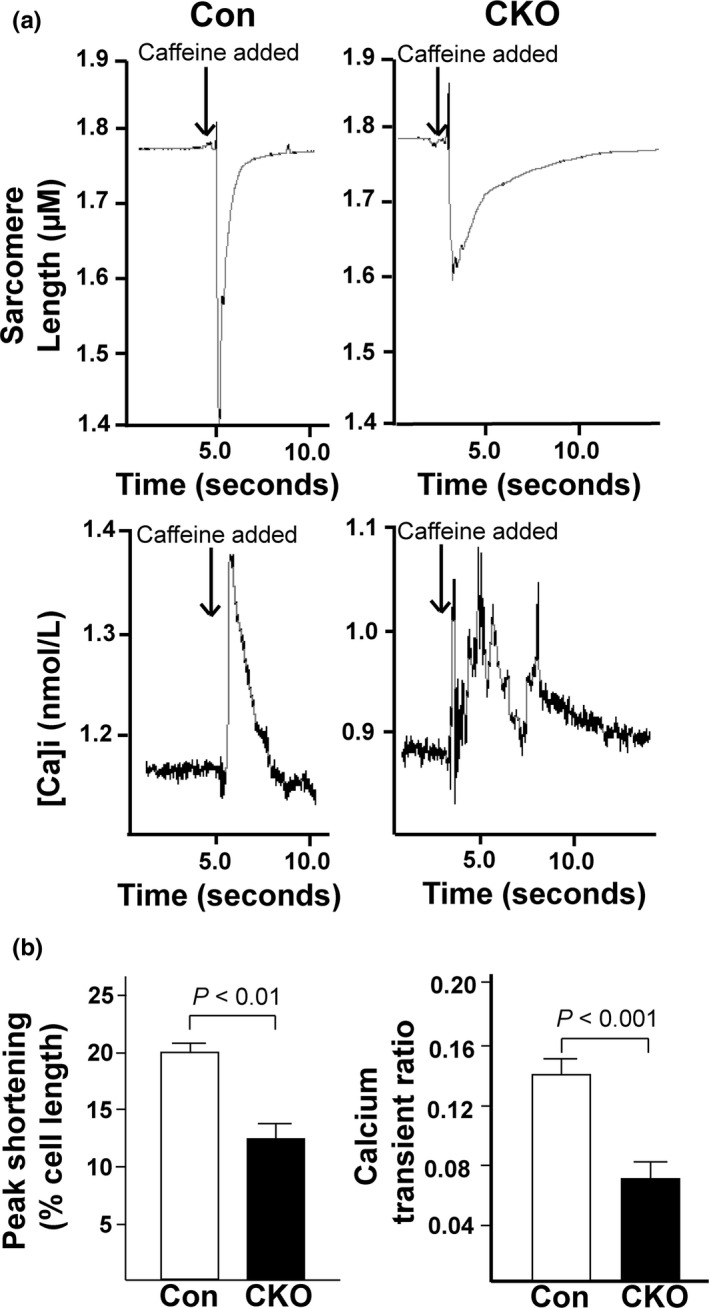
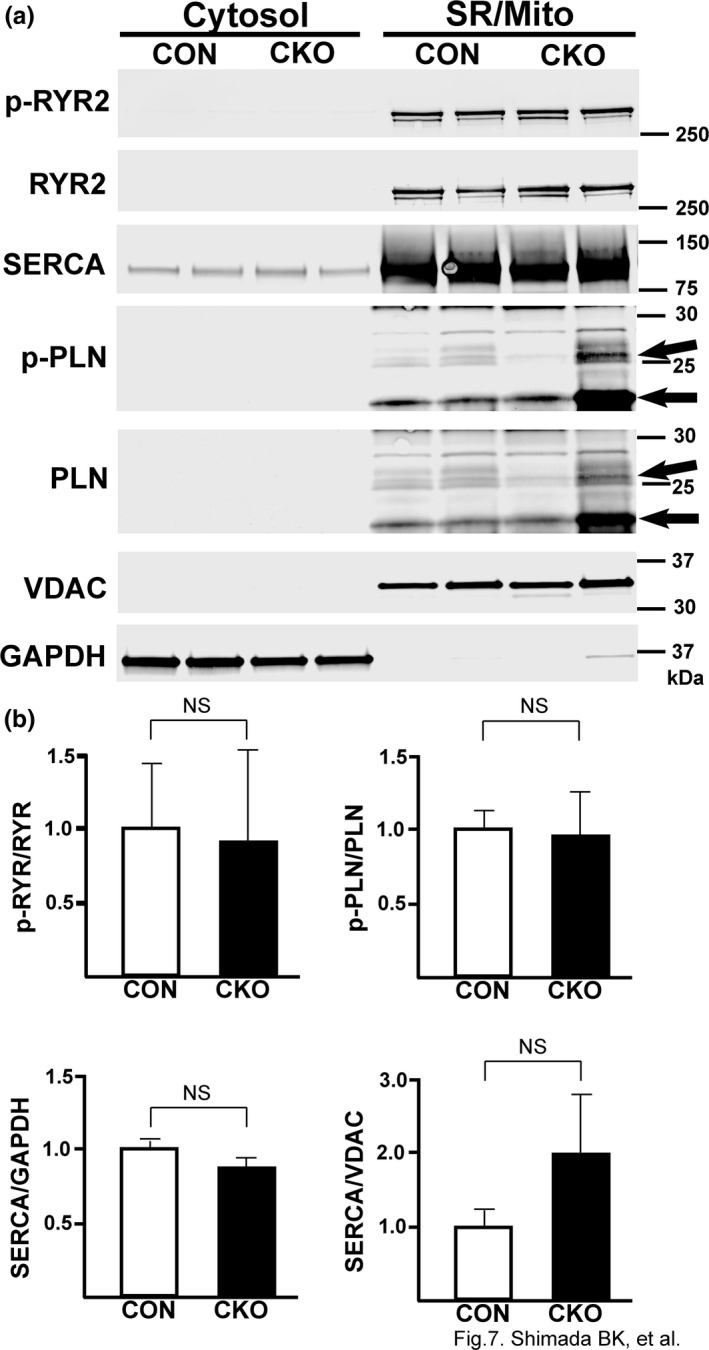
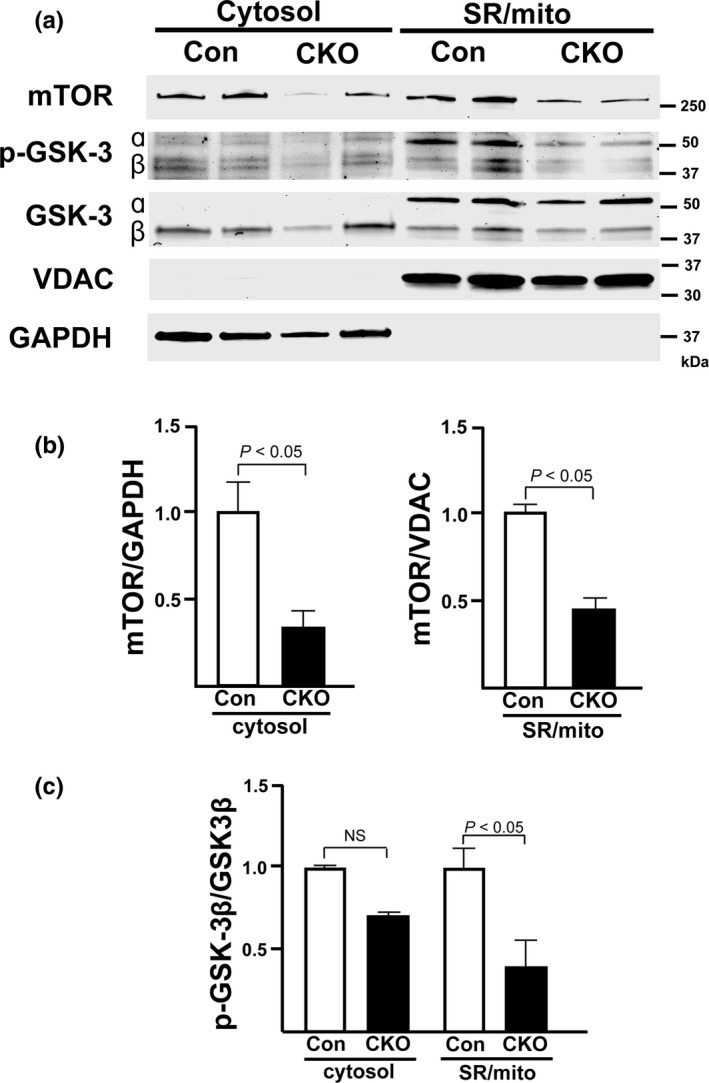
The mechanistic target of rapamycin (mTOR) is a key mediator of energy metabolism, cell growth, and survival. While previous studies using transgenic mice with cardiac-specific overexpression of mTOR (mTOR-Tg) demonstrated the protective effects of cardiac mTOR against ischemia-reperfusion (I/R) injury in both ex vivo and in vivo models, the mechanisms underlying the role of cardiac mTOR in cardiac function following I/R injury are not well-understood. Torin1, a pharmacological inhibitor of mTOR complex (mTORC) 1 and mTORC2, significantly decreased functional recovery of LV developed pressure in ex vivo I/R models (p < 0.05). To confirm the role of mTOR complexes in I/R injury, we generated cardiac-specific mTOR-knockout (CKO) mice. In contrast to the effects of Torin1, CKO hearts recovered better after I/R injury than control hearts (p < 0.05). Interestingly, the CKO hearts had exhibited irregular contractions during the reperfusion phase. Calcium is a major factor in Excitation-Contraction (EC) coupling via Sarcoplasmic Reticulum (SR) calcium release. Calcium is also key in opening the mitochondrial permeability transition pore (mPTP) and cell death following I/R injury. Caffeine-induced SR calcium release in isolated CMs showed that total SR calcium content was lower in CKO than in control CMs. Western blotting showed that a significant amount of mTOR localizes to the SR/mitochondria and that GSK3-β phosphorylation, a key factor in SR calcium mobilization, was decreased. These findings suggest that cardiac mTOR located to the SR/mitochondria plays a vital role in EC coupling and cell survival in I/R injury.
Keywords: calcium; cardiomyocyte; ischemia-reperfusion; mTOR.
© 2021 The Authors. Physiological Reports published by Wiley Periodicals LLC on behalf of The Physiological Society and the American Physiological Society.
Conflict of interest statement
No conflicts of interest, financial, or otherwise, are declared by the authors.
Figures
Similar articles
-
Cardiac mTOR protects the heart against ischemia-reperfusion injury.Am J Physiol Heart Circ Physiol. 2012 Jul;303(1):H75-85. doi: 10.1152/ajpheart.00241.2012. Epub 2012 May 4. Am J Physiol Heart Circ Physiol. 2012. PMID: 22561297 Free PMC article.
-
Sestrin2 Attenuates Myocardial Endoplasmic Reticulum Stress and Cardiac Dysfunction During Ischemia/Reperfusion Injury.J Am Heart Assoc. 2024 Nov 5;13(21):e035193. doi: 10.1161/JAHA.124.035193. Epub 2024 Nov 4. J Am Heart Assoc. 2024. PMID: 39494564 Free PMC article.
-
Global knockout of ROMK potassium channel worsens cardiac ischemia-reperfusion injury but cardiomyocyte-specific knockout does not: Implications for the identity of mitoKATP.J Mol Cell Cardiol. 2020 Feb;139:176-189. doi: 10.1016/j.yjmcc.2020.01.010. Epub 2020 Jan 29. J Mol Cell Cardiol. 2020. PMID: 32004507 Free PMC article.
-
Ablation of phospholamban rescues reperfusion arrhythmias but exacerbates myocardium infarction in hearts with Ca2+/calmodulin kinase II constitutive phosphorylation of ryanodine receptors.Cardiovasc Res. 2019 Mar 1;115(3):556-569. doi: 10.1093/cvr/cvy213. Cardiovasc Res. 2019. PMID: 30169578 Free PMC article.
-
Mitochondrial Bioenergetics During Ischemia and Reperfusion.Adv Exp Med Biol. 2017;982:141-167. doi: 10.1007/978-3-319-55330-6_8. Adv Exp Med Biol. 2017. PMID: 28551786 Review.
Cited by
-
The role of autophagy in the progression of HIV infected cardiomyopathy.Front Cell Dev Biol. 2024 Jul 17;12:1372573. doi: 10.3389/fcell.2024.1372573. eCollection 2024. Front Cell Dev Biol. 2024. PMID: 39086659 Free PMC article. Review.
-
The mTOR Signaling Pathway: Key Regulator and Therapeutic Target for Heart Disease.Biomedicines. 2025 Feb 7;13(2):397. doi: 10.3390/biomedicines13020397. Biomedicines. 2025. PMID: 40002810 Free PMC article. Review.
References
-
- Andersson, K. B. , Winer, L. H. , Mork, H. K. , Molkentin, J. D. , & Jaisser, F. (2010). Tamoxifen administration routes and dosage for inducible Cre‐mediated gene disruption in mouse hearts. Transgenic Research, 19, 715–725. - PubMed
-
- Aoyagi, T. , Higa, J. K. , Aoyagi, H. , Yorichika, N. , Shimada, B. K. , & Matsui, T. (2015). Cardiac mTOR rescues the detrimental effects of diet‐induced obesity in the heart after ischemia‐reperfusion. American Journal of Physiology‐Heart and Circulatory Physiology, 308, H1530–H1539. - PMC - PubMed
-
- Aoyagi, T. , Kusakari, Y. , Xiao, C. Y. , Inouye, B. T. , Takahashi, M. , Scherrer‐Crosbie, M. , Rosenzweig, A. , Hara, K. , & Matsui, T. (2012). Cardiac mTOR protects the heart against ischemia‐reperfusion injury. American Journal of Physiology‐Heart and Circulatory Physiology, 303, H75–H85. - PMC - PubMed
-
- Baba, Y. , Higa, J. K. , Shimada, B. K. , Horiuchi, K. M. , Suhara, T. , Kobayashi, M. , Woo, J. D. , Aoyagi, H. , Marh, K. S. , Kitaoka, H. , & Matsui, T. (2018). Protective effects of the mechanistic target of rapamycin against excess iron and ferroptosis in cardiomyocytes. American Journal of Physiology‐Heart and Circulatory Physiology, 314, H659–H668. - PMC - PubMed
Publication types
MeSH terms
Substances
Grants and funding
LinkOut - more resources
Full Text Sources
Other Literature Sources
Molecular Biology Databases
Research Materials
Miscellaneous
