. 2021 Jun;25(6):1892-1903.
doi: 10.1109/JBHI.2021.3069169. Epub 2021 Jun 3.

COVID-19 in CXR: From Detection and Severity Scoring to Patient Disease Monitoring

COVID-19 in CXR: From Detection and Severity Scoring to Patient Disease Monitoring

Maayan Frid-Adar et al. IEEE J Biomed Health Inform. 2021 Jun.

Abstract

This work estimates the severity of pneumonia in COVID-19 patients and reports the findings of a longitudinal study of disease progression. It presents a deep learning model for simultaneous detection and localization of pneumonia in chest Xray (CXR) images, which is shown to generalize to COVID-19 pneumonia. The localization maps are utilized to calculate a "Pneumonia Ratio" which indicates disease severity. The assessment of disease severity serves to build a temporal disease extent profile for hospitalized patients. To validate the model's applicability to the patient monitoring task, we developed a validation strategy which involves a synthesis of Digital Reconstructed Radiographs (DRRs - synthetic Xray) from serial CT scans; we then compared the disease progression profiles that were generated from the DRRs to those that were generated from CT volumes.


Figures

Fig. 1.
Fig. 1.
Overview: Detection and localization models are described in Section III. The methods used for lung segmentation, severity assessment, patient monitoring and CT-DRR duality-based validation are presented in Section IV.
Fig. 2.
Fig. 2.
Diagram of the proposed Detection and Localization network. (a) Backbone: pre-trained ResNet50, (b) Detection Head: detection of pneumonia and (c) Localization Head: fuses intermediate convolutional layers of the ResNet50 to form a localization prediction.
Fig. 3.
Fig. 3.
Illustration of the training and testing stages of the Detection and Localization network.
Fig. 4.
Fig. 4.
Localization map results of example images as produced from the localization head and presented as heatmap images: (a) input CXR images, (b) heatmaps produced from first stage of the model (DLNet-1), (c) heatmaps produced from the second stage of the model (DLNet-2).
Fig. 5.
Fig. 5.
Two examples of synthesized abnormal CXR images: (a) normal image, (b) corresponding lung segmentation generated by XLSor and (c--f) abnormal CXRs augmented from the input image using MUNIT.
Fig. 6.
Fig. 6.
Severity score computation - Block diagram: The input image enters the detection and localization network. If the detection prediction is lower than a pre-determined threshold, the image is classified as negative; otherwise, a threshold is applied over the final localization output map to generate the pneumonia segmentation. At this point, the pneumonia segmentation and the lung segmentation blocks are utilized to compute the “Pneumonia Ratio”.
Fig. 7.
Fig. 7.
CT and Xray Duality for Patient monitoring. The block diagram shows the steps used to create the DRR; the Pneumonia Ratio can then be computed on both the CT image as well as on the generated synthetic CXR image. .
Fig. 8.
Fig. 8.
(a) Mean average precision (mAP) at different thresholds over the localization output of the network. The localization threshold that yields the maximum mAP is selected to produce the segmentations for the final model. (b) ROC curve of our model's performance on pneumonia detection.
Fig. 9.
Fig. 9.
Example results on the test set. The top row depicts successful predictions and the bottom row shows errors. Predictions and GT are shown as red and blue overlays, respectively.
Fig. 10.
Fig. 10.
(a) Scatter plot showing the relationship between the predicted and GT severity level. The dashed line corresponds to a perfect correlation and the solid blue line shows our linear regression model. (b) Confusion matrix showing the number of images that were scored with different combinations for severity scoring.
Fig. 11.
Fig. 11.
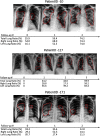
Example of patient monitoring over time in three patients using the pneumonia ratio.
Fig. 12.
Fig. 12.
Linear regression model depicting the relationship of the pneumonia ratio on DRRs vs. the ratio calculated on the CT volume.
Fig. 13.
Fig. 13.
Comparison of patient monitoring using the pneumonia ratios computed from CT volumes and the corresponding DRRs. The numbers in green (on the x-axis) represent the agreement between change trends of CXR and CT ratios that were used to calculate the accuracy of change. Interval between time points 3-4 is shaded out to reflect mild disease states based on the CT.

Similar articles

Cited by

References

    1. Singhal T., “A review of coronavirus disease-2019 (COVID-19),” Indian J. Pediatrics, vol. 87, no. 4,, pp. 281–286, 2020. - PMC - PubMed
    1. Chen N. et al., “Epidemiological and clinical characteristics of 99 cases of 2019 novel coronavirus pneumonia in Wuhan, China: A descriptive study,” Lancet, vol. 395, no. 10223, pp. 507–513, 2020. - PMC - PubMed
    1. Sohrabi C. et al., “World health organization declares global emergency: A review of the 2019 novel coronavirus (COVID-19),” Int. J. Surg., vol. 76, pp. 71–76, 2020. - PMC - PubMed
    1. Jacobi A., Chung M., Bernheim A., and Eber C., “Portable chest x-ray in coronavirus disease-19 (covid-19): A pictorial review,” Clinical Imaging, vol. 64, pp. 35.42, 2020. [Online]. Available: https://www.sciencedirect.com/science/article/pii/S0899707120301017 - PMC - PubMed
    1. Rubin G. D. et al., “The role of chest imaging in patient management during the COVID-19 pandemic: A multinational consensus statement from the Fleischner society,” Chest, vol. 158, no. 1, pp. 106–116, 2020. - PMC - PubMed