

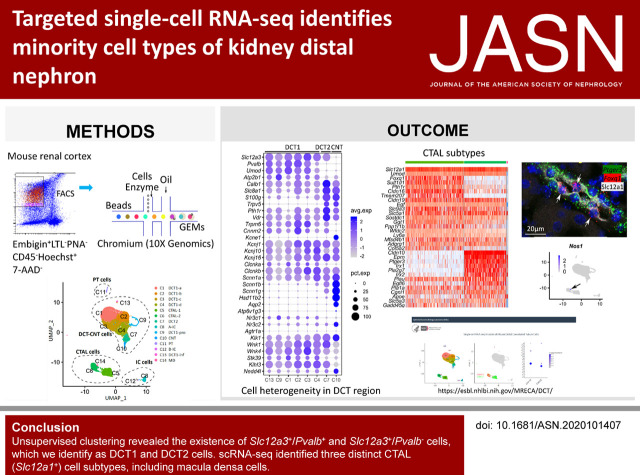
Targeted Single-Cell RNA-seq Identifies Minority Cell Types of Kidney Distal Nephron
- PMID: 33769948
- PMCID: PMC8017539
- DOI: 10.1681/ASN.2020101407
Targeted Single-Cell RNA-seq Identifies Minority Cell Types of Kidney Distal Nephron
Abstract
Background: Proximal tubule cells dominate the kidney parenchyma numerically, although less abundant cell types of the distal nephron have disproportionate roles in water and electrolyte balance.
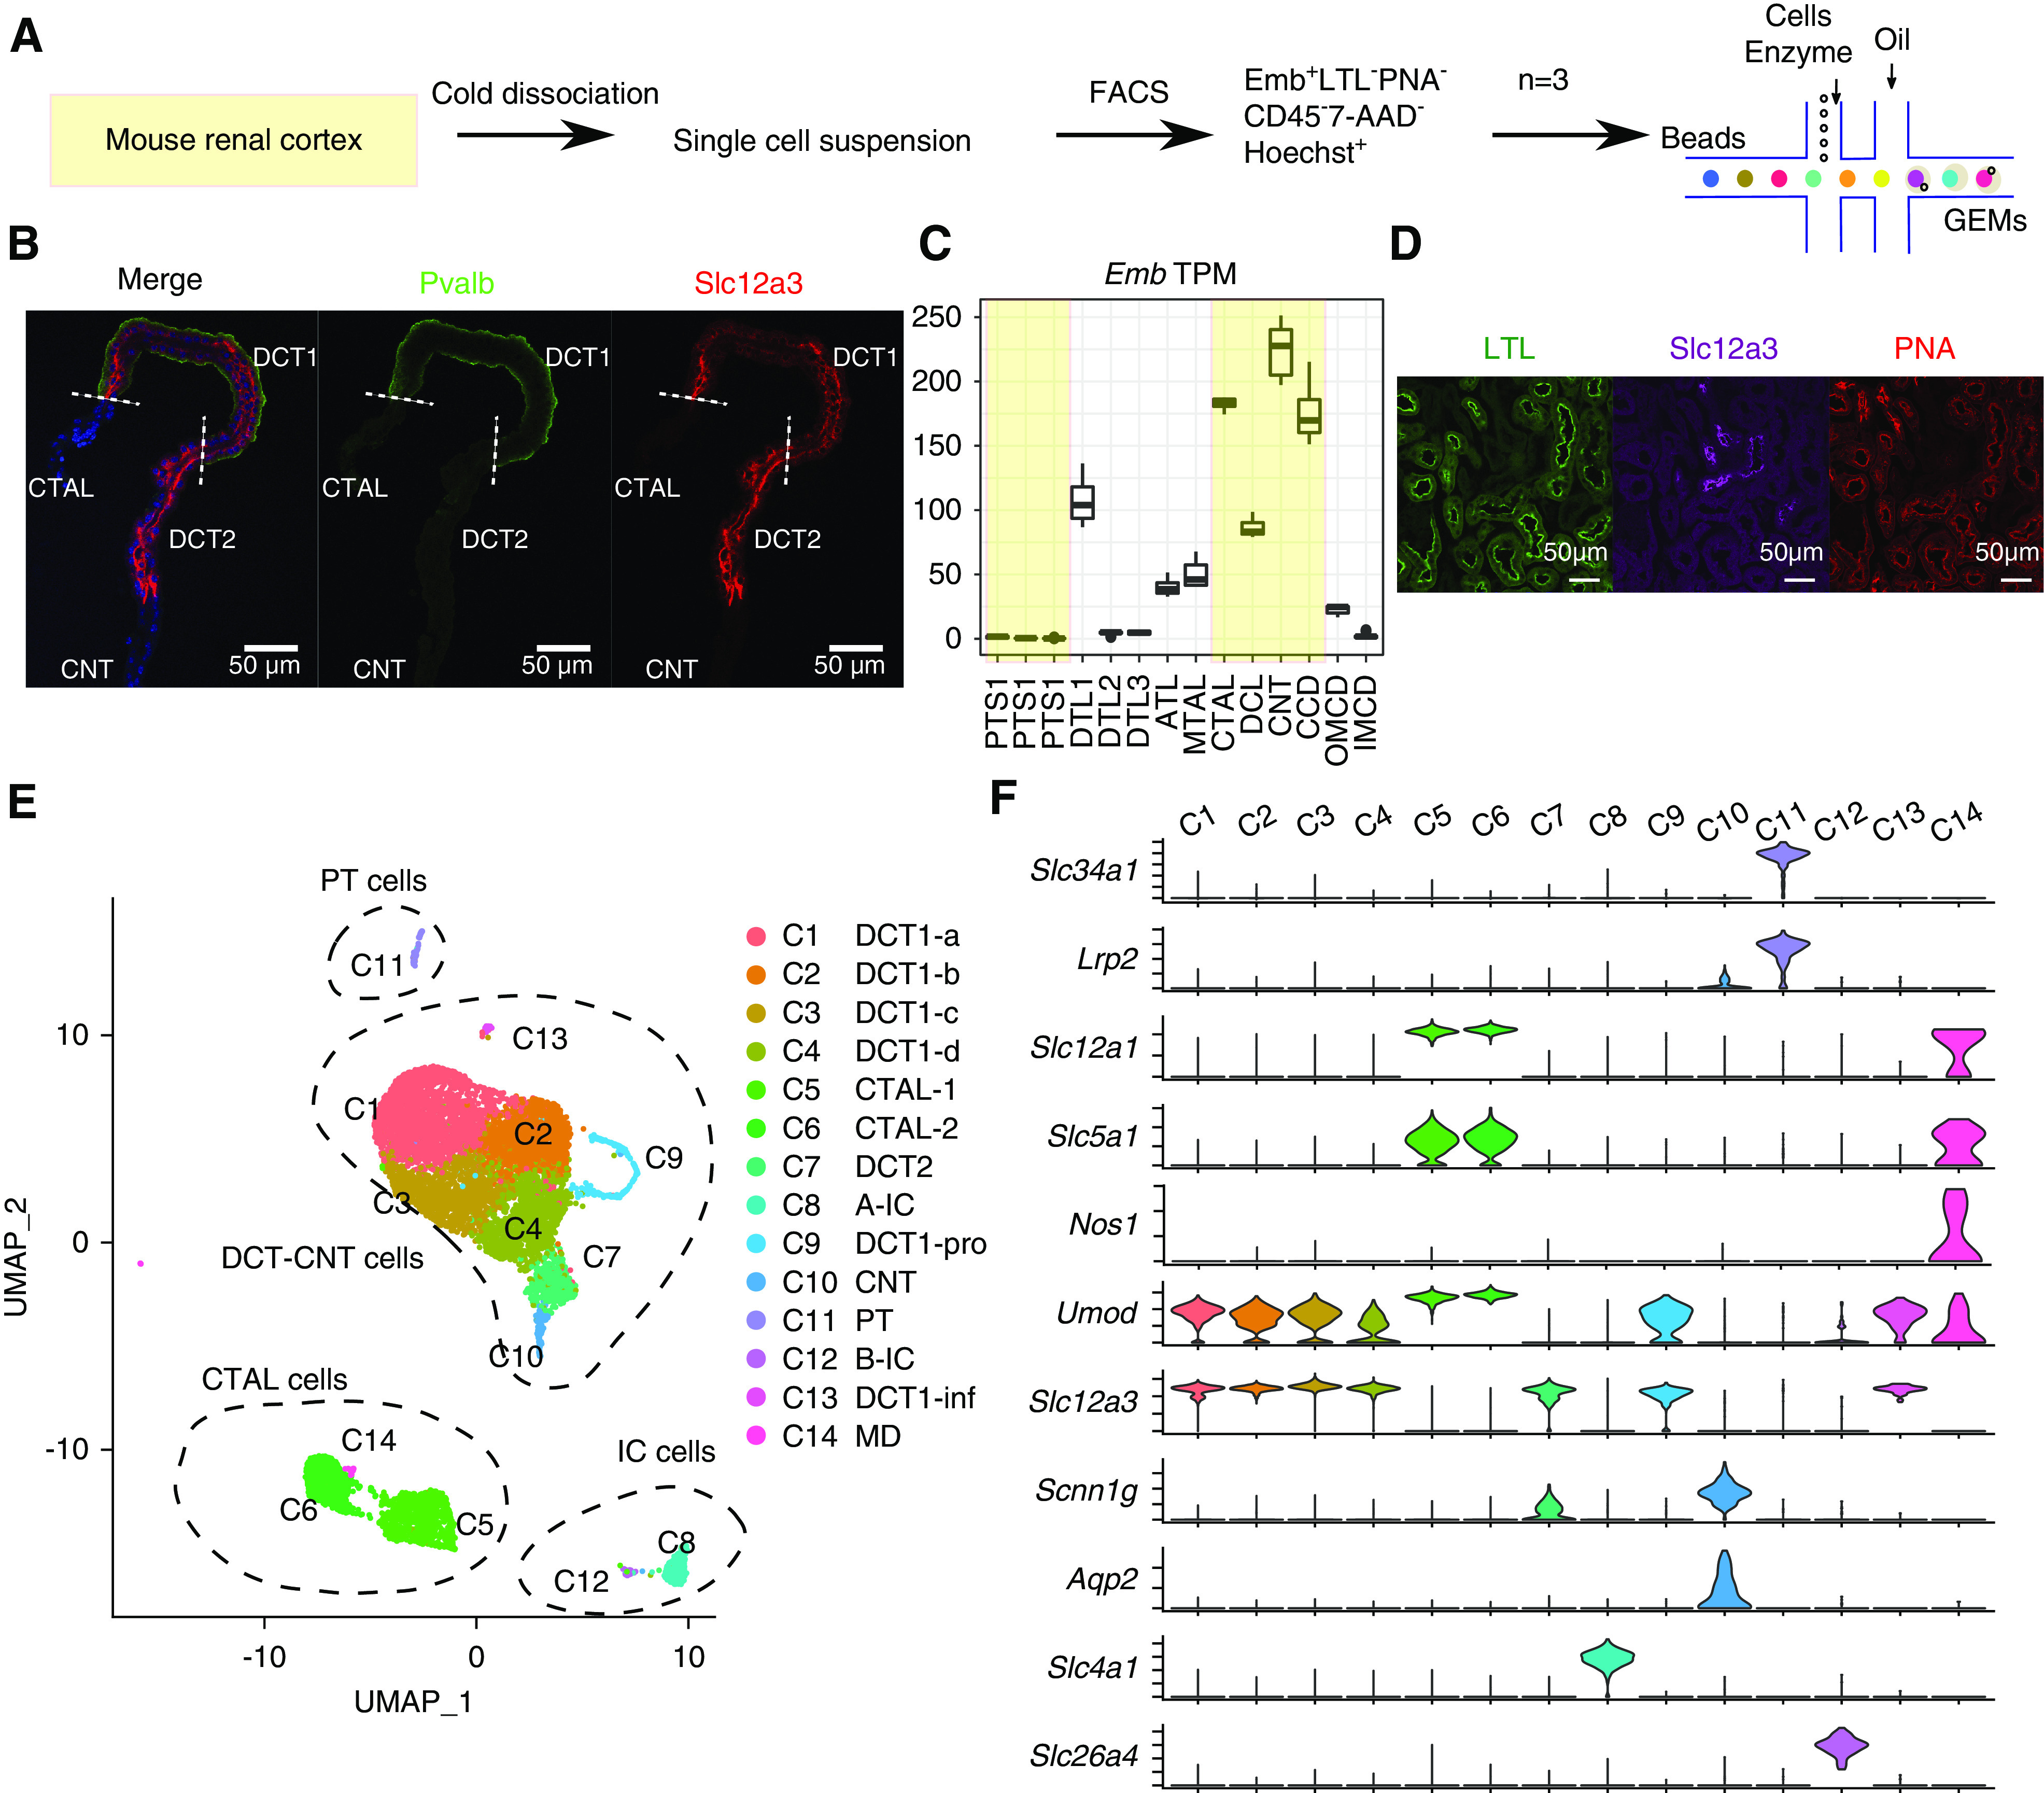
Methods: Coupling of a FACS-based enrichment protocol with single-cell RNA-seq profiled the transcriptomes of 9099 cells from the thick ascending limb (CTAL)/distal convoluted tubule (DCT) region of the mouse nephron.
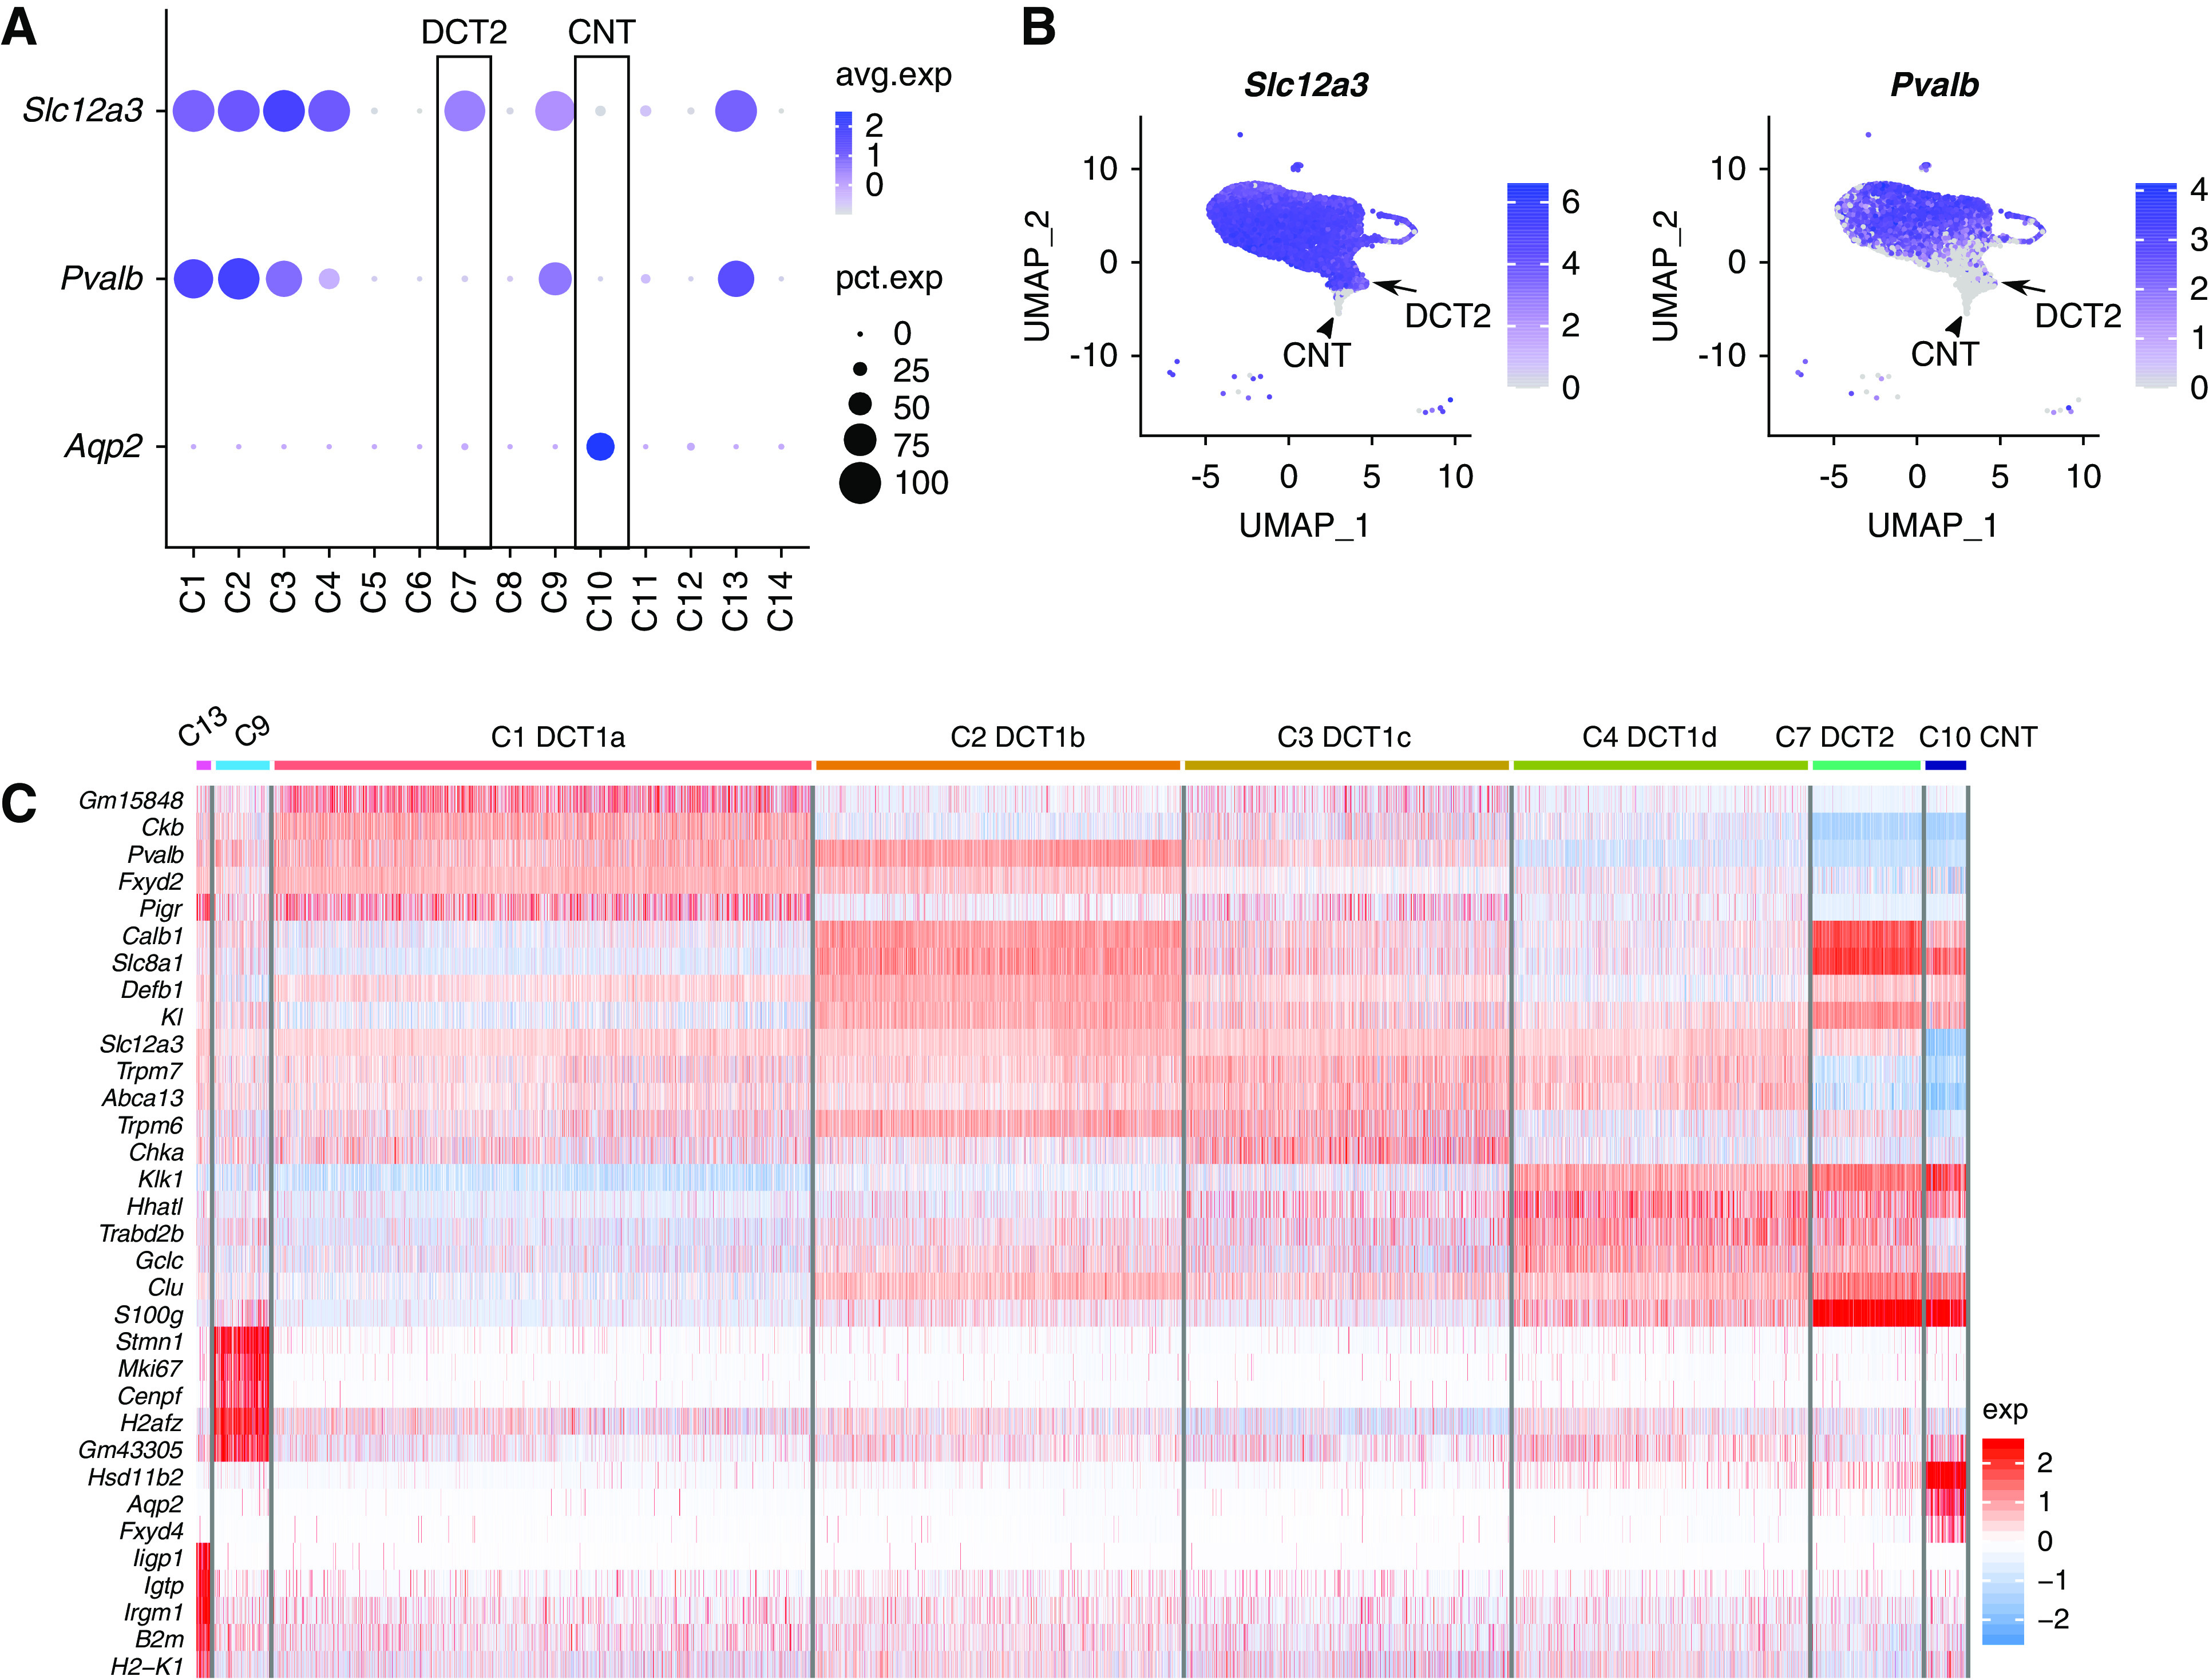
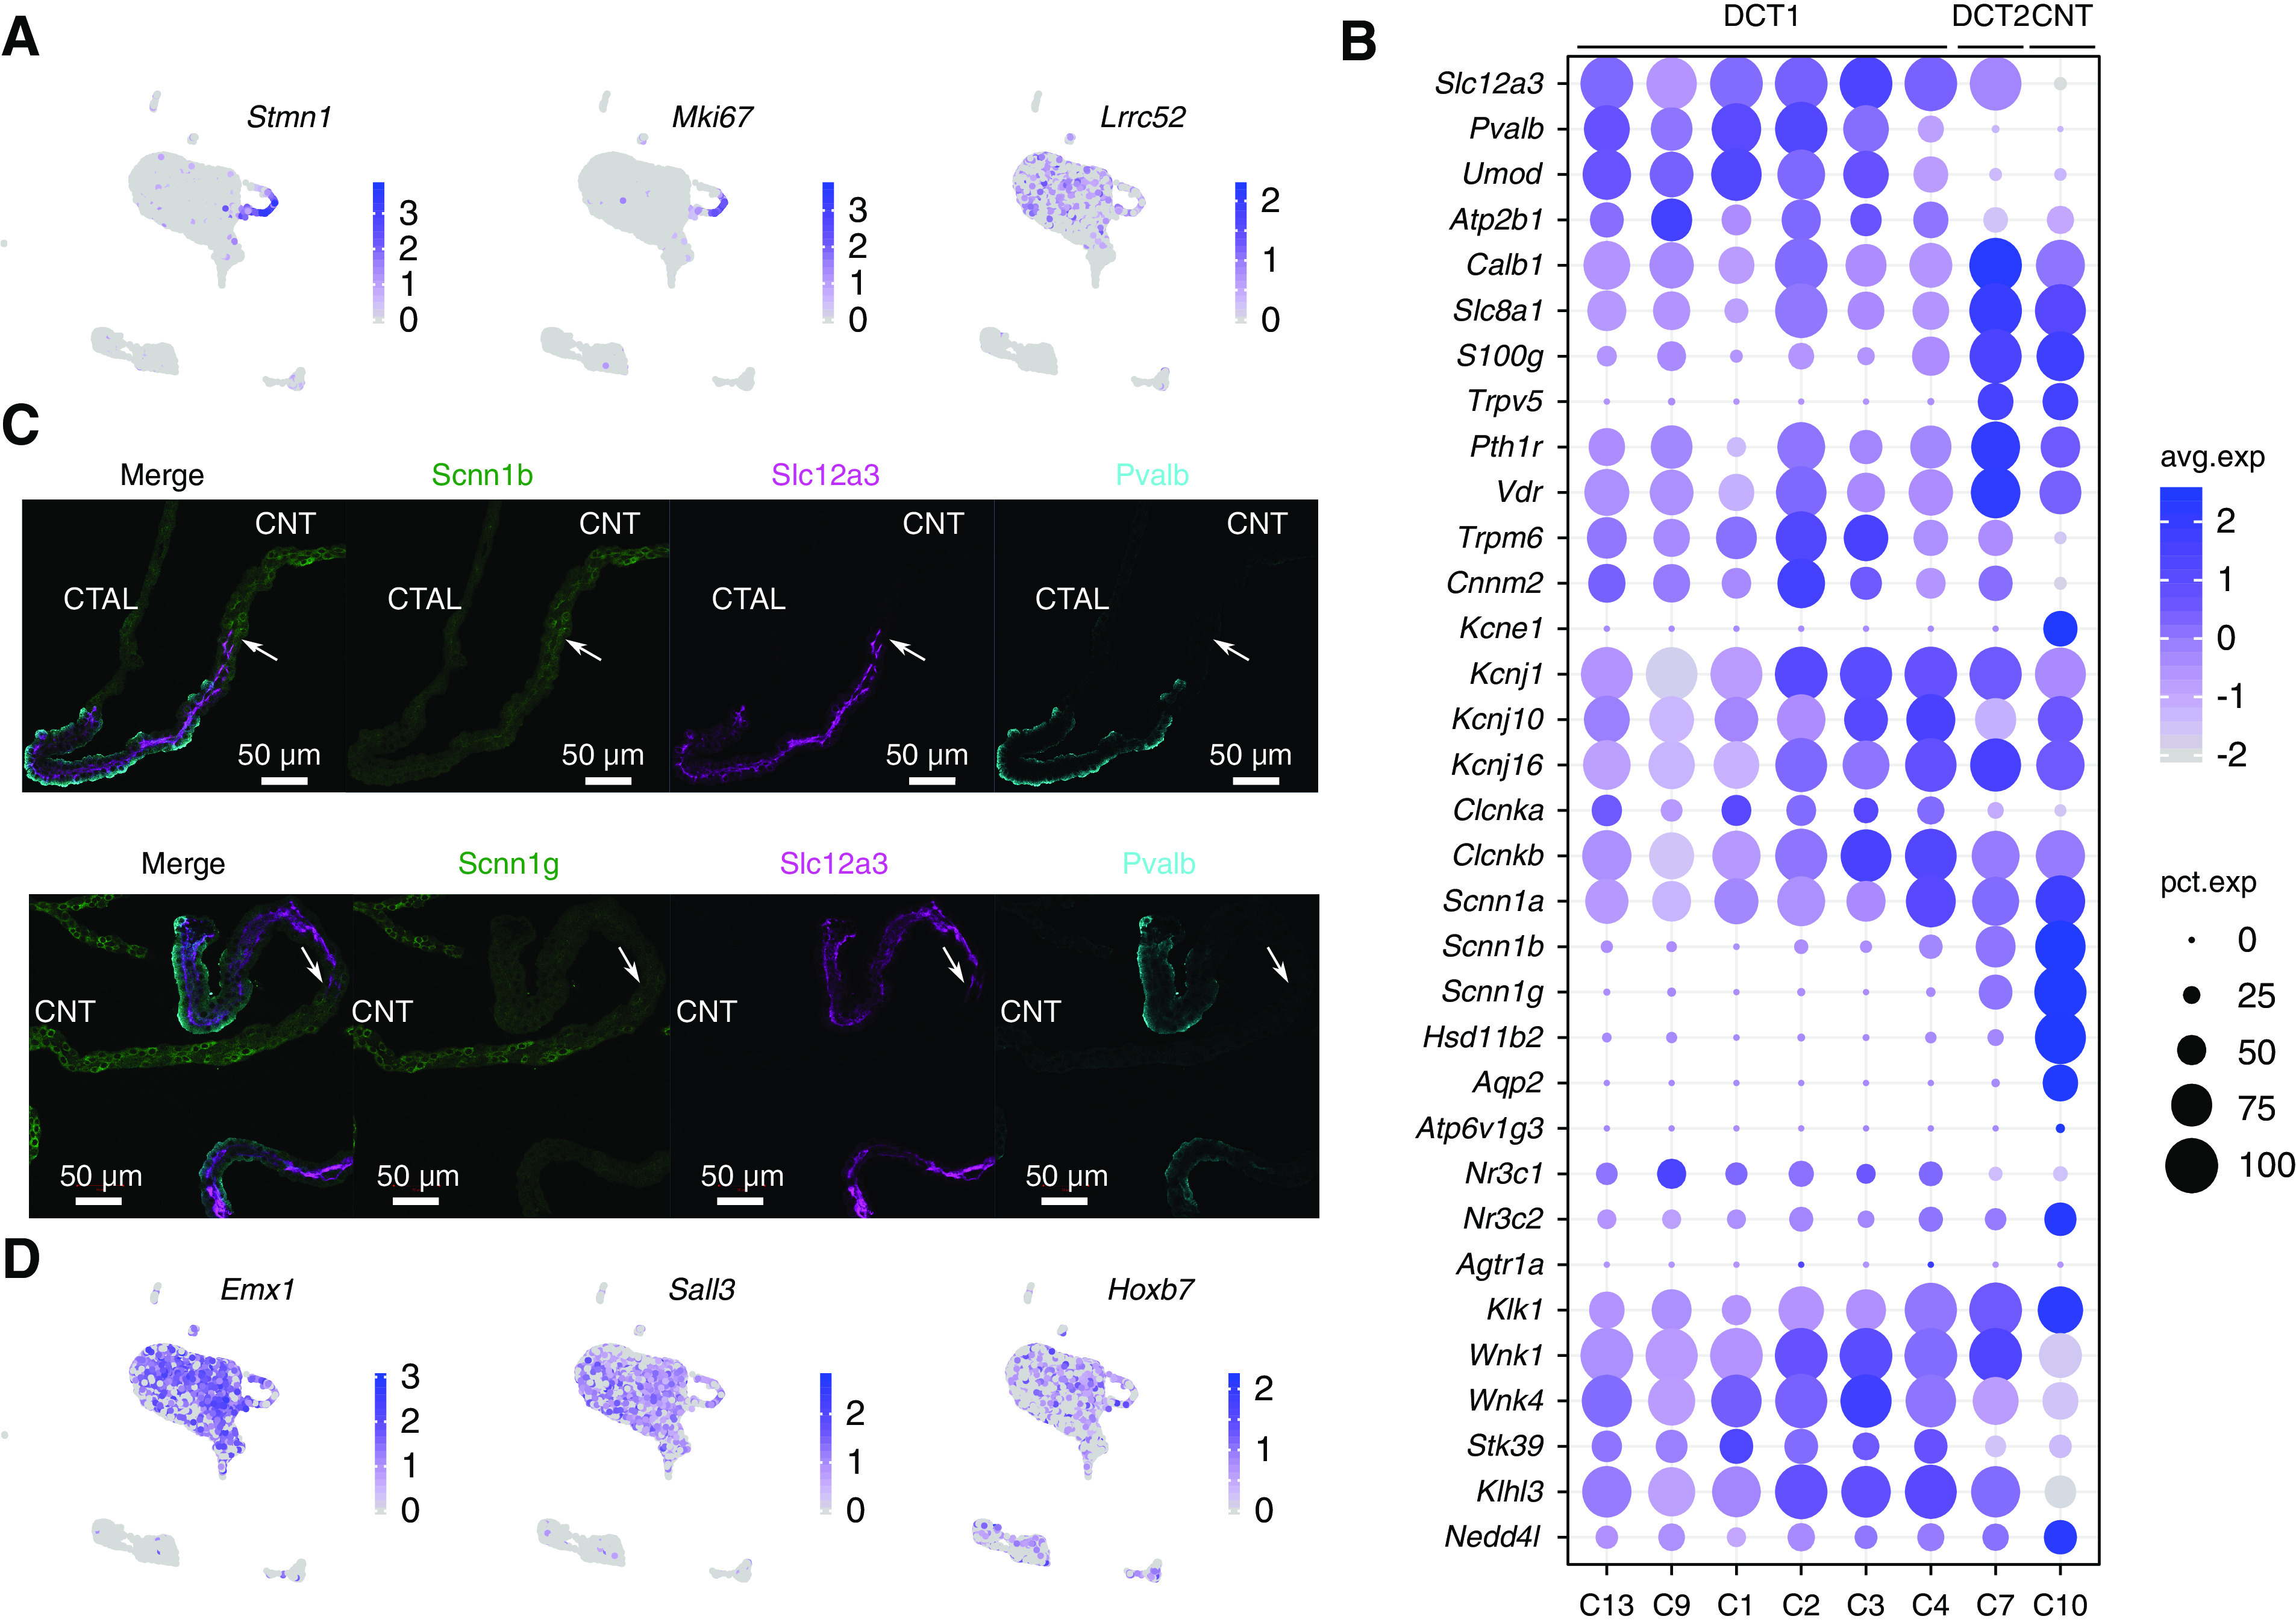
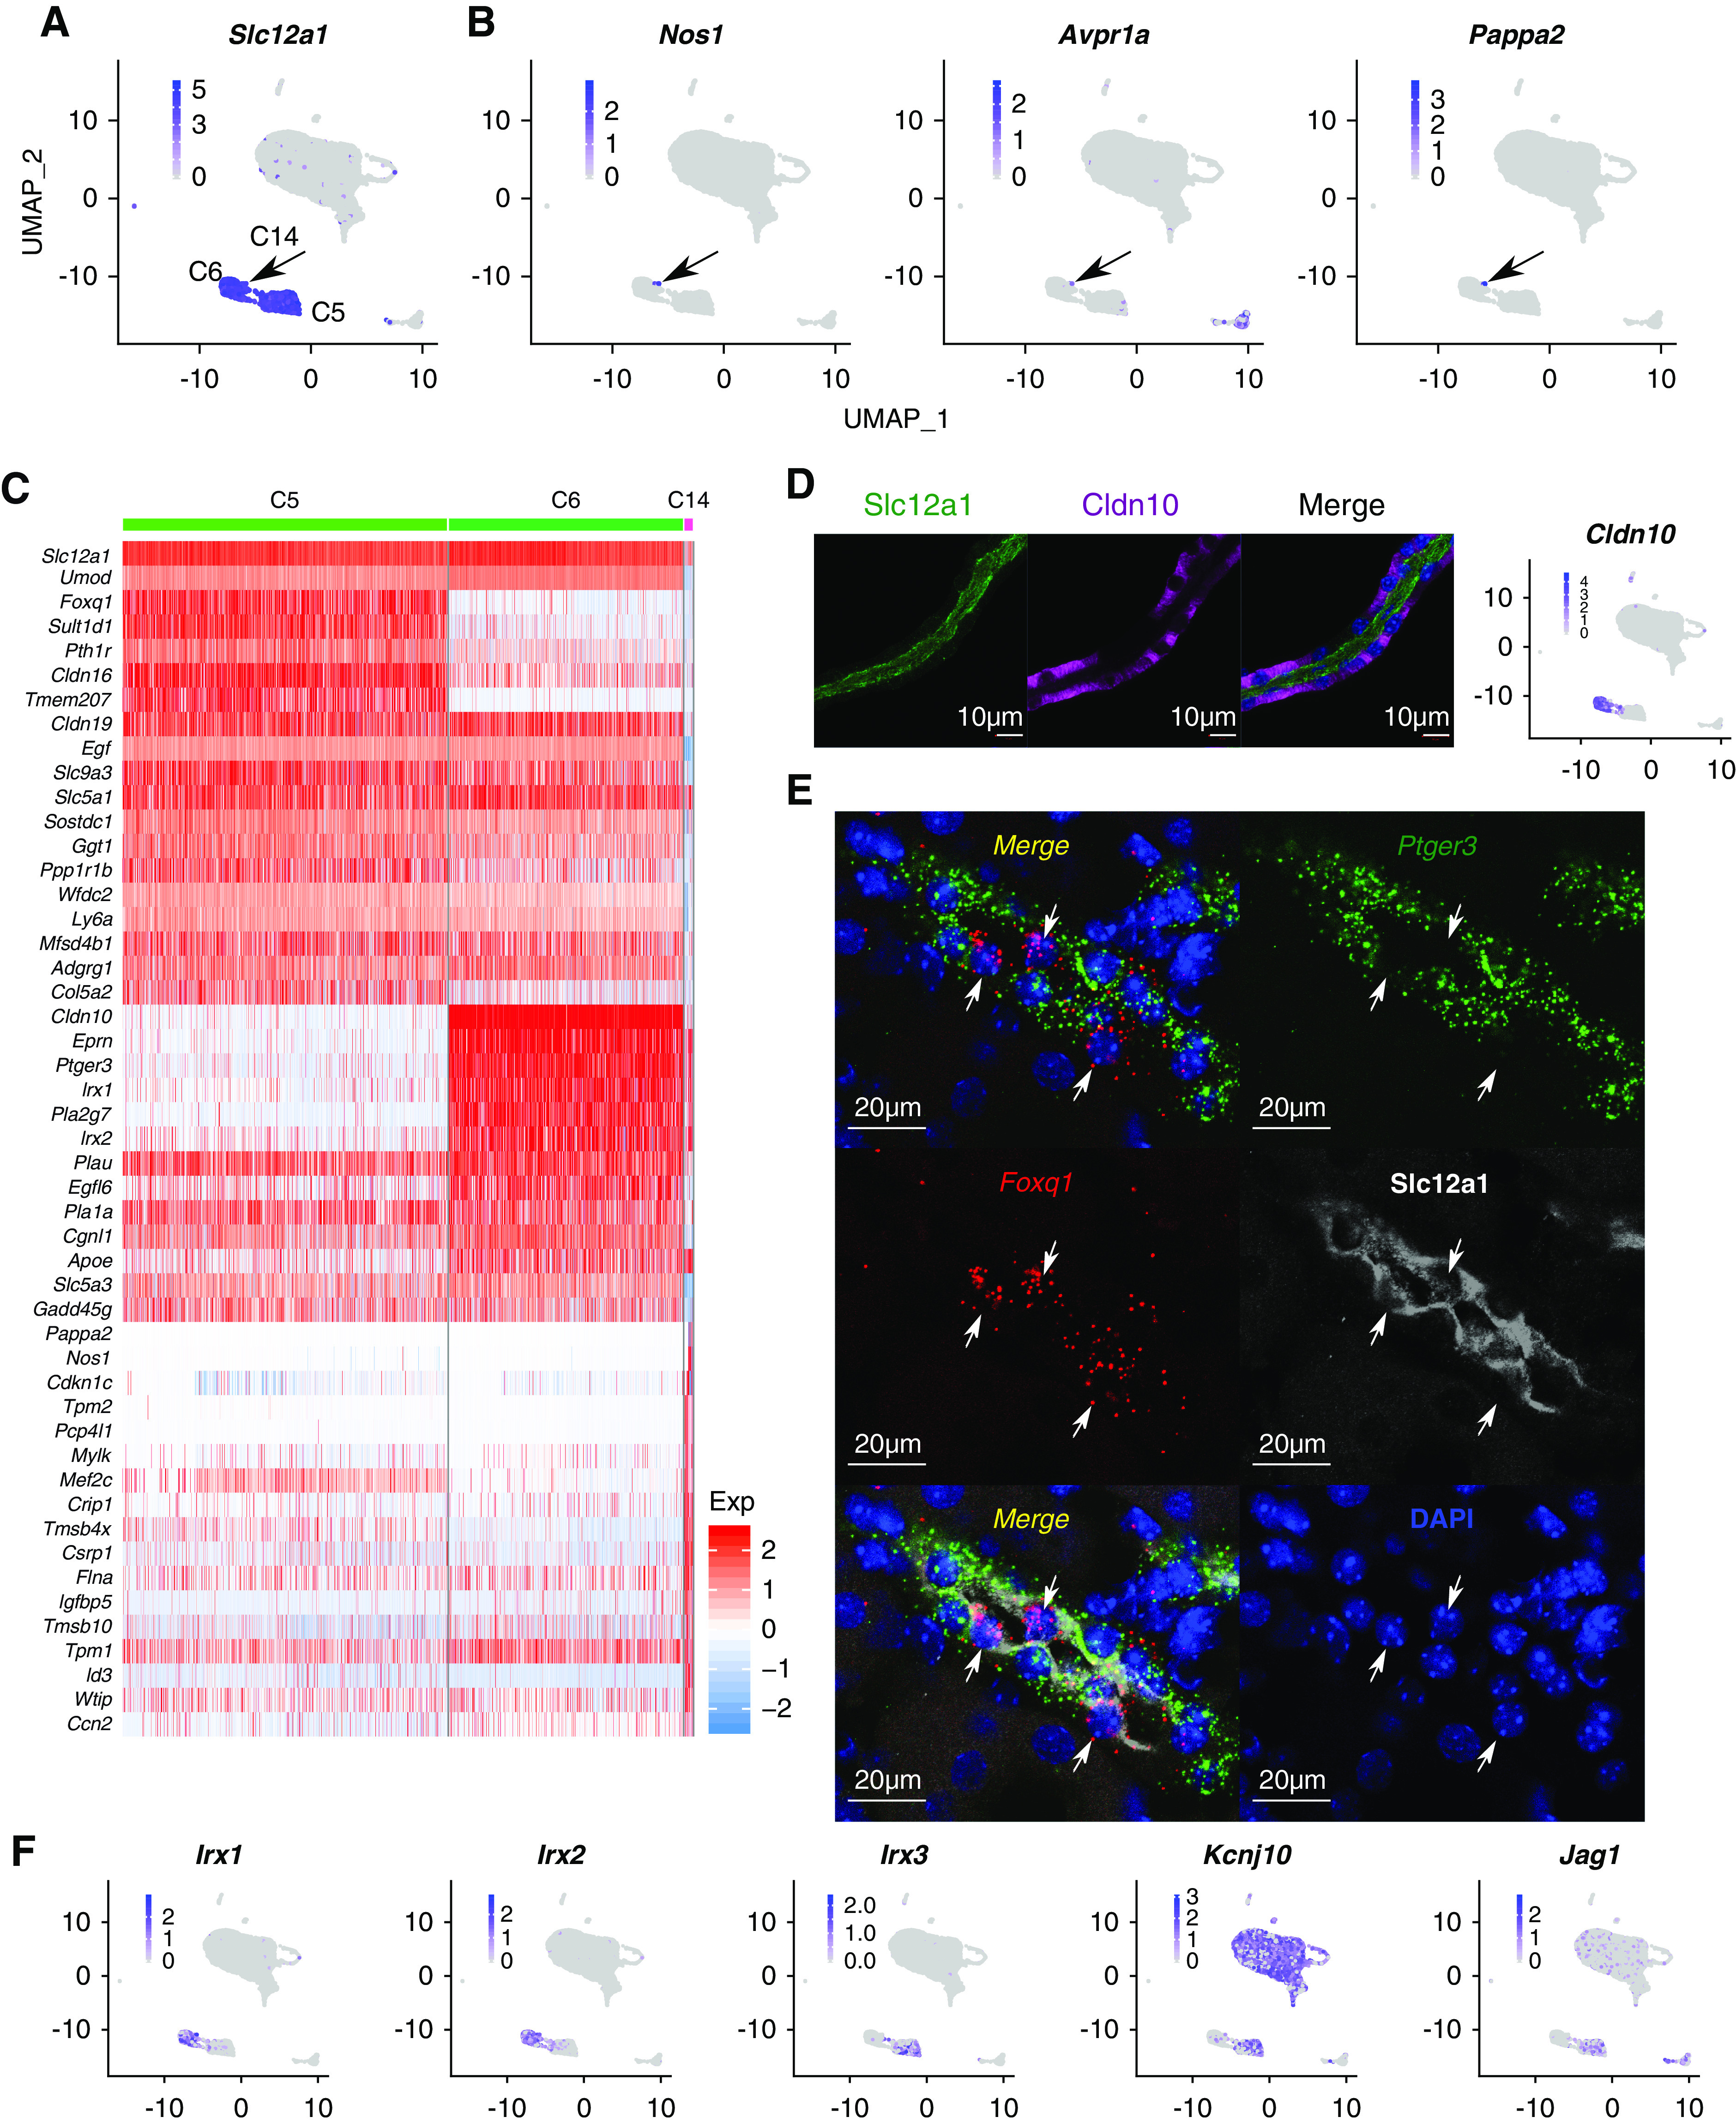
Results: Unsupervised clustering revealed Slc12a3 +/Pvalb + and Slc12a3 +/Pvalb - cells, identified as DCT1 and DCT2 cells, respectively. DCT1 cells appear to be heterogeneous, with orthogonally variable expression of Slc8a1, Calb1, and Ckb. An additional DCT1 subcluster showed marked enrichment of cell cycle-/cell proliferation-associated mRNAs (e.g., Mki67, Stmn1, and Top2a), which fit with the known plasticity of DCT cells. No DCT2-specific transcripts were found. DCT2 cells contrast with DCT1 cells by expression of epithelial sodium channel β- and γ-subunits and much stronger expression of transcripts associated with calcium transport (Trpv5, Calb1, S100g, and Slc8a1). Additionally, scRNA-seq identified three distinct CTAL (Slc12a1 +) cell subtypes. One of these expressed Nos1 and Avpr1a, consistent with macula densa cells. The other two CTAL clusters were distinguished by Cldn10 and Ptger3 in one and Cldn16 and Foxq1 in the other. These two CTAL cell types were also distinguished by expression of alternative Iroquois homeobox transcription factors, with Irx1 and Irx2 in the Cldn10 + CTAL cells and Irx3 in the Cldn16 + CTAL cells.
Conclusions: Single-cell transcriptomics revealed unexpected diversity among the cells of the distal nephron in mouse. Web-based data resources are provided for the single-cell data.
Keywords: distal convoluted tubule; macula densa; scRNA-seq; thick ascending limb.
Copyright © 2021 by the American Society of Nephrology.
Figures
Comment in
-
Me Or Your Own Eyes: RNA-Seq and the Kidney.J Am Soc Nephrol. 2021 Apr;32(4):768-771. doi: 10.1681/ASN.2021010017. Epub 2021 Mar 4. J Am Soc Nephrol. 2021. PMID: 33769950 Free PMC article. No abstract available.
References
-
- Reilly RF, Ellison DH: Mammalian distal tubule: Physiology, pathophysiology, and molecular anatomy. Physiol Rev 80: 277–313, 2000 - PubMed
-
- Kriz W, Bankir L: A standard nomenclature for structures of the kidney.The Renal Commission of the International Union of Physiological Sciences (IUPS). Kidney Int 33: 1–7, 1988 - PubMed
Grants and funding
LinkOut - more resources
Full Text Sources
Other Literature Sources
Molecular Biology Databases
Research Materials
Miscellaneous
