. 2021 Apr;32(4):897-912.
doi: 10.1681/ASN.2020101406. Epub 2021 Mar 4.

A Comprehensive Map of mRNAs and Their Isoforms across All 14 Renal Tubule Segments of Mouse

Affiliations

A Comprehensive Map of mRNAs and Their Isoforms across All 14 Renal Tubule Segments of Mouse

Lihe Chen et al. J Am Soc Nephrol. 2021 Apr.

Abstract

Background: The repertoire of protein expression along the renal tubule depends both on regulation of transcription and regulation of alternative splicing that can generate multiple proteins from a single gene.

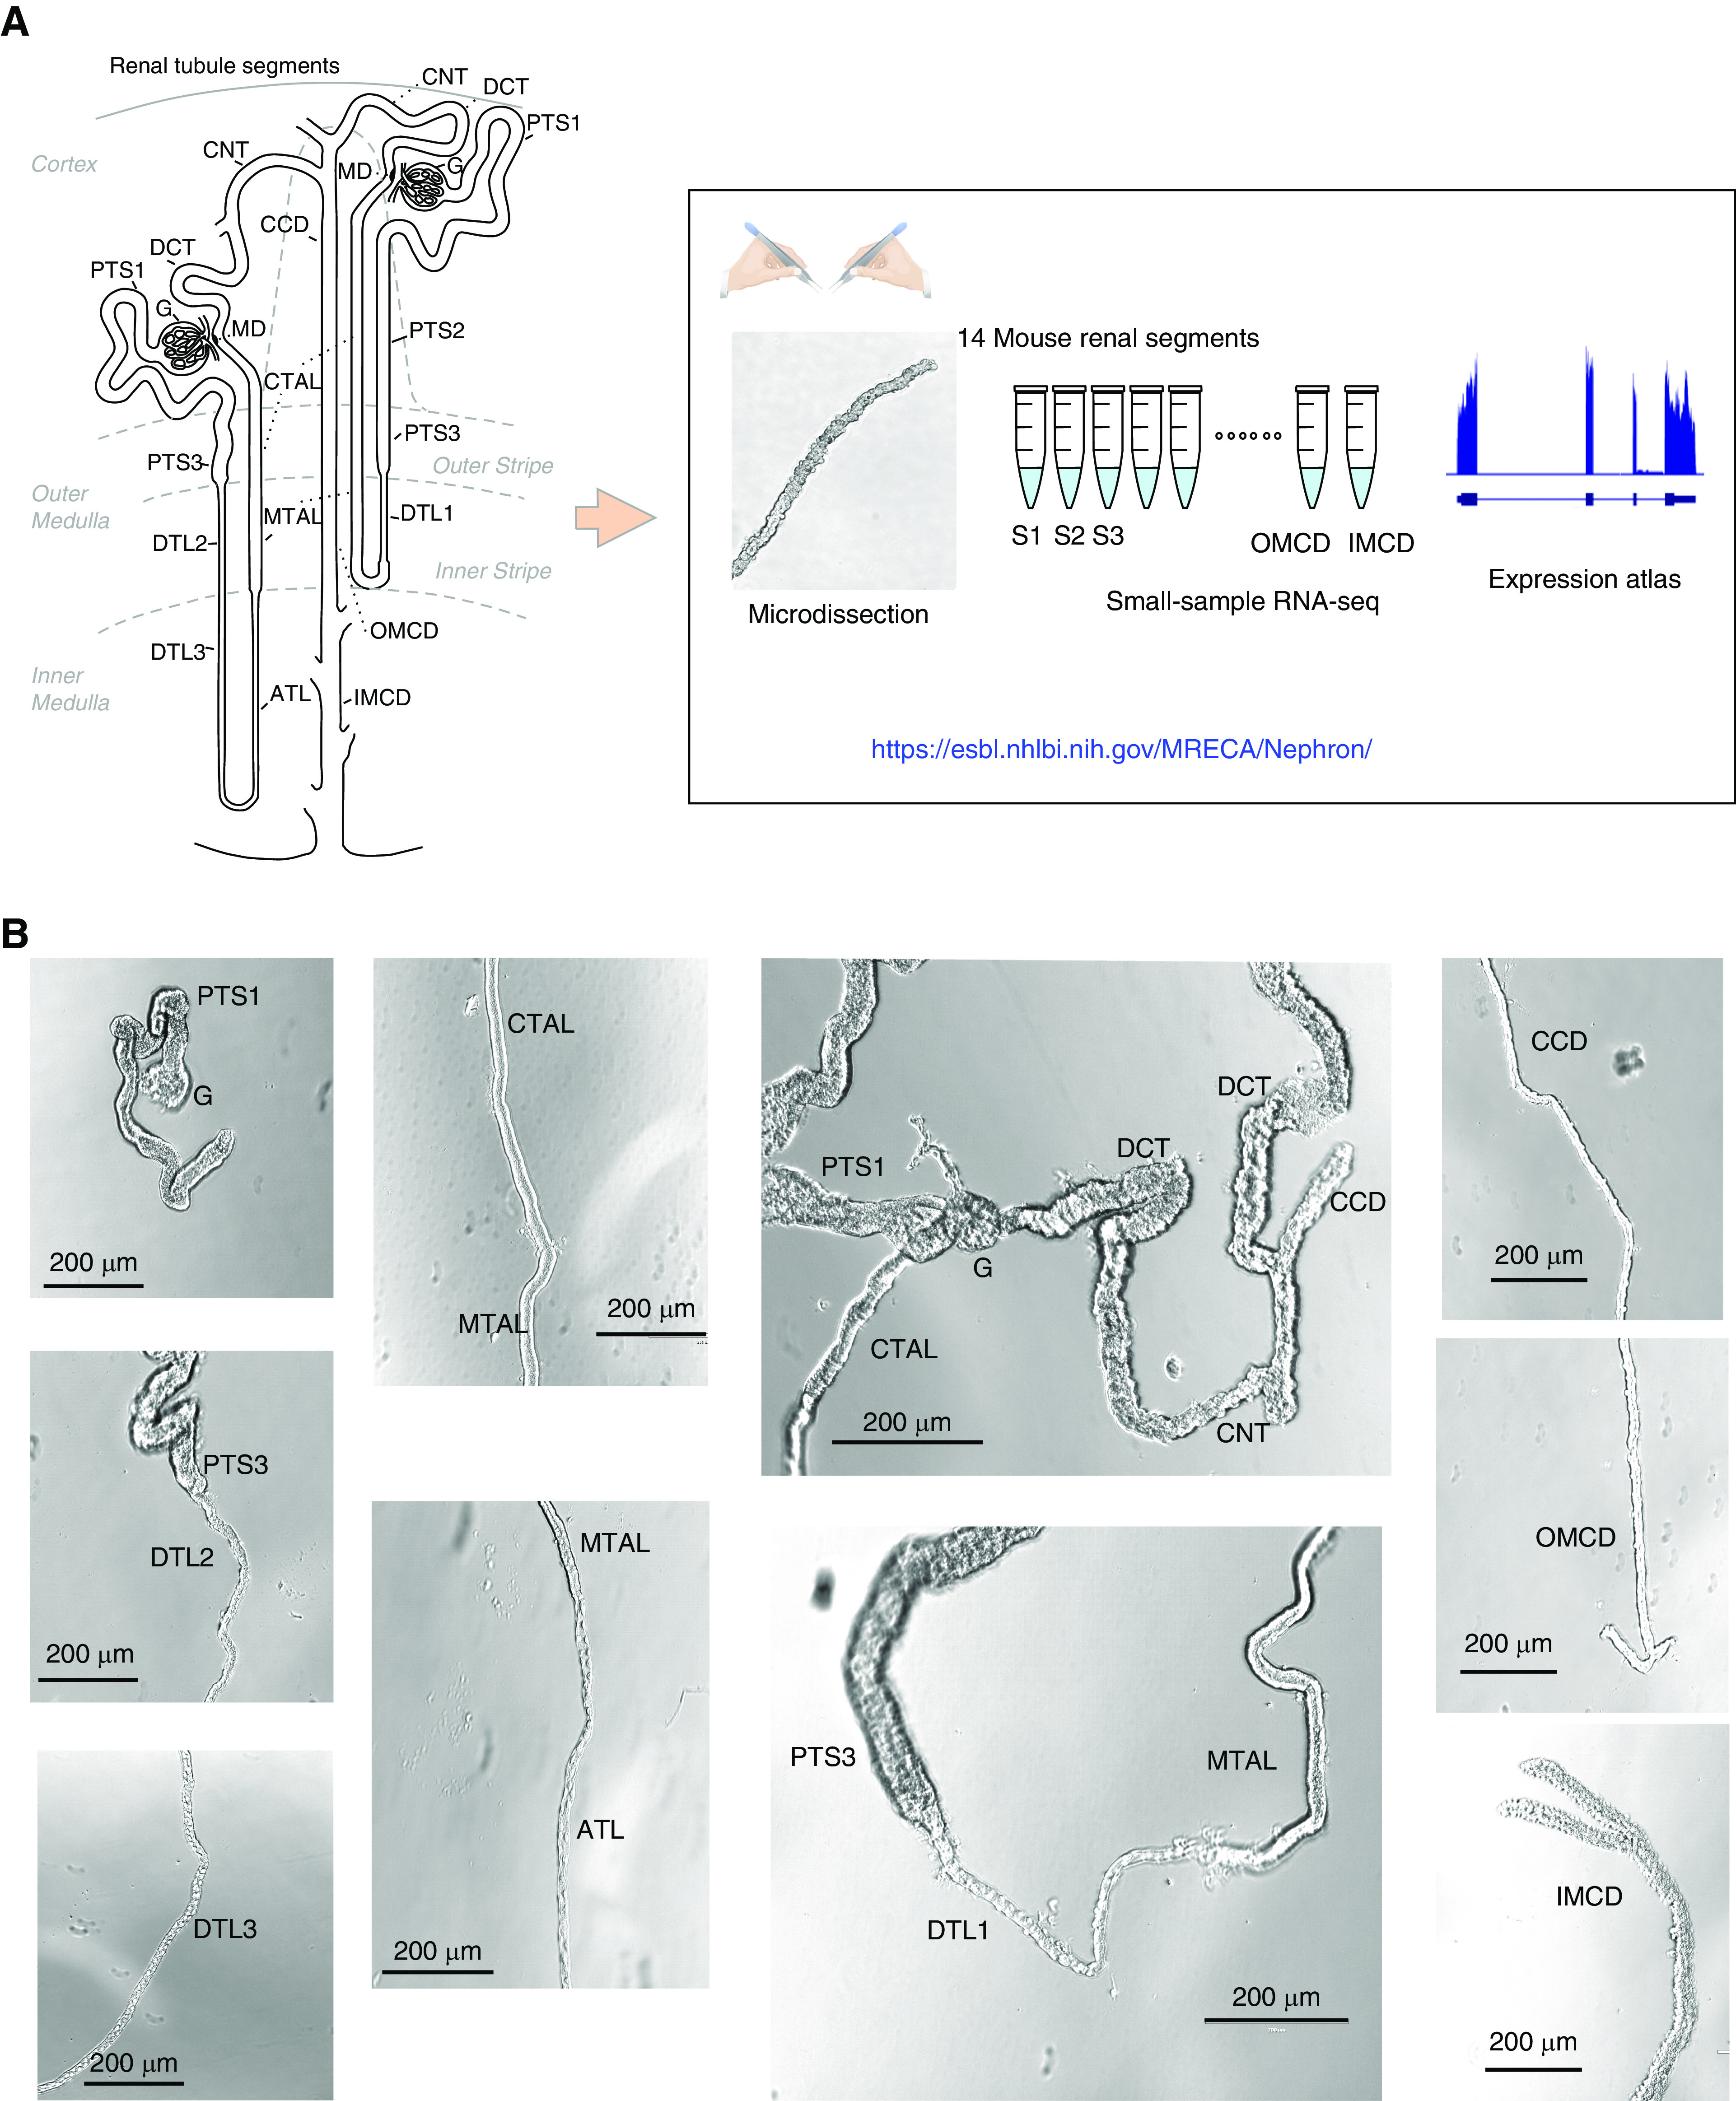
Methods: A full-length, small-sample RNA-seq protocol profiled transcriptomes for all 14 renal tubule segments microdissected from mouse kidneys.

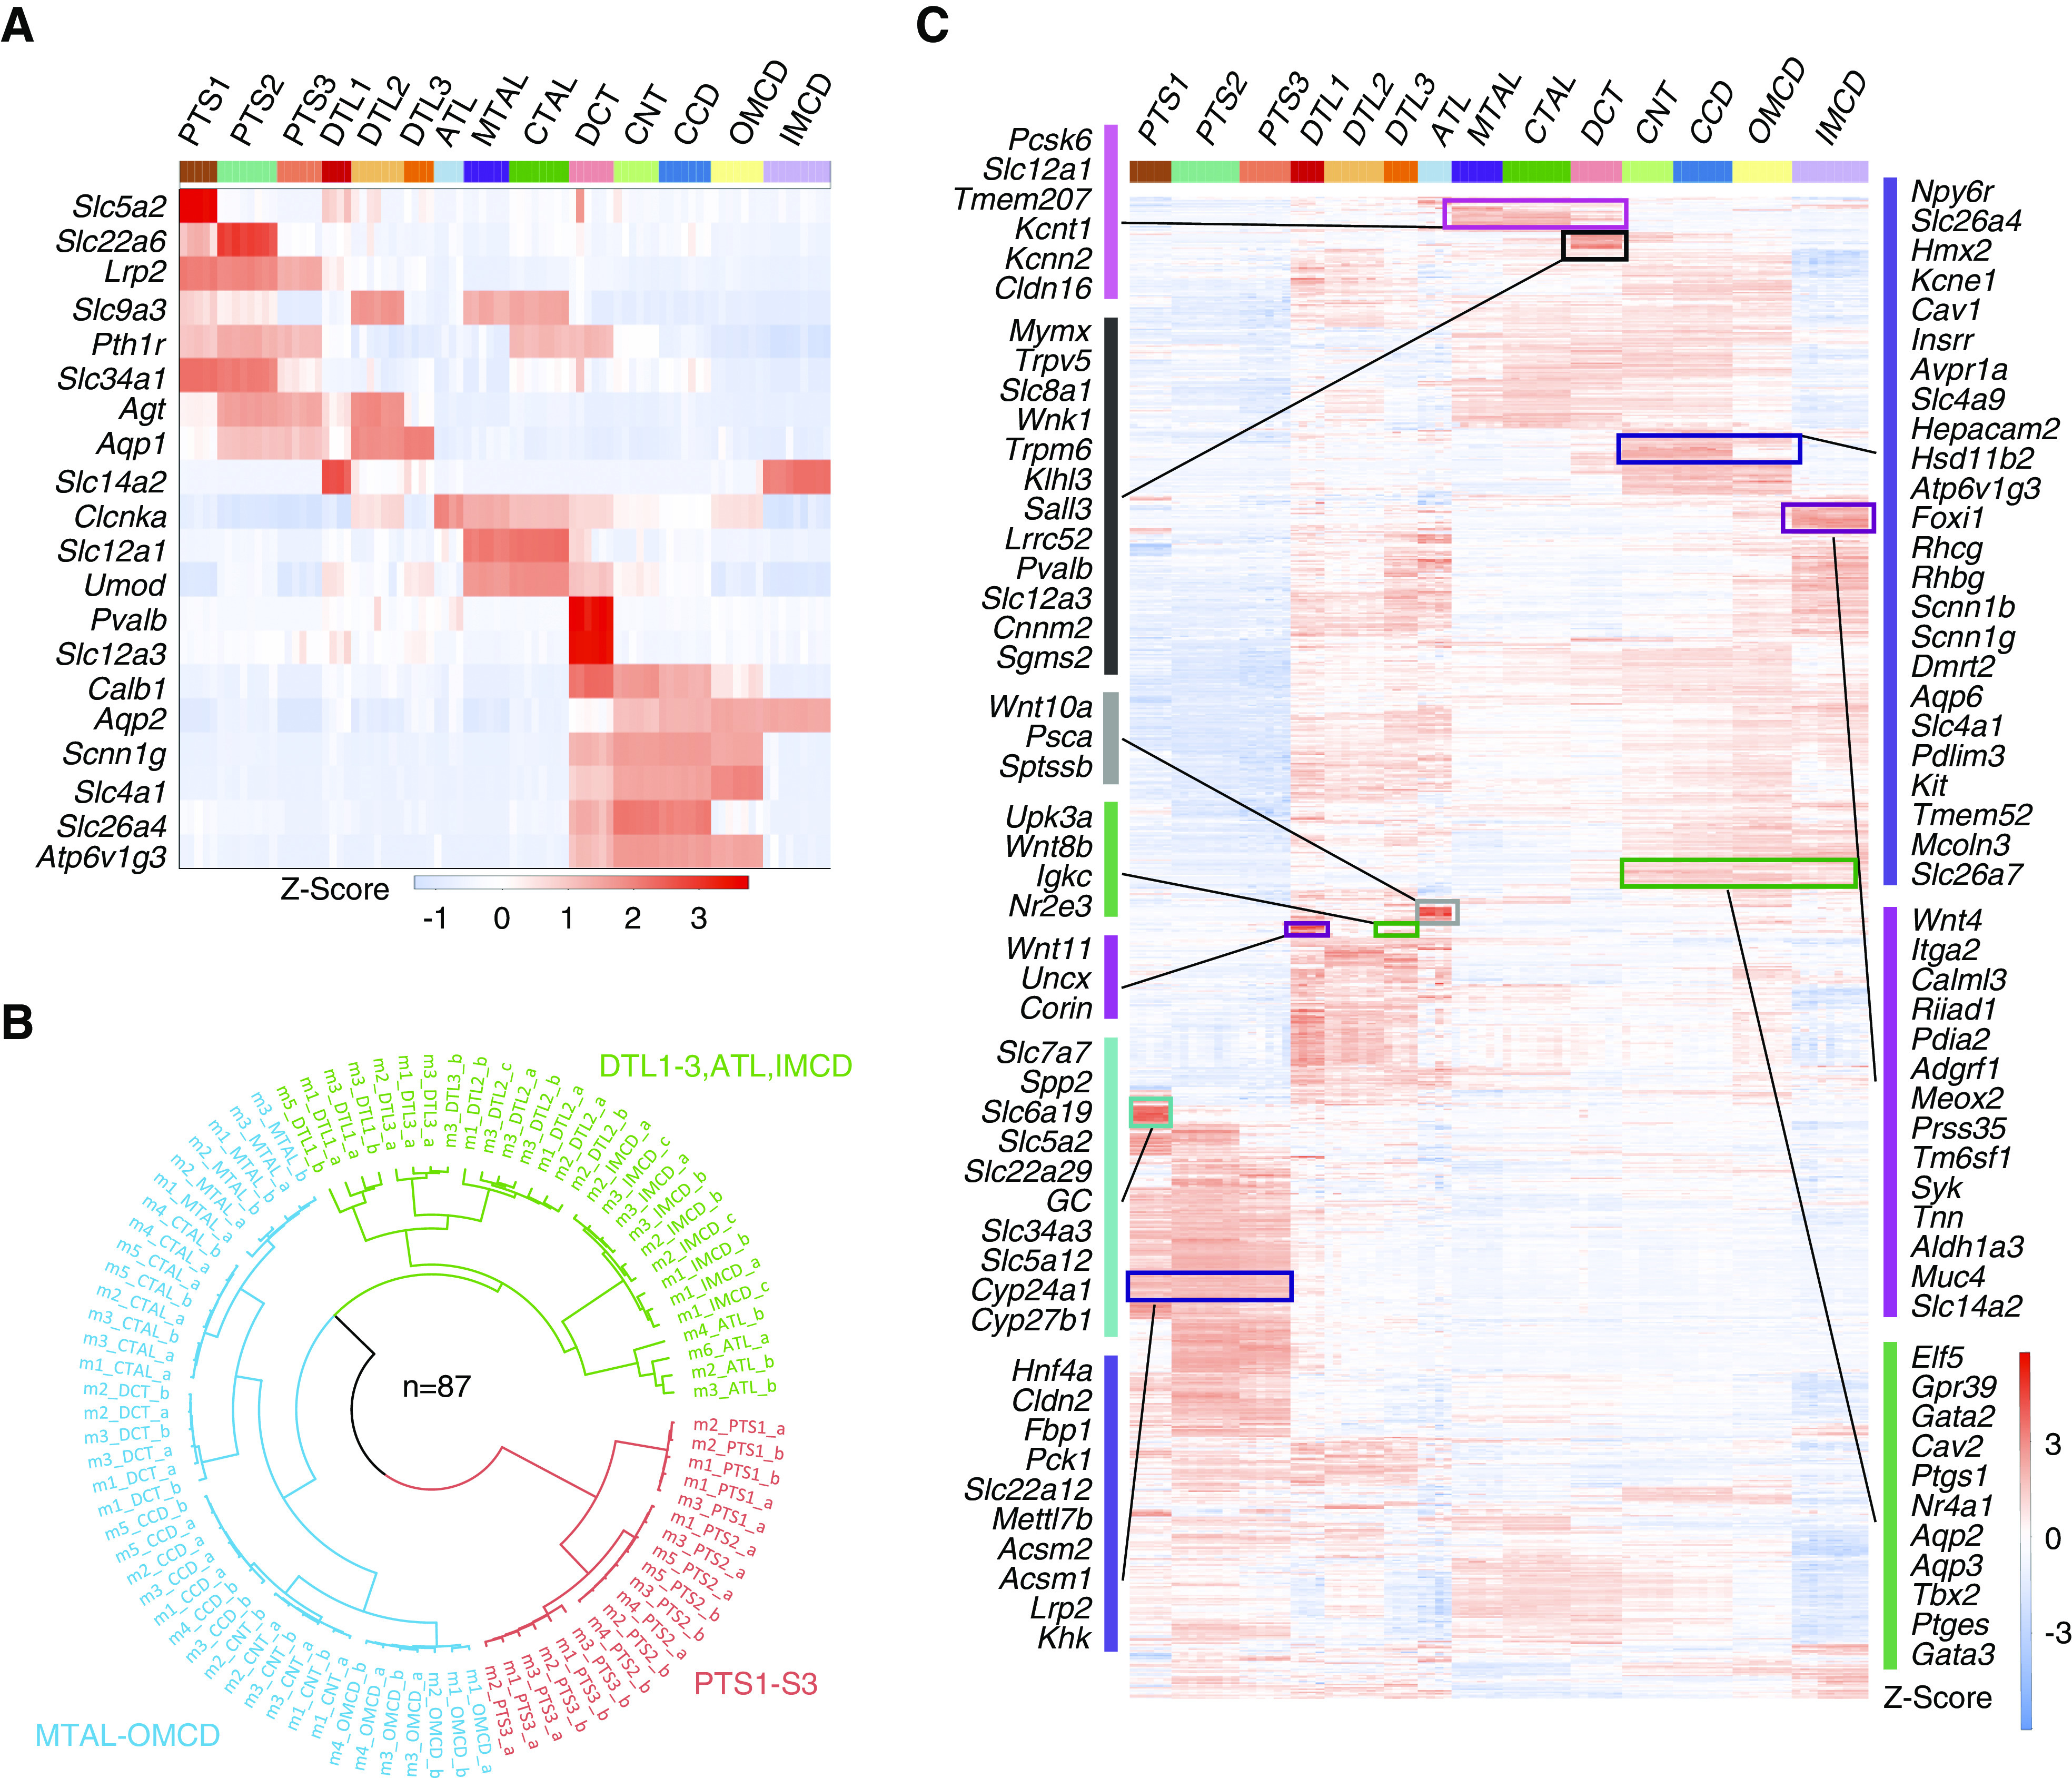
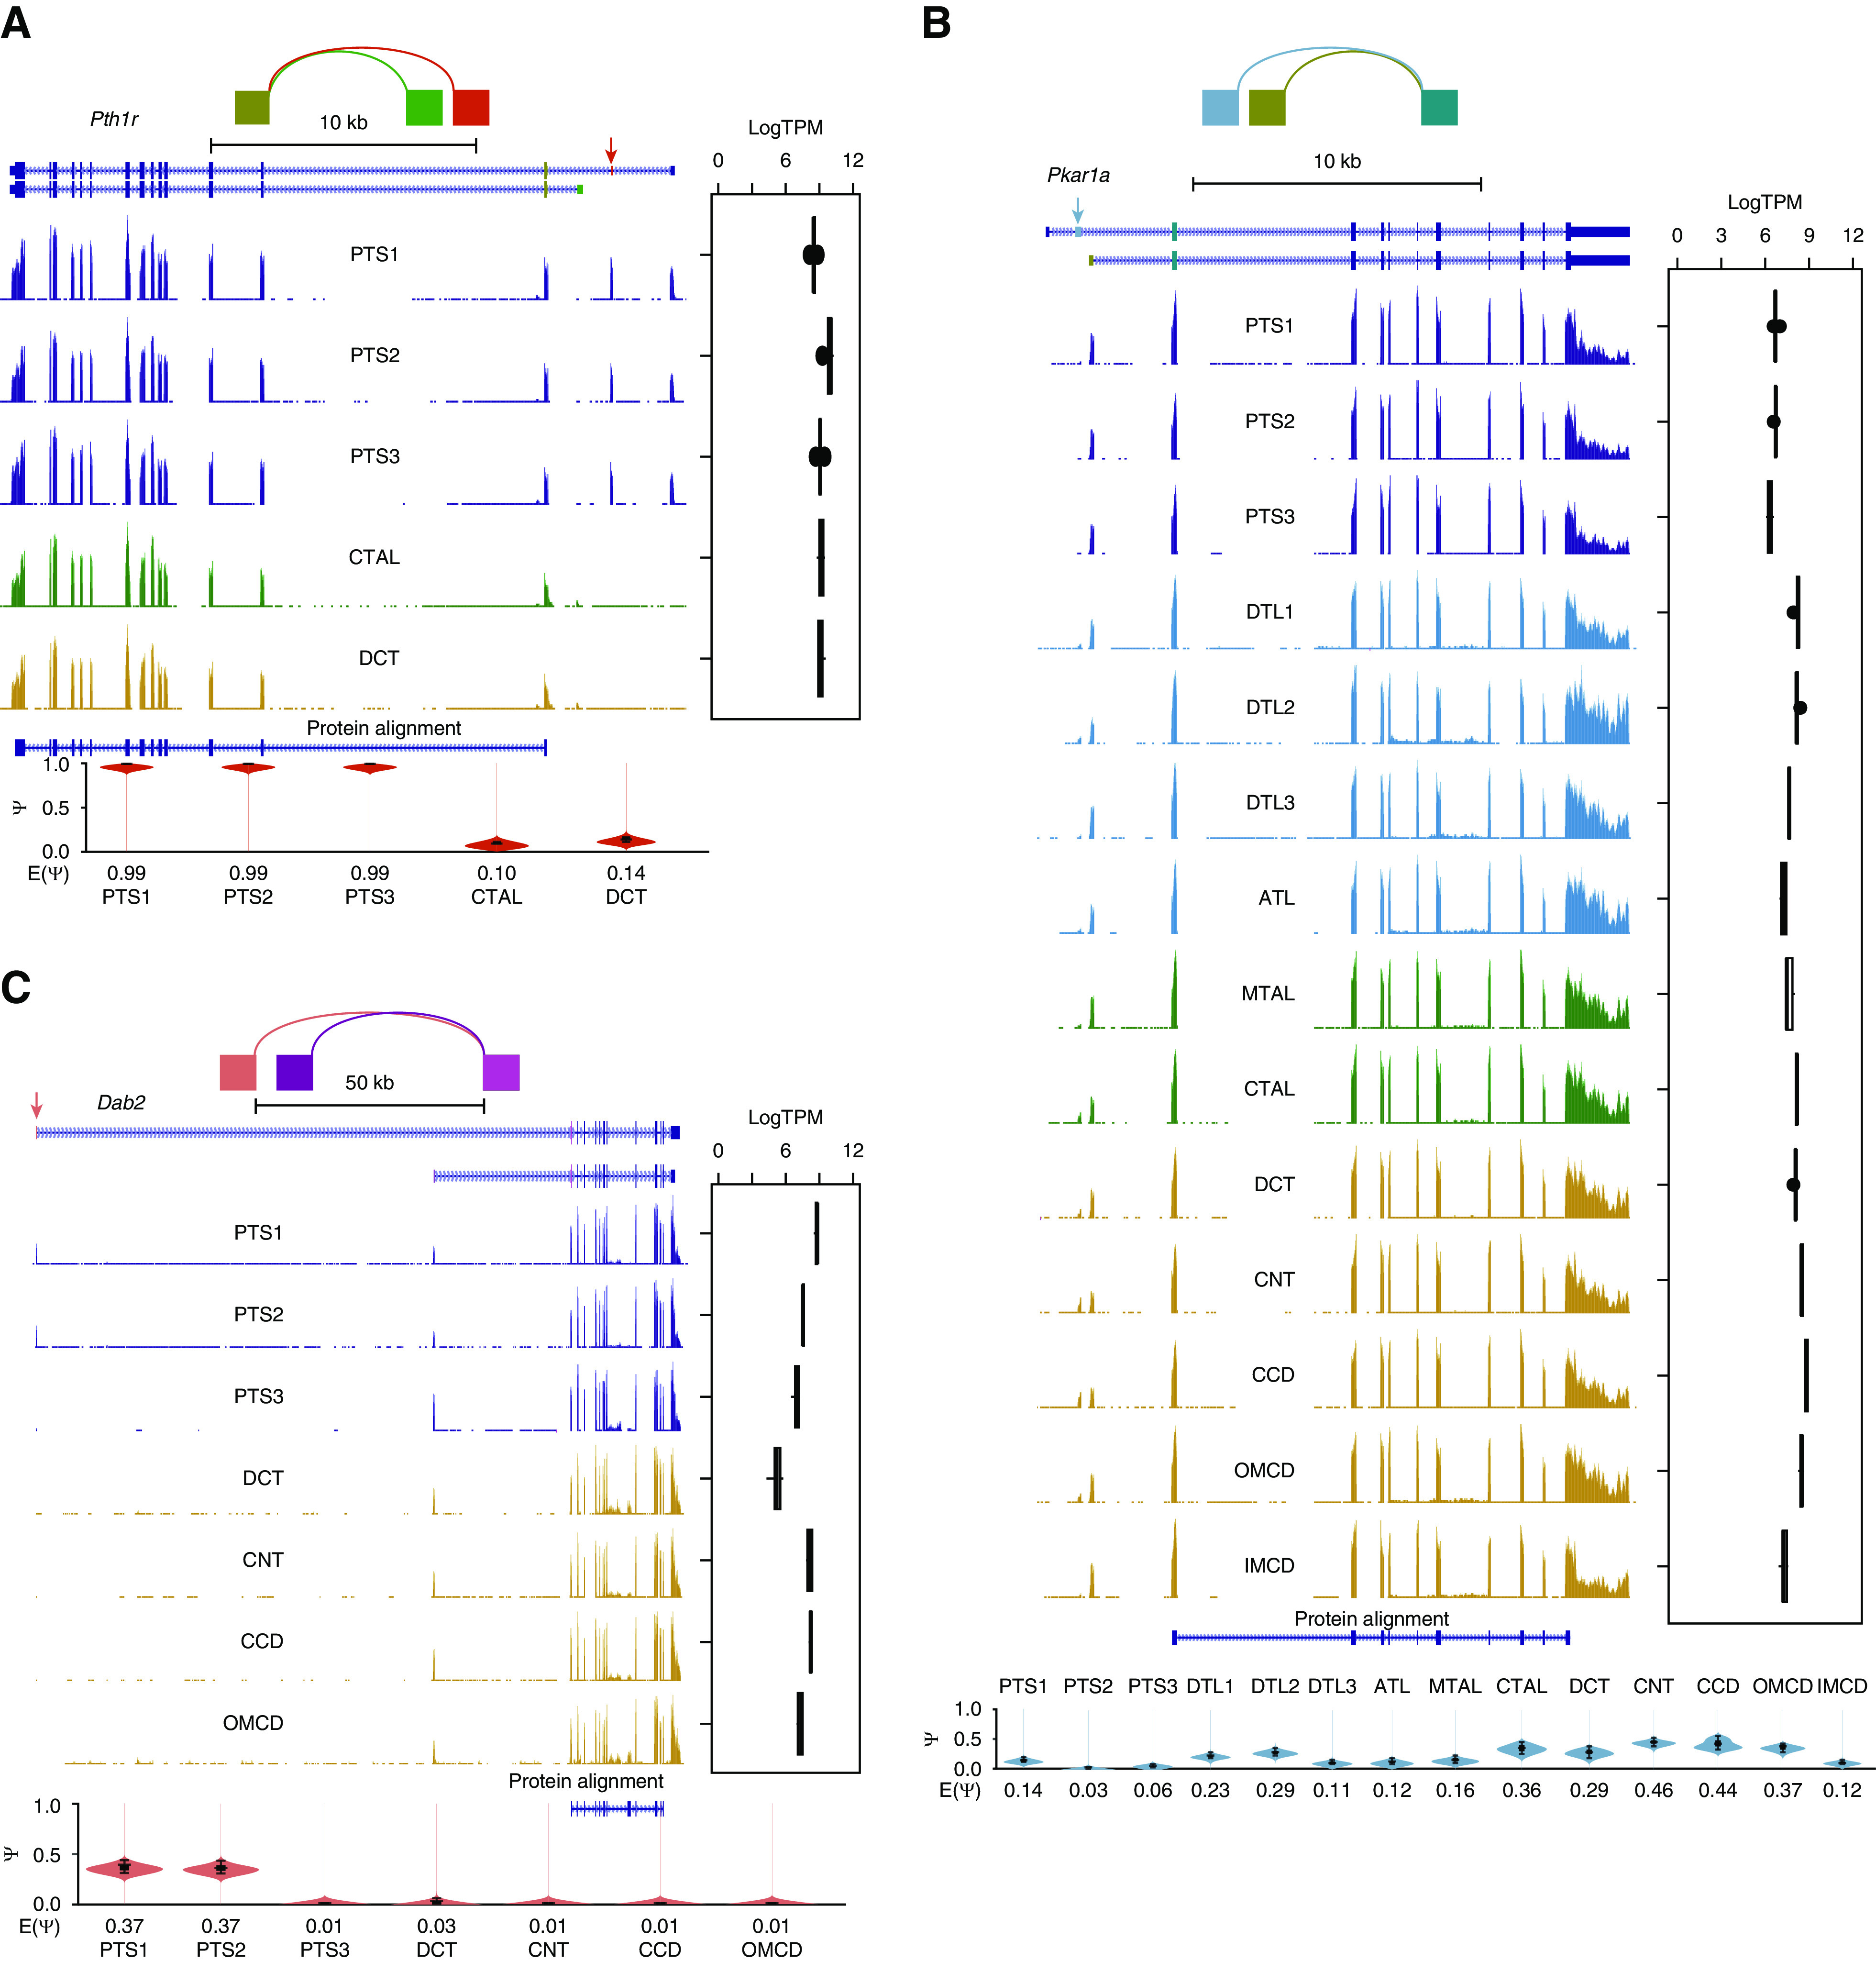
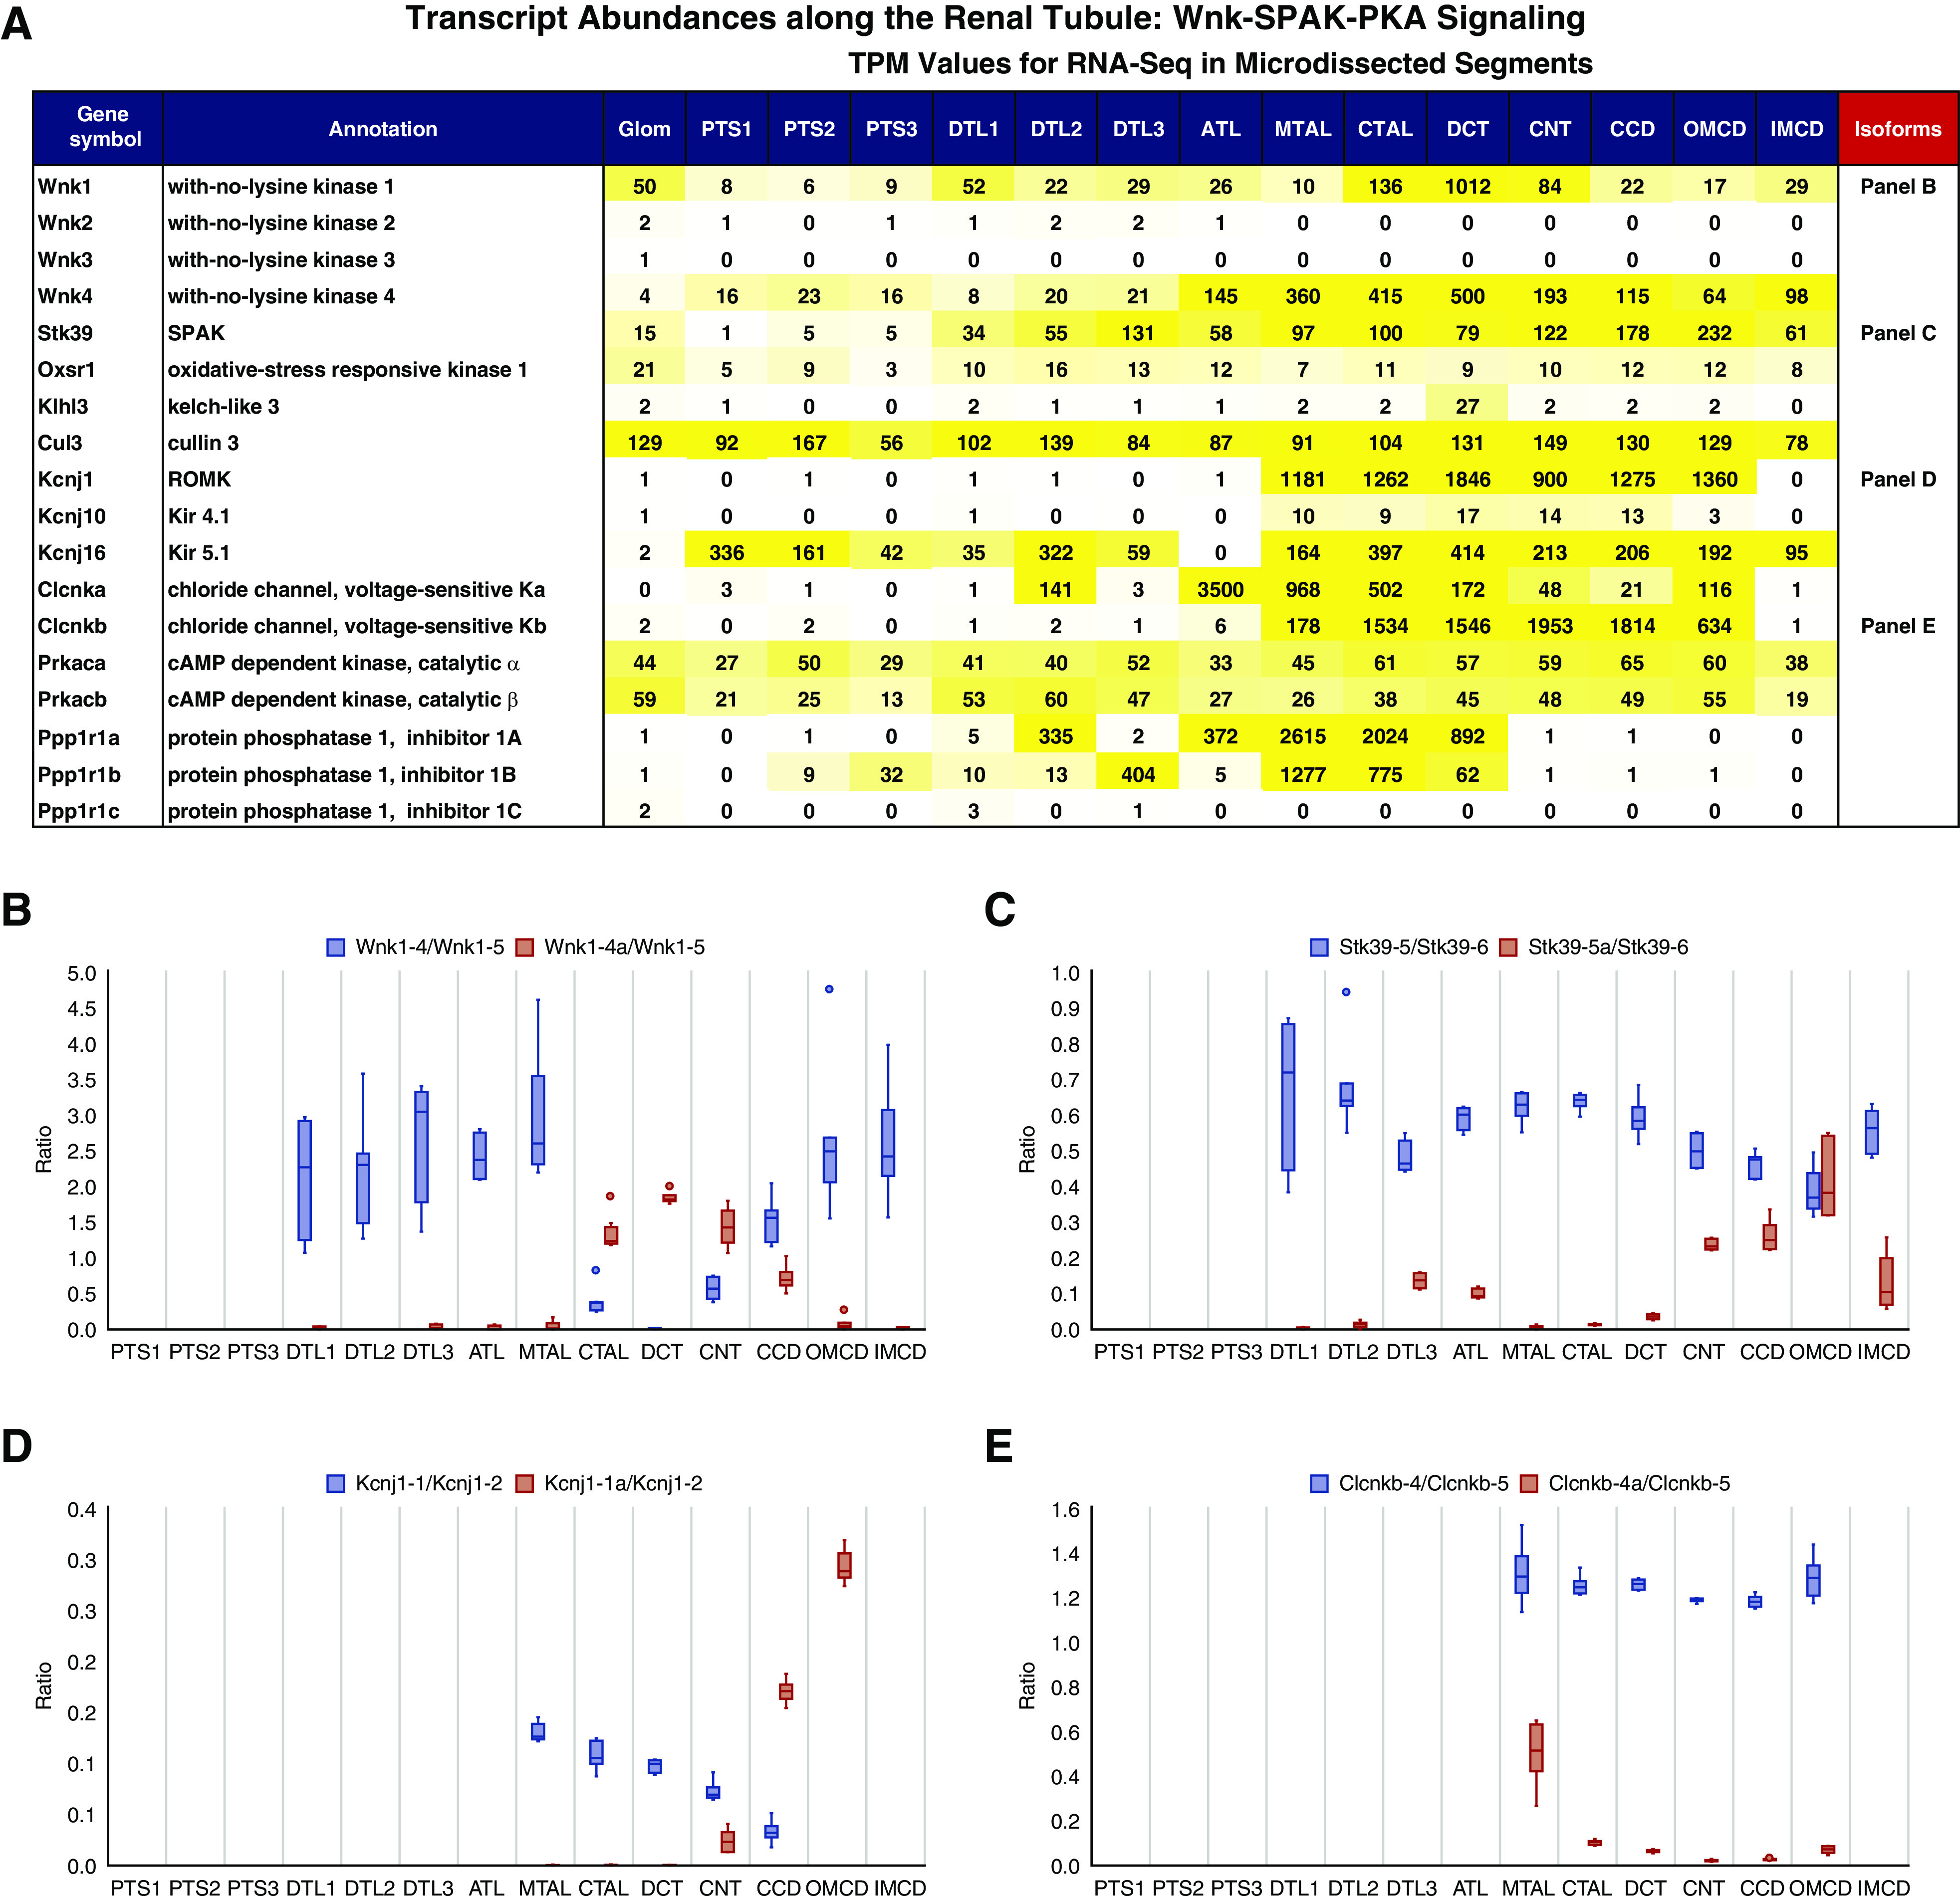
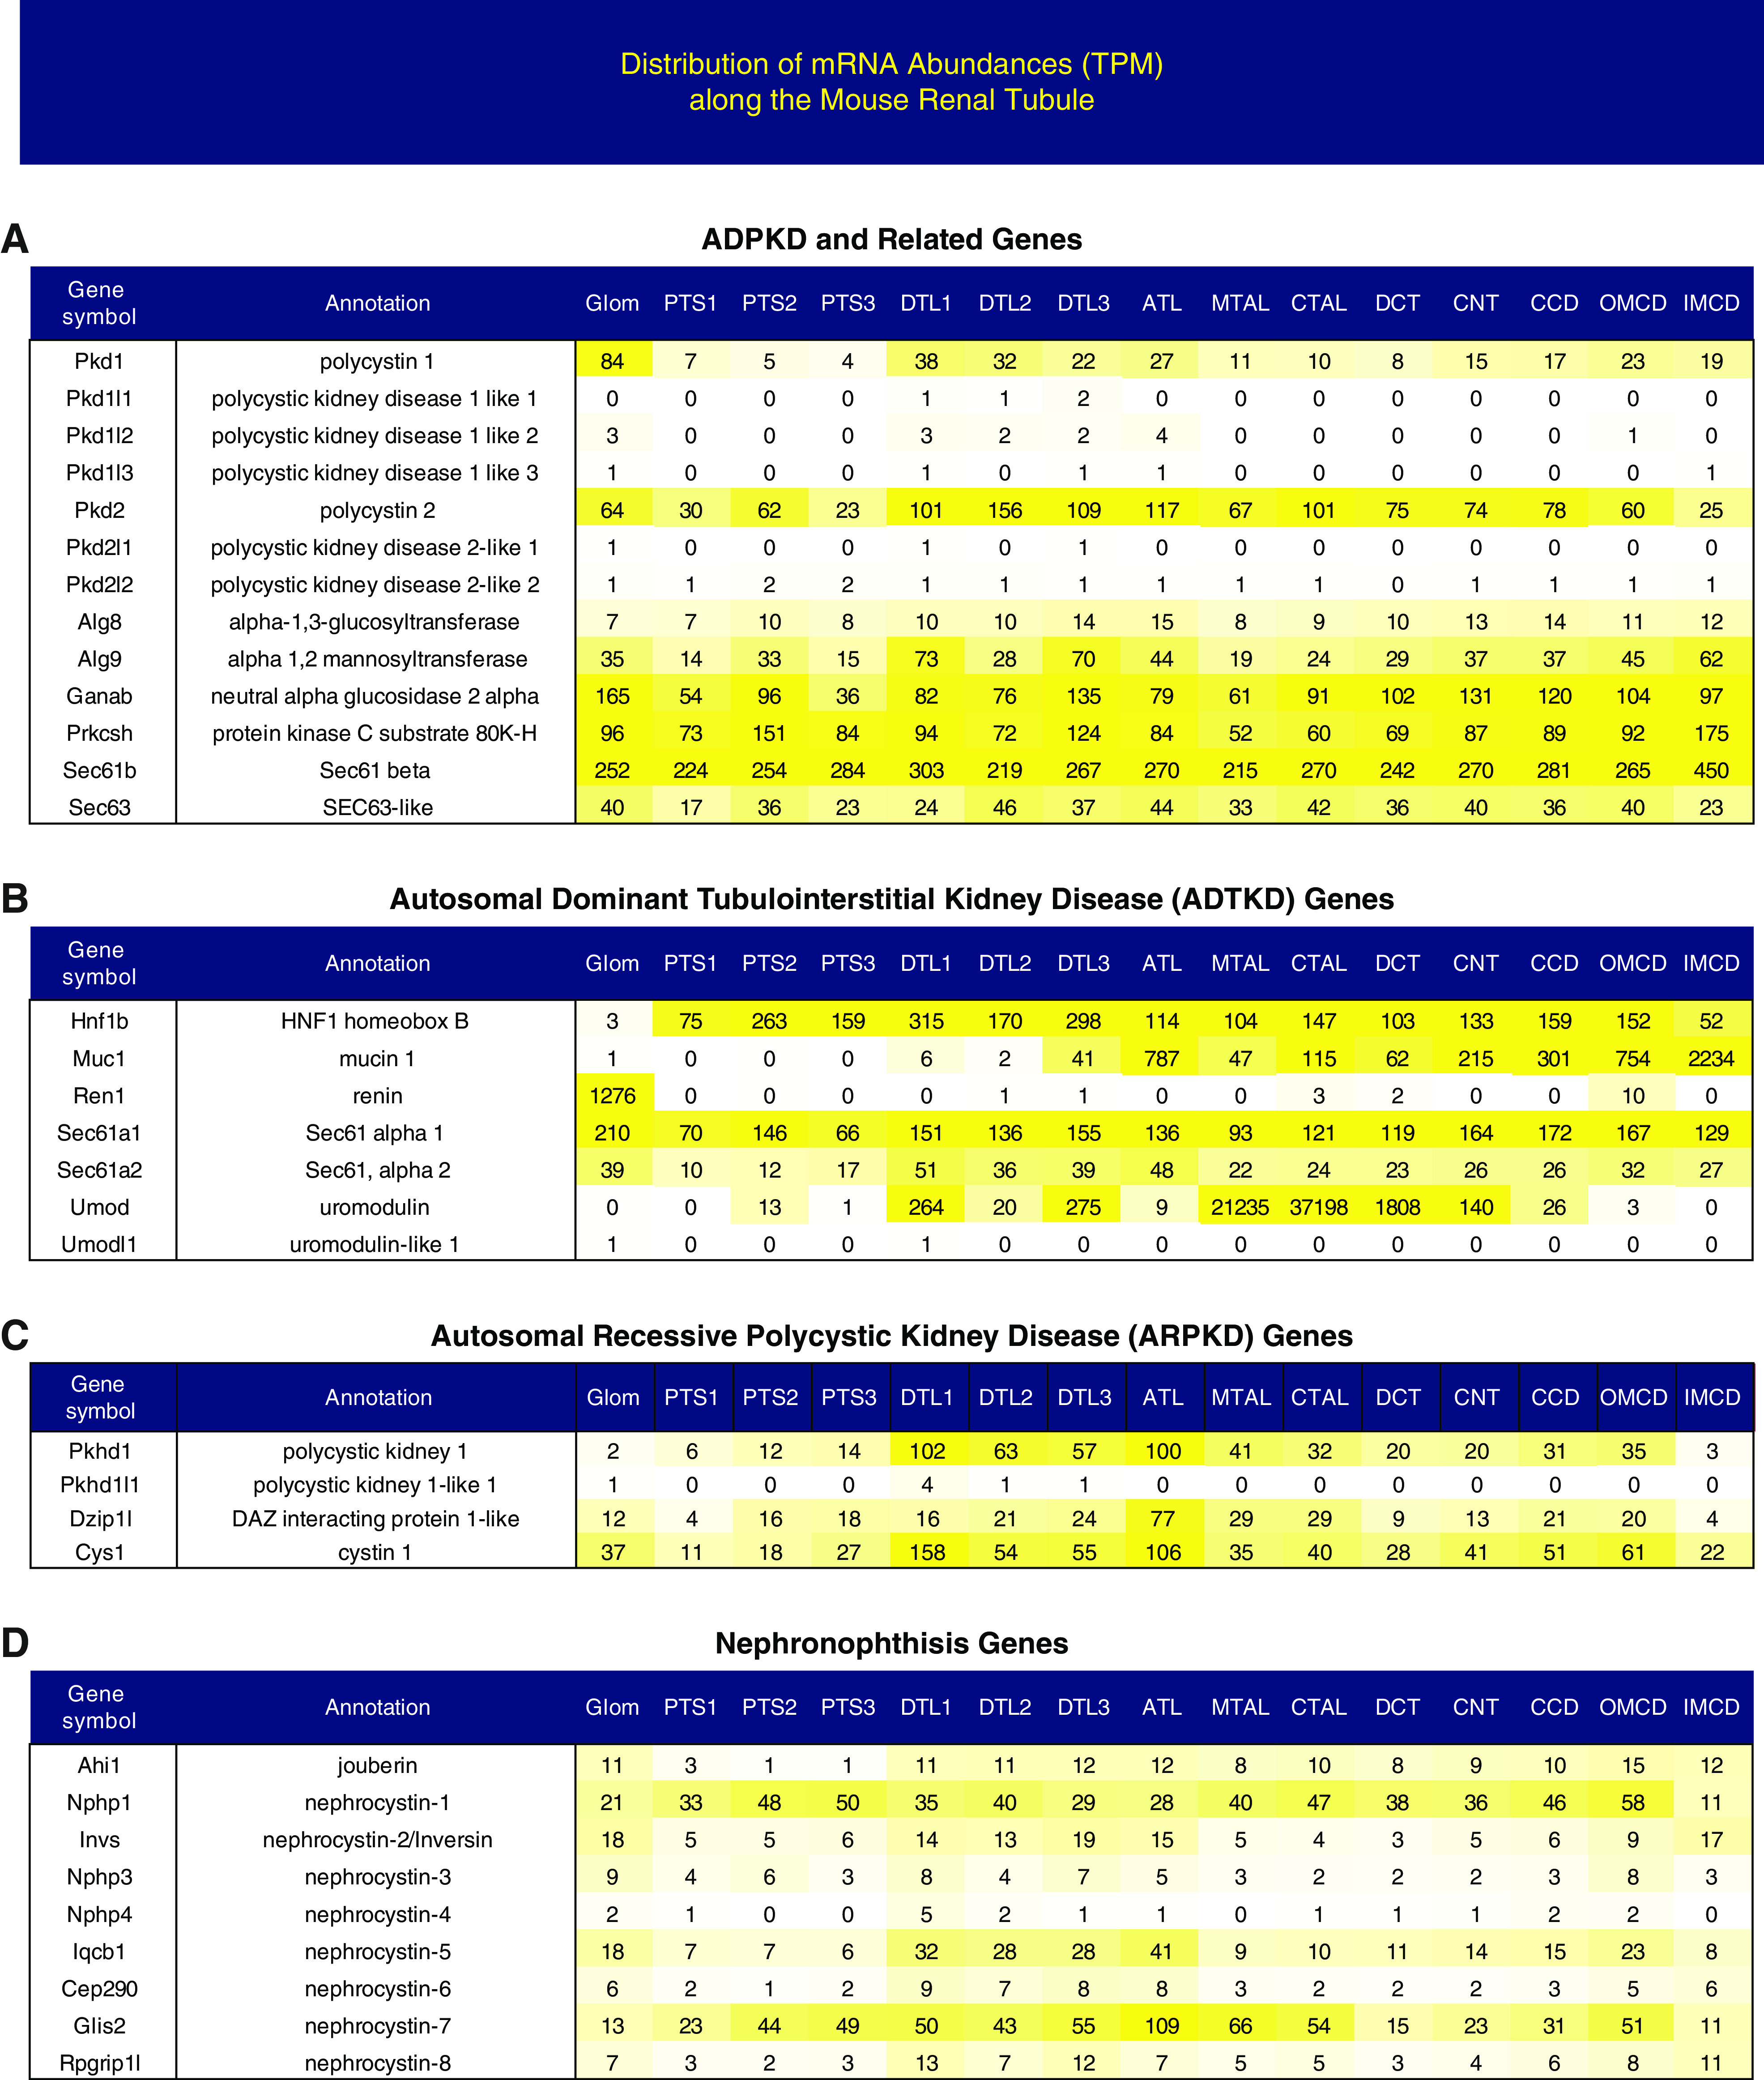
Results: This study identified >34,000 transcripts, including 3709 that were expressed in a segment-specific manner. All data are provided as an online resource (https://esbl.nhlbi.nih.gov/MRECA/Nephron/). Many of the genes expressed in unique patterns along the renal tubule were solute carriers, transcription factors, or G protein-coupled receptors that account for segment-specific function. Mapping the distribution of transcripts associated with Wnk-SPAK-PKA signaling, renin-angiotensin-aldosterone signaling, and cystic diseases of the kidney illustrated the applications of the online resource. The method allowed full-length mapping of RNA-seq reads, which facilitated comprehensive, unbiased characterization of alternative exon usage along the renal tubule, including known isoforms of Cldn10, Kcnj1 (ROMK), Slc12a1 (NKCC2), Wnk1, Stk39 (SPAK), and Slc14a2 (UT-A urea transporter). It also identified many novel isoforms with segment-specific distribution. These included variants associated with altered protein structure (Slc9a8, Khk, Tsc22d1, and Scoc), and variants that may affect untranslated, regulatory regions of transcripts (Pth1r, Pkar1a, and Dab2).

Conclusions: Full-length, unbiased sequencing of transcripts identified gene-expression patterns along the mouse renal tubule. The data, provided as an online resource, include both quantitative and qualitative differences in transcripts. Identification of alternative splicing along the renal tubule may prove critical to understanding renal physiology and pathophysiology.

Keywords: RNA-seq; alternative splicing; microdissection; renal tubule.


Figures

Figure 1.
Figure 1.
Overview of renal tubule cell nomenclature and experimental design. (A) The scheme, shows the connection of both a short-looped and a long-looped nephron to the CD system. Small-sample RNA-seq coupled with microdissection was used to quantify gene expression in all 14 mouse renal tubule segments. The data are provided in a user-friendly website. (B) Representative images of microdissected mouse renal tubule segments. The images were captured by the Invitrogen EVOS XL Core Cell Imaging System. Scale bars, 200 µm. G, glomerulus; PTS1, the initial segment of the proximal tubule; PTS2, proximal straight tubule in cortical medullary rays; PTS3, last segment of the proximal straight tubule in the outer stripe of outer medulla; DTL1, the short descending limb of the loop of Henle; DTL2, long descending limb of the loop of Henle in the outer medulla; DTL3, long descending limb of the loop of Henle in the inner medulla; ATL, thin ascending limb of the loop of Henle; MTAL, medullary thick ascending limb of the loop of Henle; CTAL, cortical thick ascending limb of the loop of Henle; MD, mecula densa; DCT, distal convoluted tubule; CNT, connecting tubule; CCD, cortical collecting duct; OMCD, outer medullary collecting duct; IMCD, inner medullary collecting duct.
Figure 2.
Figure 2.
Gene expression along renal tubule segments. (A) Heatmap showing the expression pattern of classic renal tubule markers. Columns are individual renal tubule replicates and rows are marker genes. Color bar (top) indicates different renal tubule segments. Red color indicates high expression, and blue color indicates low expression. Z-score was calculated from log2(TPM+1) using the scale function. (B) Three major renal tubule clusters were revealed in which the PTs were clustered together (red), segments from the MTAL through the OMCD formed a second group (blue), and thin limbs of the loop of Henle and IMCDs formed a third group (green). The polar dendrogram was built by hierarchic clustering analysis. Sample identifiers refer to both biologic and technical information. (C) Heatmap displaying the scaled expression pattern of 3709 DEGs along the renal tubule segment. The full gene list is provided in Supplemental Table 4.
Figure 3.
Figure 3.
Gene-expression patterns. (A) Dot plot displaying major non-PT solute carriers along the mouse nephron. See Supplemental Table 5 for PT-selective solute carriers. (B) Dot plot displaying important TFs. Several TFs were selectively expressed in DTLs. Examples include atonal TF (Atoh8) and UNC homeobox (Uncx) in DTL1; and nuclear receptor (Nr2e3) and paired-like homeodomain 2 (Pitx2) in DTL2–3. Several TFs were found in DCT, including Sall3 (a zinc-finger TF) and Emx1 (a homeobox TF). The mesenchyme homeobox 2 (Meox2) and T-Box TF 3 (Tbx3) were found to be highly expressed in IMCD. (C) G protein–coupled receptors (GPCRs) along the mouse nephron segments. The analysis also identified some GPCRs without well-characterized kidney functions, including the cholecystokinin A receptor (Cckar) in PT. In addition, serotonin receptor (Htr4) and thyroid-stimulating hormone receptor (Tshr) were selectively found in DTL1, PGE receptor 2 (Ptger2) was found in DTL3, and GPCR110 (Adgrf1) was found in IMCD. Dot size and color indicate expression (log2[TPM+1]). (D) Immunostaining coupled with RNAscope showing Ptger3 expression (green dots) in Slc12a1 cells (red) in mouse kidney sections. Scale bar, 20 µm.
Figure 4.
Figure 4.
Alternative splicing occurs within protein-coding regions. Distribution of (A) Slc9a8, (B) Khk, (C) Tsc22d1, and (D) Scoc isoforms along renal segments. Mapping is visualized in the UCSC Genome Browser. The structure of the gene is shown at the top of the track, with exons connected by blue rectangles, and introns indicated by thin lines with arrows. The splicing graph at the top of the panel was generated using MAJIQ-SPEL. The paths on the splicing graph indicate the splicing junctions. The same color codes were used for exons in the splice graph and UCSC Genes Track. Gene expression is shown on the right. Quantifications of relative abundance (PSI) of indicated exons are shown in violin plot at the bottom (sum of PSIs=1). PSI was calculated by MAJIQ and visualized by MAJIQ-SPEL. Track height scale, auto. The bottom protein alignment track is annotated on the basis of the UniProt/SwissProt database.
Figure 5.
Figure 5.
Alternative splicing occurs within nonprotein-coding regions. Distribution of (A) Pth1r, (B) Pkar1a, and (C) Dab2 isoforms along renal segments. Mapping is visualized in the UCSC Genome Browser. The structure of the gene is shown at the top of the track, with exons connected by blue rectangles and introns indicated by thin lines with arrows. The splicing graph at the top of the panel was generated using MAJIQ-SPEL. The paths on the splicing graph indicate the splicing junctions. The same color codes were used for exons in the splice graph and UCSC Genes Track. Gene expression is shown on the right. Quantifications of relative abundance (PSI) of indicated exons are shown in violin plot at the bottom (sum of PSIs=1). PSI was calculated by MAJIQ and visualized by MAJIQ-SPEL. Track height scale, auto. The bottom protein alignment track is annotated on the basis of the UniProt/SwissProt database.
Figure 6.
Figure 6.
Distributions of transcripts associated with Wnk-SPAK-PKA signaling. (A) Transcript abundance (TPM) of major Wnk signaling components along the renal tubule. The yellow color indicates expression levels. Quantification of exon-inclusion level (ratio) for (B) Wnk1, (C) SPAK, (D) Kcnj1, and (E) Clcnkb. Gene symbols are followed by exon numbers. The ratio was calculated on the basis of the relative abundance of spliced exons (blue) over reference exons (orange). Read counts were calculated using featureCounts (see Method).
Figure 7.
Figure 7.
Distributions of transcripts associated with renin-angiotensin-aldosterone signaling. Transcript abundance (TPM) of major renin-angiotensin-aldosterone signaling components along the renal segments. The yellow color indicates expression levels. The scRNA-seq data are from Chen et al.
Figure 8.
Figure 8.
Distributions of transcripts associated with genetic cystic kidney diseases. Transcript abundance (TPM) of genetically caused cystic kidney disease transcripts along the renal segments. The yellow color indicates expression levels. ADPKD, autosomal dominant polycystic kidney disease.

Comment in

  • Me Or Your Own Eyes: RNA-Seq and the Kidney.
    Ellison DH. Ellison DH. J Am Soc Nephrol. 2021 Apr;32(4):768-771. doi: 10.1681/ASN.2021010017. Epub 2021 Mar 4. J Am Soc Nephrol. 2021. PMID: 33769950 Free PMC article. No abstract available.

References

    1. ENCODE Project Consortium: An integrated encyclopedia of DNA elements in the human genome. Nature 489: 57–74, 2012 - PMC - PubMed
    1. Wang ET, Sandberg R, Luo S, Khrebtukova I, Zhang L, Mayr C, et al. .: Alternative isoform regulation in human tissue transcriptomes. Nature 456: 470–476, 2008 - PMC - PubMed
    1. Lee JW, Chou CL, Knepper MA: Deep sequencing in microdissected renal tubules identifies nephron segment-specific transcriptomes. J Am Soc Nephrol 26: 2669–2677, 2015 - PMC - PubMed
    1. Zhang X, Li T, Liu F, Chen Y, Yao J, Li Z, et al. .: Comparative analysis of droplet-based ultra-high-throughput single-cell RNA-seq systems. Mol Cell 73: 130–142.e5, 2019 - PubMed
    1. Chen L, Lee JW, Chou CL, Nair AV, Battistone MA, Păunescu TG, et al. .: Transcriptomes of major renal collecting duct cell types in mouse identified by single-cell RNA-seq. Proc Natl Acad Sci U S A 114: E9989–E9998, 2017 - PMC - PubMed