. 2021 Apr 13;16(4):771-783.
doi: 10.1016/j.stemcr.2021.03.001. Epub 2021 Mar 25.

One-step Reprogramming of Human Fibroblasts into Oligodendrocyte-like Cells by SOX10, OLIG2, and NKX6.2

Affiliations

One-step Reprogramming of Human Fibroblasts into Oligodendrocyte-like Cells by SOX10, OLIG2, and NKX6.2

Konstantina Chanoumidou et al. Stem Cell Reports. .

Abstract

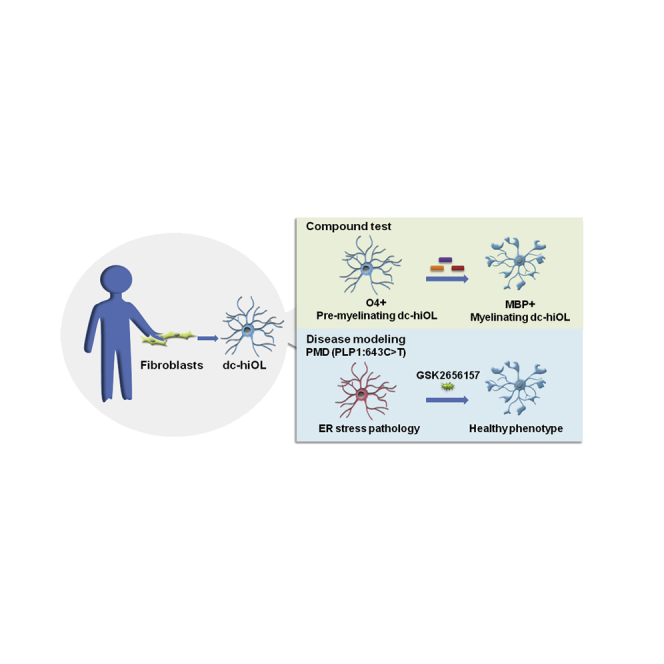
Limited access to human oligodendrocytes impairs better understanding of oligodendrocyte pathology in myelin diseases. Here, we describe a method to robustly convert human fibroblasts directly into oligodendrocyte-like cells (dc-hiOLs), which allows evaluation of remyelination-promoting compounds and disease modeling. Ectopic expression of SOX10, OLIG2, and NKX6.2 in human fibroblasts results in rapid generation of O4+ cells, which further differentiate into MBP+ mature oligodendrocyte-like cells within 16 days. dc-hiOLs undergo chromatin remodeling to express oligodendrocyte markers, ensheath axons, and nanofibers in vitro, respond to promyelination compound treatment, and recapitulate in vitro oligodendroglial pathologies associated with Pelizaeus-Merzbacher leukodystrophy related to PLP1 mutations. Furthermore, DNA methylome analysis provides evidence that the CpG methylation pattern significantly differs between dc-hiOLs derived from fibroblasts of young and old donors, indicating the maintenance of the source cells' "age." In summary, dc-hiOLs represent a reproducible technology that could contribute to personalized medicine in the field of myelin diseases.

Keywords: ATAC-seq; PMD; compound screenin; direct conversion; epigenetic age; human fibroblasts; oligodendrocytes.


Figures

None
Graphical abstract
Figure 1
Figure 1
Characterization of dc-hiOLs (A) Schematic representation of dc-hiOL generation. Fibroblasts are infected with SON lentivirus at day −1 in fibroblast medium (FM). Cells are cultured in glia induction medium (GIM) from day 0 to day 9, after which the medium is switched to glia differentiation medium (GDM) to promote terminal differentiation of oligodendrocyte-like cells. (B) Quantification of O4+ cells using flow-cytometry analysis at different time points during the transdifferentiation process for three fetal/neonatal fibroblast cell lines (Fib A, Fib B, and Fib C). Data are shown as the mean ± SEM of n = 4 different transdifferentiation experiments for each cell line. (C) Comparison of donor cell age effect on transdifferentiation efficiency. Quantification of O4+ cells by fluorescence-activated cell-sorting analysis at day 16. Data are presented as mean of n = 3 different cell lines for fibroblasts from neonatal (newborn to 5 months of age), adult (25–32 years of age), and older (66–71 years of age) donors. (D) Immunostaining of dc-hiOLs for O4 (red)/Ki67 (green) and O4 (red)/MBP (green) at days 12 and 16 post infection. Scale bar, 50 μm. (E) Quantification of Ki67+ over O4+ cells at days 12 and 16 of transdifferentiation. Data are presented as the mean + SEM of n = 4 different transdifferentiation experiments of one cell line. Unpaired Student's t test was performed for statistical analysis. (F) Quantification of MBP+ over O4+ cells at days 12 and 16. Data are presented as the mean + SEM of n = 4 different transdifferentiation experiments of one cell line. Unpaired Student's t test was performed for statistical analysis. (G) Migration assay using live cell imaging. Graph showing the velocity of purified O4+ cells at days 12 and 14 of direct conversion. Data are presented as the mean + SEM of n = 3 different transdifferentiation experiments of one cell line. Unpaired Student's t test was performed for statistical analysis. (H) Immunostaining of purified O4+ dc-hiOLs for GalC, CNPase, MBP, and PLP1 (green) at day 16. Scale bar, 50 μm. (I) Low- and high-magnification confocal images of dc-hiOLs cultured on nanofibers. O4+ cells were purified at day 11 and cultured on FITC-labeled nanofibers for 10 days. Immunostaining of dc-hiOLs for MBP (magenta) shows the alignment of oligodendrocyte processes along the nanofibers (green). Scale bar, 100 μm. (J) Quantification of MBP+ dc-hiOLs aligned to nanofibers generated from three different cell lines. Three inserts were counted per cell line. (K) Three-dimensional reconstruction of confocal image of dc-hiOLs stained for MBP (magenta) on FITC-labeled nanofibers illustrates the ensheathment of nanofibers by dc-hiOLs. The clipped view on the rendered surfaces enables one to follow individual nanofibers covered by dc-hiOLs (arrows). Scale bar, 5 μm. (L) Confocal image of dc-hiOLs co-cultured with iPSC-derived neurons for 6 days. The image illustrates the colocalization of MBP+ (magenta) oligodendrocyte process with neuronal process visualized by TUJ1 (green). Scale bar, 25 μm. p < 0.05, ∗∗∗p < 0.001. See also Figures S1 and S2.
Figure 2
Figure 2
SON Induce Chromatin Remodeling to Activate the Expression of Oligodendrocyte Genes (A) Global transcriptome comparison using RNA-seq. MA plot comparing gene expression values between dc-hiOLs and fibroblasts. Differentially expressed genes accounting for donor heterogeneity with FDR < 0.01 are color coded. Light-blue dots, dc-hiOL-upregulated genes (1,410); light-green dots, fibroblast-upregulated genes (1,418); dark-blue dots, representative oligodendrocyte marker genes; dark-green dots, representative fibroblast marker genes. (B) Normalized gene expression values of typical oligodendrocyte progenitor cell (OPC), oligodendrocyte (OL), neuronal, astrocyte, microglia, and fibroblast genes in comparison with single-nuclei RNA-seq data from Jäkel et al. (2019). Fibroblasts (FibA–FibC), induced oligodendrocyte-like cells (dc-hiOLA–dc-hiOLC), and primary human oligodendrocytes (pOl1–pOL3) indicate samples of the present studies. Data from Jäkel et al. (2019) include different subclusters of neurons (Neuron1–Neuron5) and oligodendrocytes (Oligo1–Oligo6), and additional clusters of OPCs, committed OL precursors (COPs), immune oligodendroglia (imOLG), astrocytes (Astrocytes), pericytes (Pericytes), and immune cells (Macrophages and Microglia_Macrophages). Unsupervised hierarchical clustering shows that dc-hiOL1–3 cluster with the other oligodendroglial clusters, whereas fibroblasts (Fib1–Fib3) form a separate cluster. Unexpectedly, in the dataset published by Jäkel et al. (2019), MBP was expressed in comparable levels in oligodendrocytes and astrocytes. This finding might be an RNA-seq artifact. (C) Global chromatin accessibility comparison using ATAC-seq. MA plot comparing accessibility at ATAC-seq peaks between dc-hiOLs and fibroblasts. Blue dots, peaks preferentially accessible in dc-hiOLs (18,052); light-green dots, fibroblast-accessible peaks (4,075). (D) Example of oligodendroglial markers genes upregulated upon SON overexpression. Upper half: normalized RNA-seq coverage across donors (reads per kilobase per million [RPKM]). Lower half: normalized ATAC-seq accessible fraction coverage across donors (RPKM). Blue tracks, dc-hiOL signal; green tracks, fibroblast signal. Coordinates: 'chr19:35,289,212-35,305,038' (MAG), 'chr6:29,642,061-29,674,746' (MOG), 'chr18:76,970,725-77,144,324' (MBP), 'chrX:103,772,927-103,797,741' (PLP1). (E) Ranked TF motif enrichment within top ATAC-seq peaks as assessed by HOMER (Heinz et al., 2010). Motifs with FDR < 0.05 are color coded. Circle color denotes TF family and circle size the percentage of peaks containing the motif. Inset trees quantify the similarity between obtained motifs (hierarchical clustering using Euclidean distance; bar indicates Euclidean distance of 1). Similar motifs (Pearson correlation coefficient >0.75) were merged into ensemble motifs. Original motifs are presented in Figure S3H. (F) Top three non-redundant enriched motifs at dc-hiOL accessible peaks. See also Figure S3.
Figure 3
Figure 3
dc-hiOLs Respond to Promyelination Compound Treatment (A) Schematic representation of the promyelination drug test on dc-hiOLs. Cells were treated with DMSO, T3, benztropine (1 μM), clemastine (1 μM), or miconazole (1 μM) from day 5 to day 16 of transdifferentiation. (B) ICC for MBP (green) and O4 (red) at day 16. Scale bar: 50 μm. (C and D) Quantification of O4+/DAPI (C) and MBP+/O4+ (D) cells at day 16. Counting of positive cells was performed manually by analyzing ten fields captured randomly using 20× magnification for each condition in all tested cell lines. Data are shown as the mean + SEM of four different cell lines (n = 4). Significance was determined by two-tailed unpaired t test. p < 0.05, ∗∗p < 0.01.
Figure 4
Figure 4
dc-hiOLs Derived from PMD Patients Recapitulate Disease-Related Pathologies Characterization of dc-hiOLs derived from PMD patients. dc-hiOLs derived from one PMD patient with a point mutation (PLP1 643C>T) and three PMD patients with PLP1 duplication (PLP1 dupl.) were compared with sex- and aged-matched healthy controls, respectively. (A and B) Representative immunofluorescence images of O4+ (red), MBP+ (green), and PLP1+ (green) dc-hiOLs at day 16 of transdifferentiation. Scale bars, 50 μm. (C–H) Comparison of dc-hiOLs derived from one PMD patient with point mutation PLP1 643C>T with one control cell line. Percentage of O4+ (C) and MBP+ (D) cells at day 16. Data are shown as the mean + SEM of n = 3 different transdifferentiation experiments of one cell line for each group. Two-tailed unpaired t test was used for statistical analysis. (E) Representative plot profiles comparing the distribution of PLP1 in control (black) and PLP1 643C>T (green) dc-hiOLs. Two-dimensional graph of pixel intensity along cell diameter. (F) Apoptosis assay for PLP1 643C>T dc-hiOLs. MR-(DEVD)2 reagent is cleaved by active caspase-3/7 and produces a fluorescent product (magenta). ICC for O4+ (green) after apoptotic cell labeling at day 13. Scale bar, 75 μm. (G) Percentage of O4+ dc-hiOLs with active caspase-3/7 at differentiation day 13. Cells were treated with DMSO vehicle (Control, PLP1 643C>T) or 1 μM GSK2656157 (PLP1 643C>T + GSK2656157) from differentiation day 5 onward to test for phenotype rescue. Data are shown as the mean + SEM of n = 3 transdifferentiation experiments. Two-tailed unpaired t test was used for statistical analysis. (H) Quantification of MBP+ cells at day 16. PLP1 643C>T dc-hiOLs were treated with either vehicle (DMSO) or 1 μM GSK2656157 from differentiation day 5 onward. Data are presented as the mean + SEM of n = 3 different transdifferentiation experiments. Unpaired Student's t test was used for statistical analysis. p < 0.05, ∗∗p < 0.01. See also Figure S4.
Figure 5
Figure 5
Epigenetic Characterization of Fibroblast and dc-hiOL Samples (A) Focused analysis of methylation β values of CpG sites mapping to MBP, MAG, and MOG genes showing that only MBP is differentially methylated on the global gene level between dciOL and fibroblast samples (p < 0.01, Wilcoxon’s test). (B) Unsupervised analysis of differentially methylated regions between dciOL and fibroblast samples revealed a region of 17 CpG sites mapping to exon 1 (hg19 coordinates: chr18:74,728,834-74,729,551) of MBP transcripts typically expressed in the brain being hypomethylated in dc-hiOL samples as compared with fibroblast samples (HMM-Fisher, p = 1 × 10−19). (C) Heatmap showing methylation β values of the top 1,000 differentially methylated probes between aged samples and neonatal samples. Note the shared aging signature between fibroblast and dc-hiOL samples across neonatal and aged samples. (D) Unsupervised t-distributed stochastic neighbor embedding (t-SNE) analysis of all dc-hiOL samples showing that aged and old samples group together and are clearly separated from neonatal samples. See also Figure S5.

References

    1. Cailloux F., Gauthier-Barichard F., Mimault C., Isabelle V., Courtois V., Giraud G., Dastugue B., Boespflug-Tanguy O. Genotype-phenotype correlation in inherited brain myelination defects due to proteolipid protein gene mutations. Clinical European Network on Brain Dysmyelinating Disease. Eur. J. Hum. Genet. 2000;8:837–845. - PubMed
    1. Deshmukh V.A., Tardif V., Lyssiotis C.A., Green C.C., Kerman B., Kim H.J., Padmanabhan K., Swoboda J.G., Ahmad I., Kondo T. A regenerative approach to the treatment of multiple sclerosis. Nature. 2013;502:327–332. - PMC - PubMed
    1. Douvaras P., Fossati V. Generation and isolation of oligodendrocyte progenitor cells from human pluripotent stem cells. Nat. Protoc. 2015;10:1143–1154. - PubMed
    1. Ehrlich M., Mozafari S., Glatza M., Starost L., Velychko S., Hallmann A.L., Cui Q.L., Schambach A., Kim K.P., Bachelin C. Rapid and efficient generation of oligodendrocytes from human induced pluripotent stem cells using transcription factors. Proc. Natl. Acad. Sci. U S A. 2017;114:E2243–E2252. - PMC - PubMed
    1. Fraga M.F., Esteller M. Epigenetics and aging: the targets and the marks. Trends Genet. 2007;23:413–418. - PubMed

Publication types

MeSH terms