. 2021 Dec 2;29(12):1339-1356.e7.
doi: 10.1016/j.str.2021.03.002. Epub 2021 Mar 25.

NaV1.2 EFL domain allosterically enhances Ca2+ binding to sites I and II of WT and pathogenic calmodulin mutants bound to the channel CTD

Affiliations

NaV1.2 EFL domain allosterically enhances Ca2+ binding to sites I and II of WT and pathogenic calmodulin mutants bound to the channel CTD

Ryan Mahling et al. Structure. .

Abstract

Neuronal voltage-gated sodium channel NaV1.2 C-terminal domain (CTD) binds calmodulin (CaM) constitutively at its IQ motif. A solution structure (6BUT) and other NMR evidence showed that the CaM N domain (CaMN) is structurally independent of the C-domain (CaMC) whether CaM is bound to the NaV1.2IQp (1,901-1,927) or NaV1.2CTD (1,777-1,937) with or without calcium. However, in the CaM + NaV1.2CTD complex, the Ca2+ affinity of CaMN was more favorable than in free CaM, while Ca2+ affinity for CaMC was weaker than in the CaM + NaV1.2IQp complex. The CTD EF-like (EFL) domain allosterically widened the energetic gap between CaM domains. Cardiomyopathy-associated CaM mutants (N53I(N54I), D95V(D96V), A102V(A103V), E104A(E105A), D129G(D130G), and F141L(F142L)) all bound the NaV1.2 IQ motif favorably under resting (apo) conditions and bound calcium normally at CaMN sites. However, only N53I and A102V bound calcium at CaMC sites at [Ca2+] < 100 μM. Thus, they are expected to respond like wild-type CaM to Ca2+ spikes in excitable cells.

Keywords: FRET; NMR; affinity; allostery; binding; biosensor; free energy; linkage; molecular recognition; titration; voltage-gated sodium channel.


Conflict of interest statement

Declaration of interests The authors declare no competing interests.

Figures

Figure 1.
Figure 1.. Architecture of Na V1.2 and CaM
(A) Transmembrane structure of human NaV1.2 α-subunit (6J8E, pale green). DIII–DIV linker (orange) includes inactivation gate connecting helix 6 (pink) of DIII pore-forming domain to voltage-sensing domain of DIV (gray). Schematics show unresolved NaV1.2 N-(NTD, cyan) and C-terminal domains (CTD, green) containing EFL and IQ motif, and CaM (CaMN, blue, CaMC, red) bound at IQ motif. Pore-forming DIV (black) connects to the CTD. (B) Vacuum electrostatics surface (positive, blue; negative, red; neutral, white) of human NaV1.2CTD (1,777–1,937, 4JPZ/cylinders). (C) Human NaV1.2IQp (1,901–1,927) aligned with canonical IQ motif sequence over α-helix showing positions of I, cyan; Q, green; B (R,K/blue); and fJ, orange (ball and stick) and vacuum electrostatics surface (colors match B). (D) Apo CaM (25 models, 1CFC, aligned by aa 82–142). (E and F) Apo (2KXW) and (Ca2+)2-PCaMC (2M5E) bound to rat NaV1.2IQp, aligned by NaV1.2 1,904 (blue) to 1,924 (red); I1912, cyan, and Q1913, green, are spheres. “N” (blue sphere) at residue 76 would connect CaMN; helices F (red) and G (orange) show rotation of (Ca2+)2-CaMC on NaV1.2IQp. (G) Putative CaMBD in human NaV1.2 NTD (NTBAA). F, orange, and I, cyan (ball and stick) on ideal α helix (cyan). WebLogo (Crooks et al., 2004) of NTBAA sequence in nine human NaV isoforms. (H) Vacuum electrostatics surface of NaV1.2 NTBAA (colors match B). (I) Steady-state emission spectra of NaV1.2 NTBAA biosensor (5 nM) alone (solid black), with 10 μM apo (dashed red) or (Ca2+)4-CaM (solid blue). Inset: NaV1.2 NTBAA schematic.
Figure 2.
Figure 2.. Solution structure of apo CaM bound to Na V1.2IQp
(A and B) 15N-HSQC overlay of free apo CaMN (1–75), blue, (A) or apo CaMC (76–148/red), (B) on apo CaM + NaV1.2IQp (black). (C) Apo CaM + NaV1.2IQp ensemble (20 models, 6BUT) aligned by CaM 82–142. (D) Apo CaM (putty diameter proportional to CSP) bound to NaV1.2IQp (cylinder). (E) Backbone alignment of 6BUT subsets: CaM 1–75 aligned by 6–75; CaM 76–148 and NaV1.2IQp, aligned by CaM 82–142. (F and G) Ensemble of interfacial (F) NaV1.2IQp residues I1912, Q1913, Y1916, Y1919 (sticks), and (G) aliphatic CaMC residues (sticks) contacting them. (H) CaM residues ≤6 Å from NaV1.2IQp 1,904–1,923 (≤4.5 Å red). NaV1.2 I1912, cyan; Q1913, green; Y1916/Y1919, orange. (I) CaM atoms (small red spheres) %4.5 Å of NaV1.2 I1912, cyan; Q1913, green; Y1916, orange; and Y1919, orange (spheres at van der Waals radius), Cα (green). (J) I1912, cyan; Q1913, green; Y1916, orange; and Y1919, orange of NaV1.2IQp (ball and stick) relative to CaMC CSP. See Figures S1–S5.
Figure 3.
Figure 3.. Mutational analysis of CaM-Na V1.2 IQ motif interface
(A) Equilibrium titrations of WT NaV1.2 IQ biosensor with apo (◇/dashed) or (Ca2+)4-CaM (◆/solid). (B) Cleft of apo CaMC + NaV1.2IQp (6BUT), I1912, cyan; Q1913, green; R1914, marine, Y1916, salmon; R1917, firebrick; and Y1919, wheat (ball and stick). CaMC surface: orange atoms ≤4.5 Å of NaV1.2IQp. (C) Ensemble of R1914, blue, and R1917, red (sticks), positions in 6BUT. WebLogo compares NaV1.2 1,906–1,922 in 53 eukaryotes. (D–L) CaM binding to mutant NaV1.2 IQ biosensors. Reference titrations (gray) of apo (dashed) and (Ca2+)4-CaM (solid) from (A). Apo (◇/dashed) or (Ca2+)4-CaM (◆/solid) binding to (D and G) I1912A, cyan; Q1913A, green; and IQ/AA, magenta; (E and H) Y1916A, pink; Y1919A, gold; or YY/AA, orange; (F and I) R1914A, blue; R1917A, orange; or RR/AA, violet; (J) R1902C, gold; (K) I1911V, pink; and (L) Q1913R, blue (blue arrow shows difference in apo versus (Ca2+)4-CaM titration curve midpoints). (D–I) Square brackets show difference in titration curve midpoints. (M) CaMC (6BUT, gray). CaMN connects at aa 76 (blue sphere). NaV1.2IQp 1,902–1,924 (yellow to orange, thin helix). Sidechains R1902, gold; I1911, magenta; I1912, cyan; Q1913, green; R1914, marine; Y1916, salmon; R1917, firebrick; Y1919, wheat; and Cα atoms, gray, are spheres. (N) ΔGCa2+ versus ΔGApo of WT CaM-binding NaV1.2 IQ biosensors. See Figure S6.
Figure 4.
Figure 4.. Ca2+ binding by CaM + NaV1.2IQp
(A) 15N-HSQC overlay of apo (black) or (Ca2+)4-15N-CaM (red) bound to 14N-NaV1.2IQp. Arrows show CSP of some CaM residues. (B) 15N-HSQC overlay of 15N-NaV1.2IQp bound to apo (black) or (Ca2+)4-14N-CaM (red). Inset shows NaV1.2IQp 1,901–1,911 (pre-IQ, light blue), 1,912–1,919 (IQ motif/green), and 1,920–1,927 (post-IQ/red). Arrows show CSP of some NaV1.2IQp residues bound to apo versus (Ca2+)4-CaM. (C) Ca2+ titration of CaMN (sites I and II) in 15N-CaM+14N-NaV1.2IQp. Normalized chemical shift changes shown for T5 ○, E6 ☒, A10 ▻, E11 ☐, F16 ⧅, S17 △, F19 formula image, D24 ◪, K30 ▽, G33 formula image, R37 formula image, S38 formula image, L39 ◧, G40 formula image, E45 formula image, E54 formula image G61 ◨, T62 ⊟, D64 ▷, F68 formula image, T70 ⧄, R74 ⊡. Inset: monitored CaMN residues (blue spheres) on 6BUT (gray). (D and E) Ca2+ titration of CaMC (sites III and IV) in 15N-CaM+14N-NaV1.2IQp. (D) Normalized peak intensities of apo CaM residues E82 ○, E83 ☒, F89 ⊡, V91 ☐, F92 ⧅, D93 △, K94 formula image, D95 ◪, Y99 ▽, S101 formula image, A102 formula image, E104 formula image, L105 ◧, H107 formula image, V108 ⧄, G113 ◨, E114 ⊟, K115 formula image, D122 formula image, M124 ◩, I130 ⊞, Y138 formula image, E139 ◩, E140 ⊲, T146 ⊳, A147 ✚, K148 formula image. (E) Normalized peak intensities of (Ca2+)4-CaM residues E82 ○, E83 ☒, K94 formula image, D95 ☐, Y99 ⧅, S101 △, A 102 formula image, A103 ⧄, E104 ◪, G113 ⊞, E114 ▽, K115 ⊟, T117 ◩, R126 formula image, D129 formula image, I130 formula image, N137 ⊟, E139 ⊙, T146 formula image, A147 ◫, K148 ◨. Inset: monitored CaMC residues (red spheres) on 6BUT (gray). (F–H) Ca2+ titration of 14N-CaM+15N-NaV1.2IQp. Normalized peak intensities of NaV1.2IQp residues. (F) K1901 ○, R1902 ◇, K1903 △, Q1904 ▽, E1905 ☐, E1906 ⧅, V1907 formula image, S1908 ☒, A1909 formula image, I1910 ⊟, I1911 ⧄; (G) I1912 ○, Q1913 formula image, R1914 △, A1915 ☐, Y1916 formula image, R1917 formula image, R1918 ⊞, Y1919 formula image, L1920 ⧅, L1921 ☒; and (H) Q1923 ◇, K1924 △, K1927 formula image. Insets: NaV1.2IQp residues monitored: pre-IQ/blue, IQ/green, post-IQ/red (spheres) on 6BUT (gray). Solid gray lines are for reference. (I and J) E1906/purple, A1909/black, I1912/cyan, Q1913/green, Y1916/orange, Y1919/orange (spheres) of NaV1.2IQp relative to apo (I) and (Ca2+)2-CaMC (J) surface (gray). 6BUT and 2M5E aligned by CaM 117–128 (blue spheres at 76). NaV1.2IQp 1,904–1,923 (gray helix), Cα of Q1904/blue and Q1923/red are small spheres. CaMC residues ≤4.5 Å of NaV1.2IQp with NaV1.2IQp-induced CSPs > (average plus 1 SD) are orchid (apo, I) or red ((Ca2+)4-CaM, J). See Figure S7.
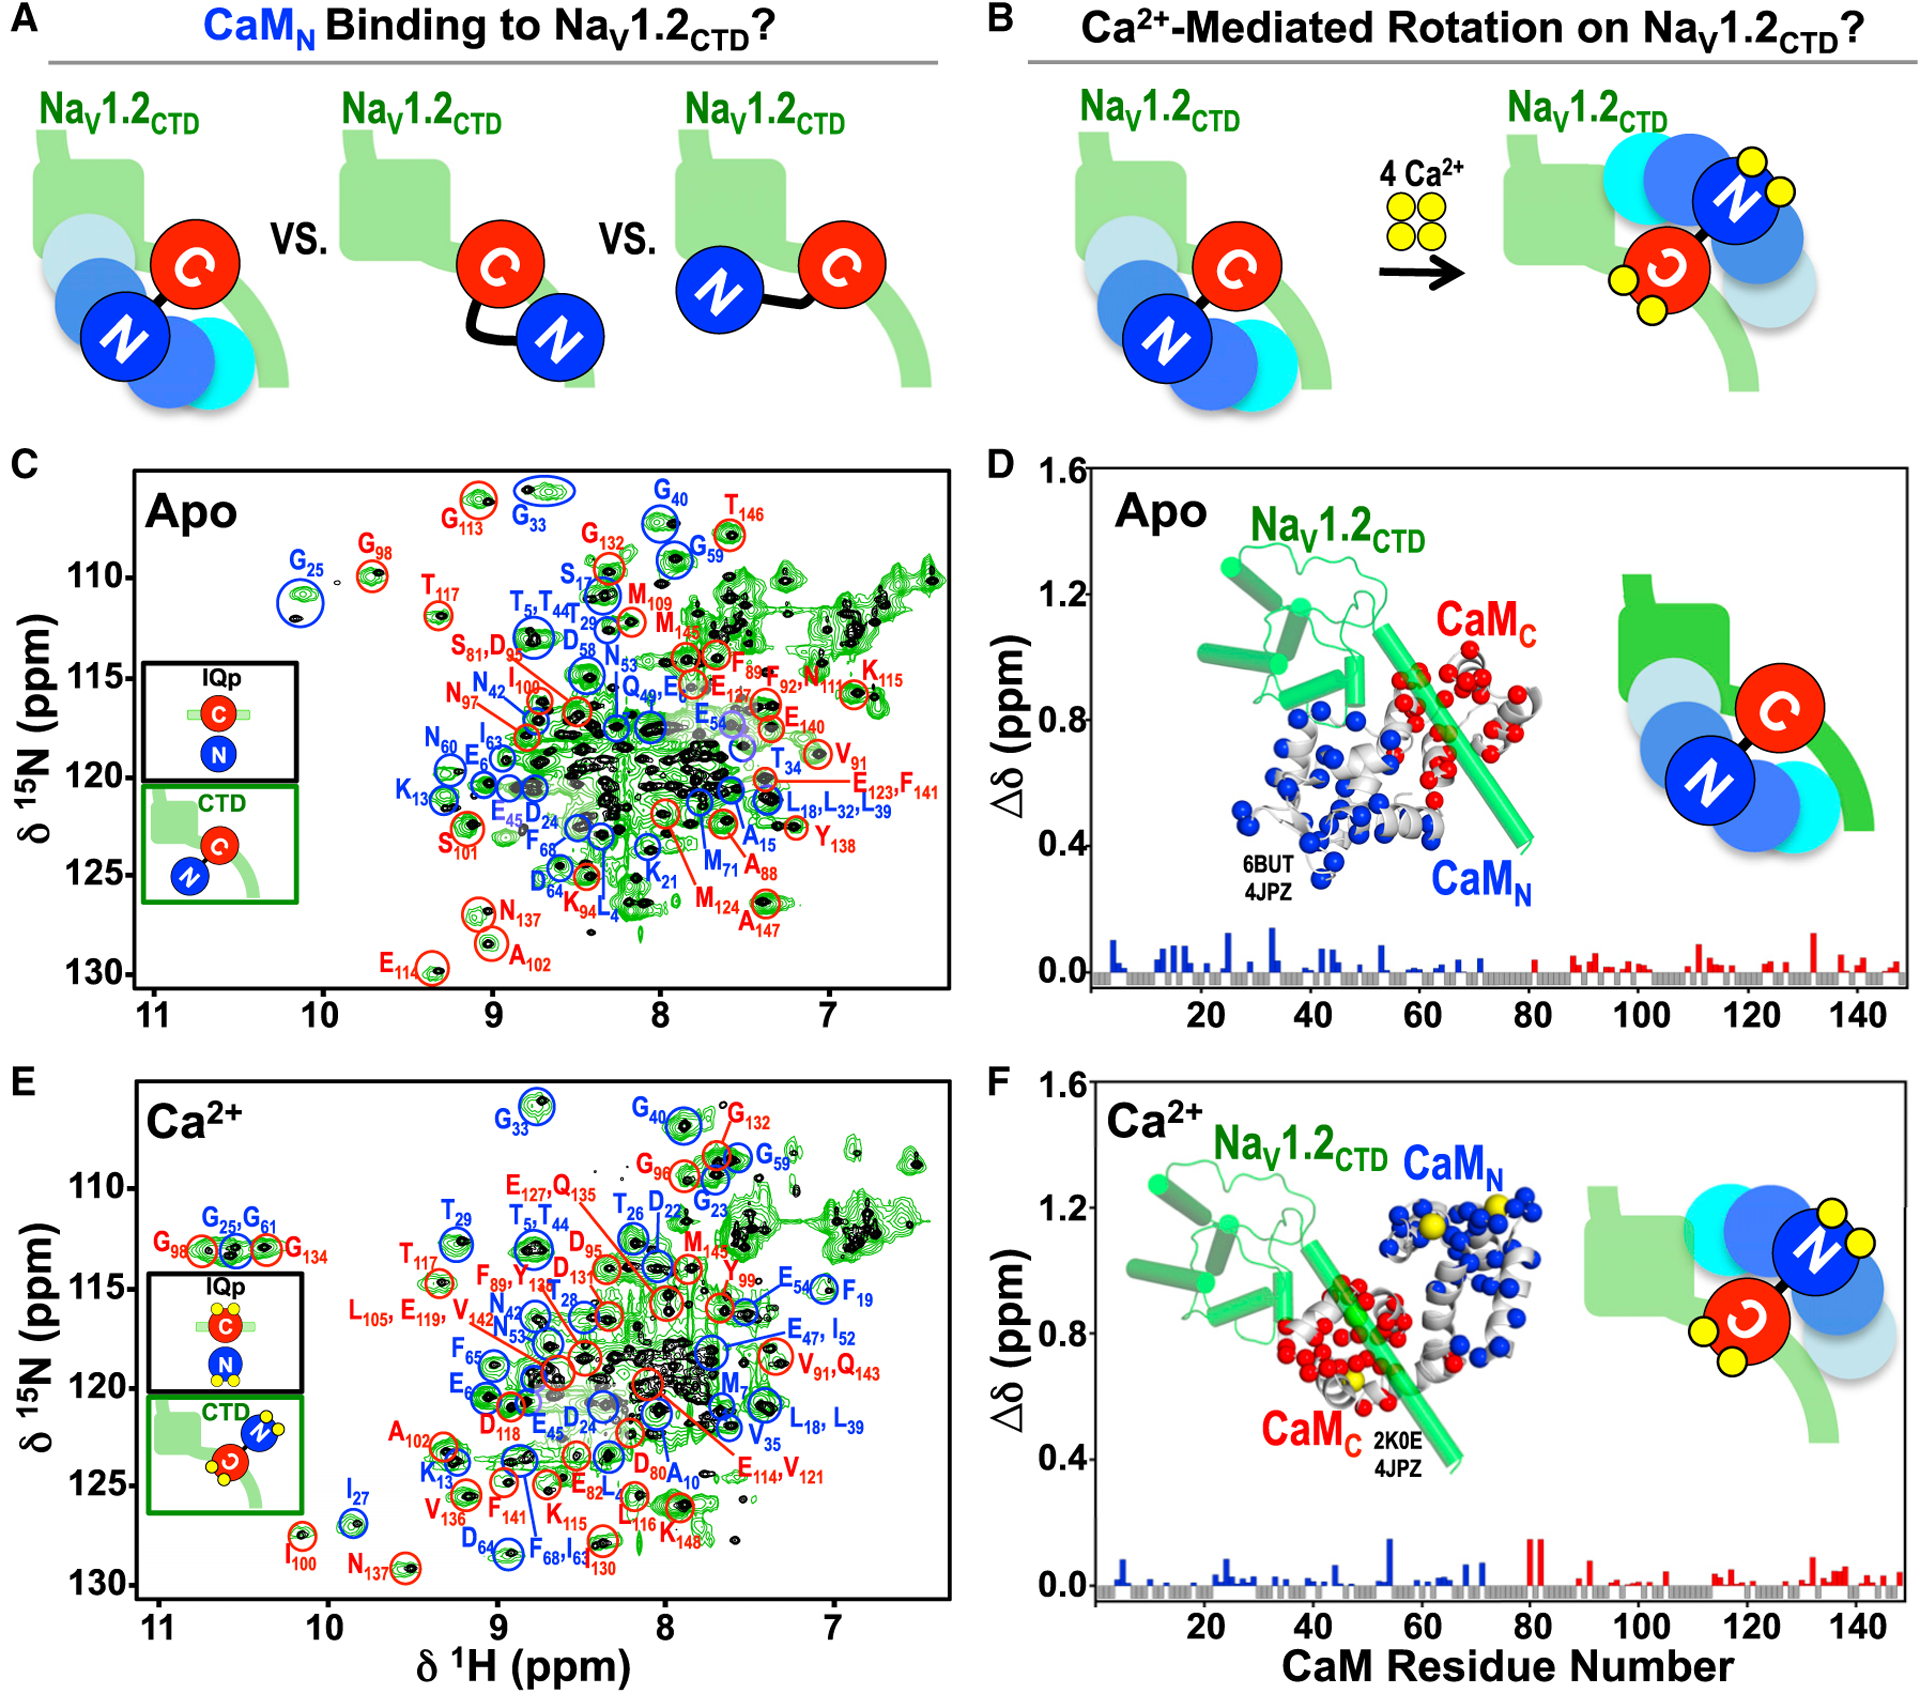
Figure 5.
Figure 5.. Interaction of CaM with Na V1.2 CTD
(A and B) Models of (A) CaMC (red) bound to NaV1.2CTD (green) with alternate positions of CaMN, blue, and (B) Ca2+-induced rotation of CaM on NaV1.2CTD. (C) 15N-HSQC overlay of apo 15N-CaM+14N-NaV1.2IQp (black) or + 14N-NaV1.2CTD (green). (D) Histogram of Δδ of labeled CaM residues in CaM + NaV1.2CTD versus CaM + NaV1.2IQp; Δδ scaled as in Figure S1A. Inset: Cα of CaM residues (CaMN, blue; CaMC, red, spheres) labeled in (C) on a model of apo CaM (6BUT, gray helices) bound to NaV1.2CTD (4JPZ, cylinders). (E) 15N-HSQC overlay of (Ca2+)4-15N-CaM+14N-NaV1.2IQp (black) or + N-NaV1.2CTD (green). (F) Histogram of Δδ of labeled CaM residues in CaM + NaV1.2CTD versus CaM + NaV1.2IQp; Δδ scaled per Figure S1A. Inset: Cα of CaM residues (CaMN, blue; CaMC, red, spheres) labeled in (E) on a model of (Ca2+)4-CaM (2K0E, gray helices) bound to NaV1.2CTD (4JPZ, cylinders, see transparent methods).
Figure 6.
Figure 6.. Effects of pathogenic CaM mutations on Ca2+ and NaV1.2 IQ motif binding
(A) Apo CaM + NaV1.2IQp (6BUT): N53, blue; D95, brown; A102, purple; E104, dark green; D129, orange; and F141L, red (ball and stick) (B) Ca2+-saturated site III (1CLL): Ca2+ (yellow spheres) and coordinating O atoms (red) of D93, blue, to E104, red. (C–E) Equilibrium Ca2+ titrations of full-length or domain fragment of WT/black or mutant (N53I, blue; D95V, brown; A102V, purple; E104A, dark green; D129G, orange; F141L, red) CaM. (C) Sites I and II in N53I CaMN (○/dashed) and full-length CaM (●/solid), sites III and IV of (D) CaMC and (E) CaM. (F) Equilibrium titrations of WT NaV1.2 IQ biosensor with WT or mutant apo CaM. Colors match (C). (G–I) Equilibrium Ca2+ titrations of CaM or CaMC fragment bound to NaV1.2IQp. (G) Sites I and II of CaM, sites III and IV of (H) CaMC, and (I) CaM. Colors match (C). (J) 15N-HSQC overlay of (Ca2+)4-15N-CaM+14 N-NaV1.2IQp (red) and free (Ca2+)2-15N-CaMN (1–75, ,blue). Inset: Cα (blue spheres) of labeled CaMN residues on (Ca2+)4-CaM (1CLL, gray). See Figures S8 and S9 and Table S1.
Figure 7.
Figure 7.. Equilibrium Ca2+ binding titrations of CaM bound to NaV1.2 CTD
(A and B) WT CaM (A) sites I and II (alone, black; +NaV1.2IQp, blue; +NaV1.2CTD, light blue) and (B) sites III and IV (alone, black; +NaV1.2IQp, red; +NaV1.2CTD, pink). (C and D) Sites I and II (C), or III and IV (D) of WT/black or mutant (N53I, blue; D95V, brown; E104A, dark green; D129G, orange; F141L, red) CaM + NaV1.2CTD. (E) Models of apo (6BUT) and (Ca2+)4-CaM (2K0E) (1–75 pale blue, 76–80 black, 81–148 pale red cylinders) bound to NaV1.2CTD (green). CaM mutations (spheres) match (C). See Figure S9, Table S1.
Figure 8.
Figure 8.. Modes of CaM interaction with NaV
(A) High-resolution structures of NaV fragments bound to CaM (aligned by 101–112 and 117–128) overlaid with models from the apo CaM + NaV1.2IQp ensemble (20 models, 6BUT/NMR). 6BUT_model9 aligned with apo CaM fused to NaV1.6 IQ motif (3WFN/XRD). 6BUT_model19 aligned with apo (Mg2+) CaM + NaV1.5 CTD (4OVN/XRD). 6BUT_model9 aligned with apo (Mg2+) CaM + NaV1.5 CTD with auxiliary FGF (4DCK/XRD). 6BUT_model13 aligned with intermediate (Ca2+)2-CaM + NaV1.2 CTD with auxiliary FGF (4JPZ/XRD). Mg2+, Ca2+ are spheres. (B and C) Cylinder models of apo (6BUT, (B) and (Ca2+)4-CaM (2K0E), (C) bound to the IQ motif of NaV CTD (4DCK/5X0M) relative to NaV IG (5XOM, orange) and auxiliary FGF (4DCK) shown as surfaces. NaV residues not in CTD or IG are light green. Ca2+ are spheres. (D) Structures of (i) (Ca2+)2-CaM bound to SK channel (1G4Y/green and pink) and (ii) (Ca2+)4-CaM bound to two distinct regions of STRA6 retinol receptor (5SY1/green and magenta), SK channel (6CNO, green and orange), and MUNC13 (2KDU, orange), aligned by CaM 43–56. Schematics show CaM bridging NaV1.2 IQ motif and CaMBD X (light pink or purple) or NaV IG, or two sites in NaV IG.

References

    1. Adsit GS, Vaidyanathan R, Galler CM, Kyle JW, and Makielski JC (2013). Channelopathies from mutations in the cardiac sodium channel protein complex. J. Mol. Cell. Cardiol 61, 34–43. - PMC - PubMed
    1. Beaven GH, and Holiday ER (1952). Ultraviolet absorption spectra of proteins and amino acids. Adv. Protein Chem 7, 319–386. - PubMed
    1. Ben-Johny M, Dick IE, Yue D, Yang W, Issa JB, Sang L, Lee SR, Limpitikul WB, Niu J, Kang PW, et al. (2014a). Towards a unified theory of calmodulin regulation (calmodulation) of voltage-gated calcium and sodium channels. Curr. Mol. Pharmacol 8, 188–205. - PMC - PubMed
    1. Ben-Johny M, Yang PS, Niu J, Yang W, Joshi-Mukherjee R, and Yue DT (2014b). Conservation of Ca2+/calmodulin regulation across Na and Ca2+ channels. Cell 157, 1657–1670. - PMC - PubMed
    1. Ben-Johny M, Yue DN, and Yue DT (2016). Detecting stoichiometry of macromolecular complexes in live cells using FRET. Nat. Commun 7, 13709. - PMC - PubMed

Publication types

LinkOut - more resources