. 2021 Apr 1;108(4):632-655.
doi: 10.1016/j.ajhg.2021.03.002. Epub 2021 Mar 25.

A unified framework for cross-population trait prediction by leveraging the genetic correlation of polygenic traits

Affiliations

A unified framework for cross-population trait prediction by leveraging the genetic correlation of polygenic traits

Mingxuan Cai et al. Am J Hum Genet. .

Abstract

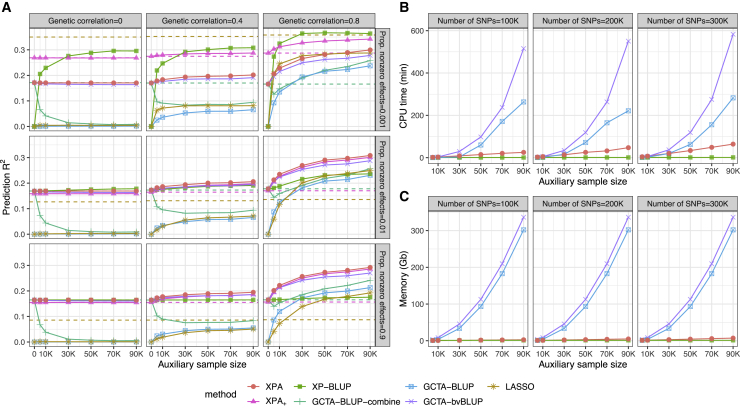
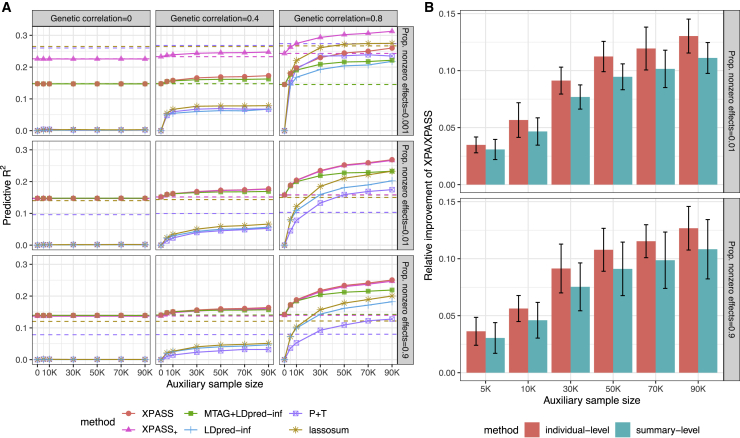
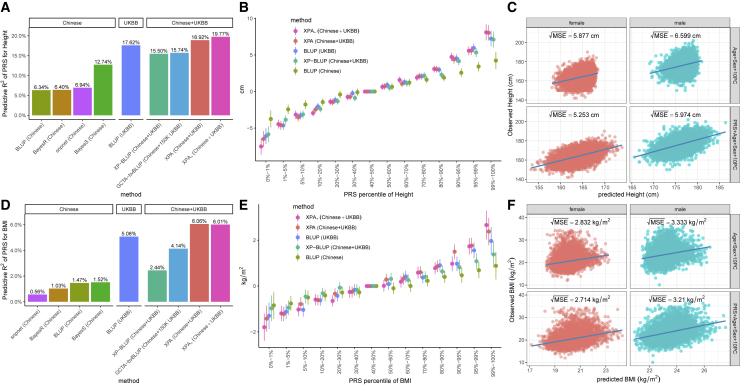
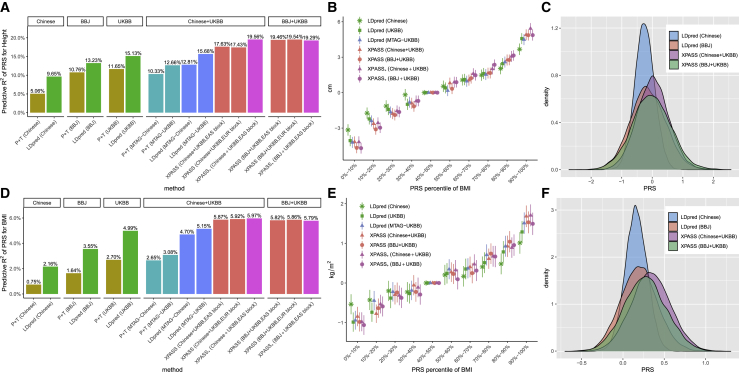
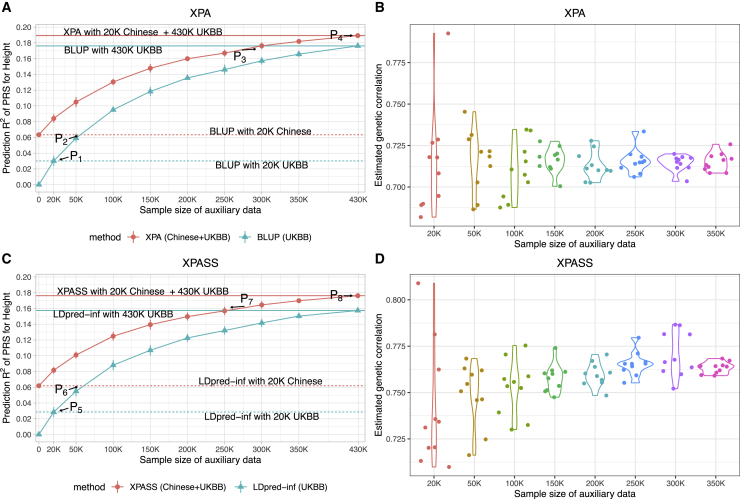
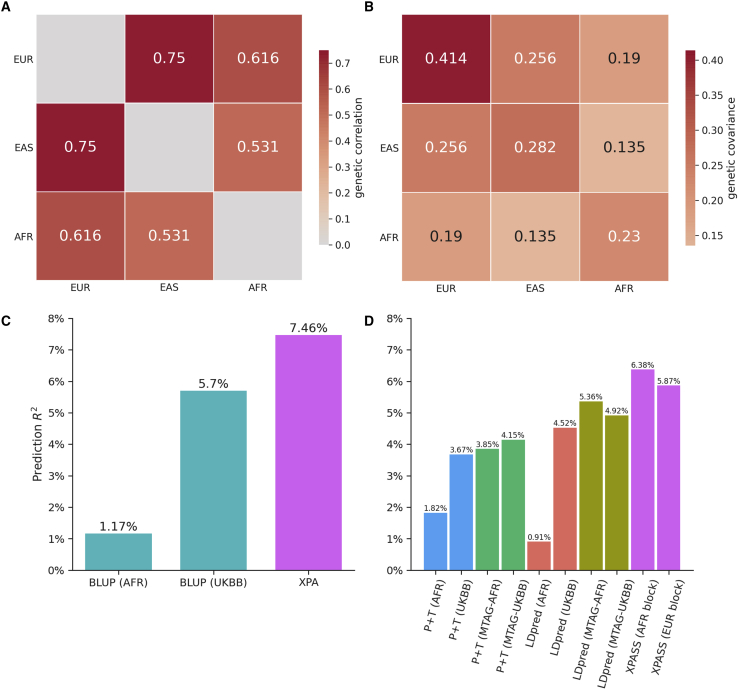
The development of polygenic risk scores (PRSs) has proved useful to stratify the general European population into different risk groups. However, PRSs are less accurate in non-European populations due to genetic differences across different populations. To improve the prediction accuracy in non-European populations, we propose a cross-population analysis framework for PRS construction with both individual-level (XPA) and summary-level (XPASS) GWAS data. By leveraging trans-ancestry genetic correlation, our methods can borrow information from the Biobank-scale European population data to improve risk prediction in the non-European populations. Our framework can also incorporate population-specific effects to further improve construction of PRS. With innovations in data structure and algorithm design, our methods provide a substantial saving in computational time and memory usage. Through comprehensive simulation studies, we show that our framework provides accurate, efficient, and robust PRS construction across a range of genetic architectures. In a Chinese cohort, our methods achieved 7.3%-198.0% accuracy gain for height and 19.5%-313.3% accuracy gain for body mass index (BMI) in terms of predictive R2 compared to existing PRS approaches. We also show that XPA and XPASS can achieve substantial improvement for construction of height PRSs in the African population, suggesting the generality of our framework across global populations.

Keywords: GWAS; UK Biobankcross-population; ancestry; cross-population; polygenic risk score.


Conflict of interest statement

The authors declare no competing interests.

Figures

Figure 1
Figure 1
Comparison of individual-level approaches in simulation studies (A) Mean predictive R2 of XPA, XPA+, GCTA-BLUP, LASSO, and XP-BLUP in each of nine simulation scenarios. The dashed lines show the R2 obtained by training with target dataset only. For XPA, XPA+, XP-BLUP, and GCTA-bvBLUP, the solid lines show the R2 obtained by combining both target and auxiliary datasets. For GCTA-BLUP-combine, the solid line shows the R2 obtained by merging the target and auxiliary datasets. For GCTA-BLUP and LASSO, the solid lines show the R2 obtained by training with auxiliary dataset only. (B) CPU timings for XPA, XP-BLUP, and GCTA-BLUP are shown for increasing auxiliary sample size based on different numbers of SNPs. (C) Memory usages for XPA, XP-BLUP, and GCTA-BLUP are shown for increasing auxiliary sample sizes based on different numbers of SNPs. Results are summarized from ten replicates.
Figure 2
Figure 2
Comparison of summary-level approaches in simulation studies (A) Mean prediction R2 in each of nine simulation scenarios. Compared methods include XPASS, XPASS+, LDpred-inf, MTAG+LDpred-inf, P+T procedure, and lassosum. The dashed lines show the R2 obtained by training with target dataset only. For XPASS, XPASS+, and MTAG+LDpred-inf, the solid lines show the R2 obtained by combining both target and auxiliary datasets. For other methods, the solid lines show the R2 obtained by training with auxiliary dataset only. (B) Relative improvement in predictive R2 of XPA and XPASS as compared to GCTA-BLUP and LDpred-inf, respectively. Results are summarized from ten replications. Error bars represent ±1.96 of the standard error.
Figure 3
Figure 3
Prediction performance of XPA and related individual-level methods for height and BMI in the Chinese population Predictive R2 for height and BMI are shown in (A) and (D). Stratification ability of compared methods for height and BMI are shown in (B) and (E). Error bars represent ±1.96 of the standard error. (C) and (F) show the comparison of XPA with traditional risk factor models in height and BMI.
Figure 4
Figure 4
Prediction performance of XPASS and related summary-level methods for height and BMI in the Chinese population Compared methods include XPASS, XPASS+, LDpred, and P+T. For LDpred and P+T, one of the five sets of GWAS summary statistics were used as training set: Chinese only, BBJ only, UKBB only, improved Chinese and UKBB summary statistics obtained by combining the two datasets using MTAG (MTAG-Chinese and MTAG-UKBB). Predictive R2 for height and BMI are shown in (A) and (D). Panels in (A) and (D) represent the datasets used for training. Stratification ability of XPASS and LDpred for height (B) and BMI (E). Error bars represent ±1.96 of the standard error. The distributions of PRSs constructed by XPASS and LDpred for height (C) and BMI (F).
Figure 5
Figure 5
Influence of the auxiliary sample size on the prediction performance of XPA and XPASS for predicting height Predictive R2 of XPA and XPASS are shown in (A) and (C). The corresponding trans-ancestry genetic correlations estimated by XPA and XPASS in each replicate are shown in (B) and (D). We trained XPA and XPASS by integrating 21,069 Chinese training samples with 20,000–300,000 random subsamples drawn from UKBB, where samples from UKBB could be viewed as the auxiliary dataset. The results are summarized from ten replications. Dashed horizontal lines in (A) and (C) mark the BLUP/LDpred-inf results obtained by using 20,000 samples from Chinese (red) and UKBB (cyan). Solid horizontal lines in (A) and (C) mark the results obtained by using all UKBB samples with (red) or without (cyan) Chinese. Points P1−P4 in (A) represent the situations where the auxiliary sample size achieves 20,000 (P1), BLUP trained on about 50,000 UKBB samples achieves equivalent performance with that trained on 20,000 Chinese samples (P2), XPA achieves identical performance with BLUP trained on all UKBB samples (P3), and XPA is trained with all UKBB samples (P4). Points P5−P8 in (C) represent the similar situations for summary-level approaches XPASS and LDpred-inf. Error bars represent ±1.96 of the standard error.
Figure 6
Figure 6
Application of XPA and XPASS for predicting height in the African population Trans-ancestry genetic correlation (A) and genetic covariance (B) among European, African, and East Asian populations for height. (C) Prediction performance of XPA and BLUP for height measured by predictive R2. (D) Prediction performance of XPASS, LDpred, and P+T for height measured by predictive R2. For LDpred and P+T, one of the four sets of GWAS summary statistics were used as training set: African only, UKBB only, improved African and UKBB summary statistics obtained by combining the two datasets using MTAG (MTAG-AFR and MTAG-UKBB). For XPASS, we used the LD reference from either AFR or EUR population to construct independent LD blocks (AFR block and EUR block).
None

References

    1. Torkamani A., Wineinger N.E., Topol E.J. The personal and clinical utility of polygenic risk scores. Nat. Rev. Genet. 2018;19:581–590. - PubMed
    1. Abul-Husn N.S., Manickam K., Jones L.K., Wright E.A., Hartzel D.N., Gonzaga-Jauregui C., O’Dushlaine C., Leader J.B., Lester Kirchner H., Lindbuchler D.M. Genetic identification of familial hypercholesterolemia within a single U.S. health care system. Science. 2016;354:aaf7000. - PubMed
    1. Khera A.V., Chaffin M., Aragam K.G., Haas M.E., Roselli C., Choi S.H., Natarajan P., Lander E.S., Lubitz S.A., Ellinor P.T., Kathiresan S. Genome-wide polygenic scores for common diseases identify individuals with risk equivalent to monogenic mutations. Nat. Genet. 2018;50:1219–1224. - PMC - PubMed
    1. Craig J.E., Han X., Qassim A., Hassall M., Cooke Bailey J.N., Kinzy T.G., Khawaja A.P., An J., Marshall H., Gharahkhani P., NEIGHBORHOOD consortium. UK Biobank Eye and Vision Consortium Multitrait analysis of glaucoma identifies new risk loci and enables polygenic prediction of disease susceptibility and progression. Nat. Genet. 2020;52:160–166. - PMC - PubMed
    1. Bustamante C.D., Burchard E.G., De la Vega F.M. Genomics for the world. Nature. 2011;475:163–165. - PMC - PubMed

Publication types

LinkOut - more resources