. 2021 Apr 1;108(4):656-668.
doi: 10.1016/j.ajhg.2021.03.012. Epub 2021 Mar 25.

Low-coverage sequencing cost-effectively detects known and novel variation in underrepresented populations

Affiliations

Low-coverage sequencing cost-effectively detects known and novel variation in underrepresented populations

Alicia R Martin et al. Am J Hum Genet. .

Abstract

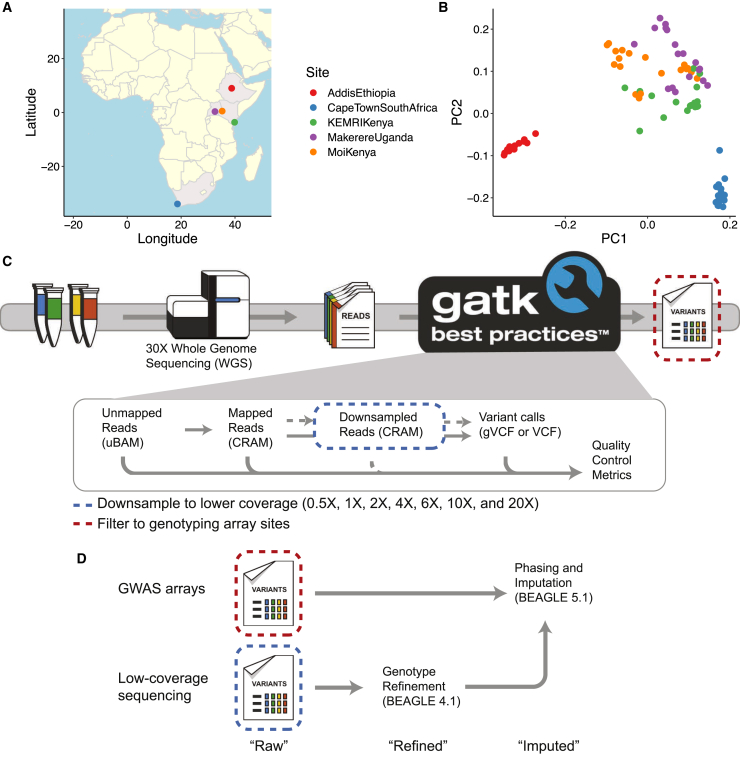
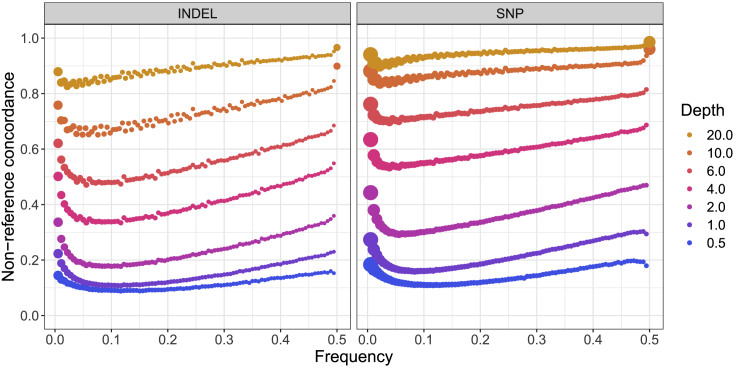
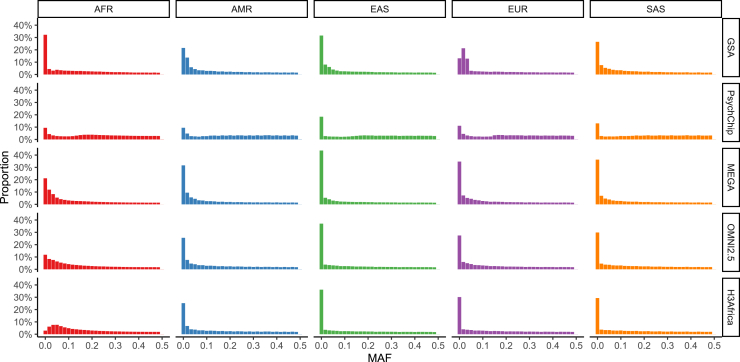
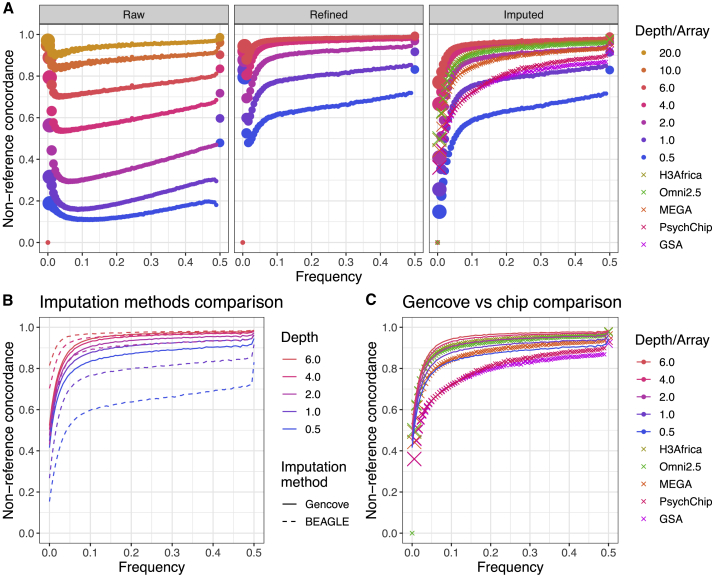
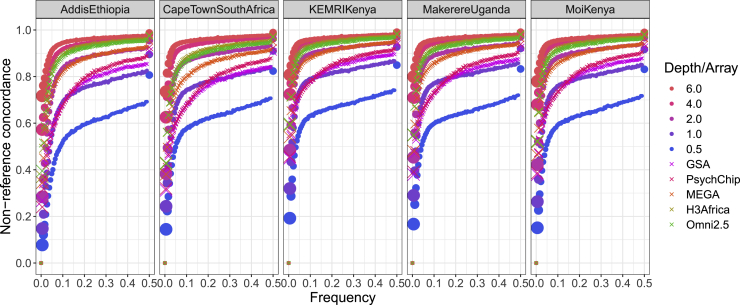
Genetic studies in underrepresented populations identify disproportionate numbers of novel associations. However, most genetic studies use genotyping arrays and sequenced reference panels that best capture variation most common in European ancestry populations. To compare data generation strategies best suited for underrepresented populations, we sequenced the whole genomes of 91 individuals to high coverage as part of the Neuropsychiatric Genetics of African Population-Psychosis (NeuroGAP-Psychosis) study with participants from Ethiopia, Kenya, South Africa, and Uganda. We used a downsampling approach to evaluate the quality of two cost-effective data generation strategies, GWAS arrays versus low-coverage sequencing, by calculating the concordance of imputed variants from these technologies with those from deep whole-genome sequencing data. We show that low-coverage sequencing at a depth of ≥4× captures variants of all frequencies more accurately than all commonly used GWAS arrays investigated and at a comparable cost. Lower depths of sequencing (0.5-1×) performed comparably to commonly used low-density GWAS arrays. Low-coverage sequencing is also sensitive to novel variation; 4× sequencing detects 45% of singletons and 95% of common variants identified in high-coverage African whole genomes. Low-coverage sequencing approaches surmount the problems induced by the ascertainment of common genotyping arrays, effectively identify novel variation particularly in underrepresented populations, and present opportunities to enhance variant discovery at a cost similar to traditional approaches.

Keywords: Africa; GWAS; GWAS arrays; cost comparison; low-coverage sequencing; study design; whole-genome sequencing.


Conflict of interest statement

A.R.M. has consulted for 23andMe and Illumina. B.M.N. is a member of the Deep Genomics Scientific Advisory Board. He also serves as a consultant for the Camp4 Therapeutics Corporation, Takeda Pharmaceutical, and Biogen. M.J.D. is a founder of Maze Therapeutics. J.K.P. is an employee of Gencove, Inc. D.J.S. has received research grants and/or consultancy honoraria from Lundbeck and Sun. The remaining authors declare no competing interests.

Figures

Figure 1
Figure 1
Populations and sites included in high-coverage whole-genome sequence data and downsampling schema to assess the performance of lower-coverage sequencing versus GWAS arrays (A) Map indicating where participants in the NeuroGAP-Psychosis study are enrolled in this dataset. (B) The first two principal components (PCs) show variation within and among populations. They first distinguish the Ethiopians, and then the South Africans, from other African populations. Colors are consistent in (A) and (B). (C) High-coverage genomes were processed with the GATK best practices pipeline. To mimic lower-coverage sequencing data, we downsampled analysis-ready CRAM files to various depths, followed by a standard implementation of the variant calling pipeline. To mimic GWAS array data, we filtered the variants called from the high-coverage sequencing data to only those sites on the arrays. (D) After variants were filtered from high-coverage data to sites on GWAS arrays, they were phased and imputed with Beagle 5.1. After downsampling reads from high-coverage data to various depths of coverage, we refined genotypes by using Beagle 4.1 (the last version of Beagle to provide this feature), then phased and imputed them by using Beagle 5.1, as with GWAS arrays. “Raw” indicates that variant calls were produced directly from GATK with no genotype refinement or imputation, “refined” indicates variant calls from genotype refinement without imputation, and “imputed” indicates imputed variants following genotype refinement.
Figure 2
Figure 2
Pre-imputation non-reference variant concordance We computed non-reference concordance comparing downsampled data at several depths of coverage to the highest depth sequencing call set available for all samples. The size of each dot is proportional to the number of variants in each bin. Depth summaries across samples are shown in Figure S1. Non-reference concordances averaged across variants of all allele frequencies are shown in Table S3.
Figure 3
Figure 3
Minor allele frequency (MAF) across GWAS arrays and continental ancestries via 1000 Genomes data AFR, Africans; AMR, admixed Americans (e.g., Hispanics/Latinos); EAS, East Asians; EUR, Europeans; SAS, South Asians. These results indicate that the GSA captures variants that are especially common in Europeans relative to elsewhere.
Figure 4
Figure 4
Non-reference concordance for SNPs as a function of sequencing depth or genotyping array, frequency, analysis stage, and imputation method “Truth” dataset here is the full depth joint called sequencing dataset. All depths of sequencing data are shown for the raw data (i.e., only variant calling from GATK with no genotype refinement or imputation following). We excluded sequencing at 10× and 20× for all except the raw data because of minimal potential accuracy gains and to reduce computational costs. (A) Non-reference concordance comparisons throughout steps of the Beagle analysis pipeline. Size of the points are proportional to the number of SNPs in each frequency bin. “Raw” indicates that variant calls were produced directly from GATK with no genotype refinement or imputation, “refined” indicates variant calls from genotype refinement without imputation, and “imputed” indicates imputed variants following genotype refinement. (B) Non-reference concordance comparisons of Beagle versus Gencove software for imputation of low-coverage data. (C) Non-reference concordance comparison of Gencove software for imputation of low-coverage data versus Beagle for imputation of GWAS arrays. Non-reference concordance values averaged across (B) and (C) are shown in Table S4.
Figure 5
Figure 5
Non-reference concordance between imputed versus truth data across various populations and sites in Africa Size of the points where applicable are proportional to the number of SNPs in each frequency bin. Quantitative comparisons across all variants and imputation methods are shown in Table S5.

References

    1. Marchini J., Howie B. Genotype imputation for genome-wide association studies. Nat. Rev. Genet. 2010;11:499–511. - PubMed
    1. Lachance J., Tishkoff S.A. SNP ascertainment bias in population genetic analyses: why it is important, and how to correct it. BioEssays. 2013;35:780–786. - PMC - PubMed
    1. Wojcik G.L., Fuchsberger C., Taliun D., Welch R., Martin A.R., Shringarpure S., Carlson C.S., Abecasis G., Kang H.M., Boehnke M. Imputation-Aware Tag SNP Selection To Improve Power for Large-Scale, Multi-ethnic Association Studies. G3 (Bethesda) 2018;8:3255–3267. - PMC - PubMed
    1. McCarthy S., Das S., Kretzschmar W., Delaneau O., Wood A.R., Teumer A., Kang H.M., Fuchsberger C., Danecek P., Sharp K., Haplotype Reference Consortium A reference panel of 64,976 haplotypes for genotype imputation. Nat. Genet. 2016;48:1279–1283. - PMC - PubMed
    1. Huang L., Li Y., Singleton A.B., Hardy J.A., Abecasis G., Rosenberg N.A., Scheet P. Genotype-imputation accuracy across worldwide human populations. Am. J. Hum. Genet. 2009;84:235–250. - PMC - PubMed

Publication types

LinkOut - more resources