. 2021 May 4;33(5):1027-1041.e8.
doi: 10.1016/j.cmet.2021.03.003. Epub 2021 Mar 25.

Malic enzyme 2 connects the Krebs cycle intermediate fumarate to mitochondrial biogenesis

Affiliations

Malic enzyme 2 connects the Krebs cycle intermediate fumarate to mitochondrial biogenesis

Yi-Ping Wang et al. Cell Metab. .

Abstract

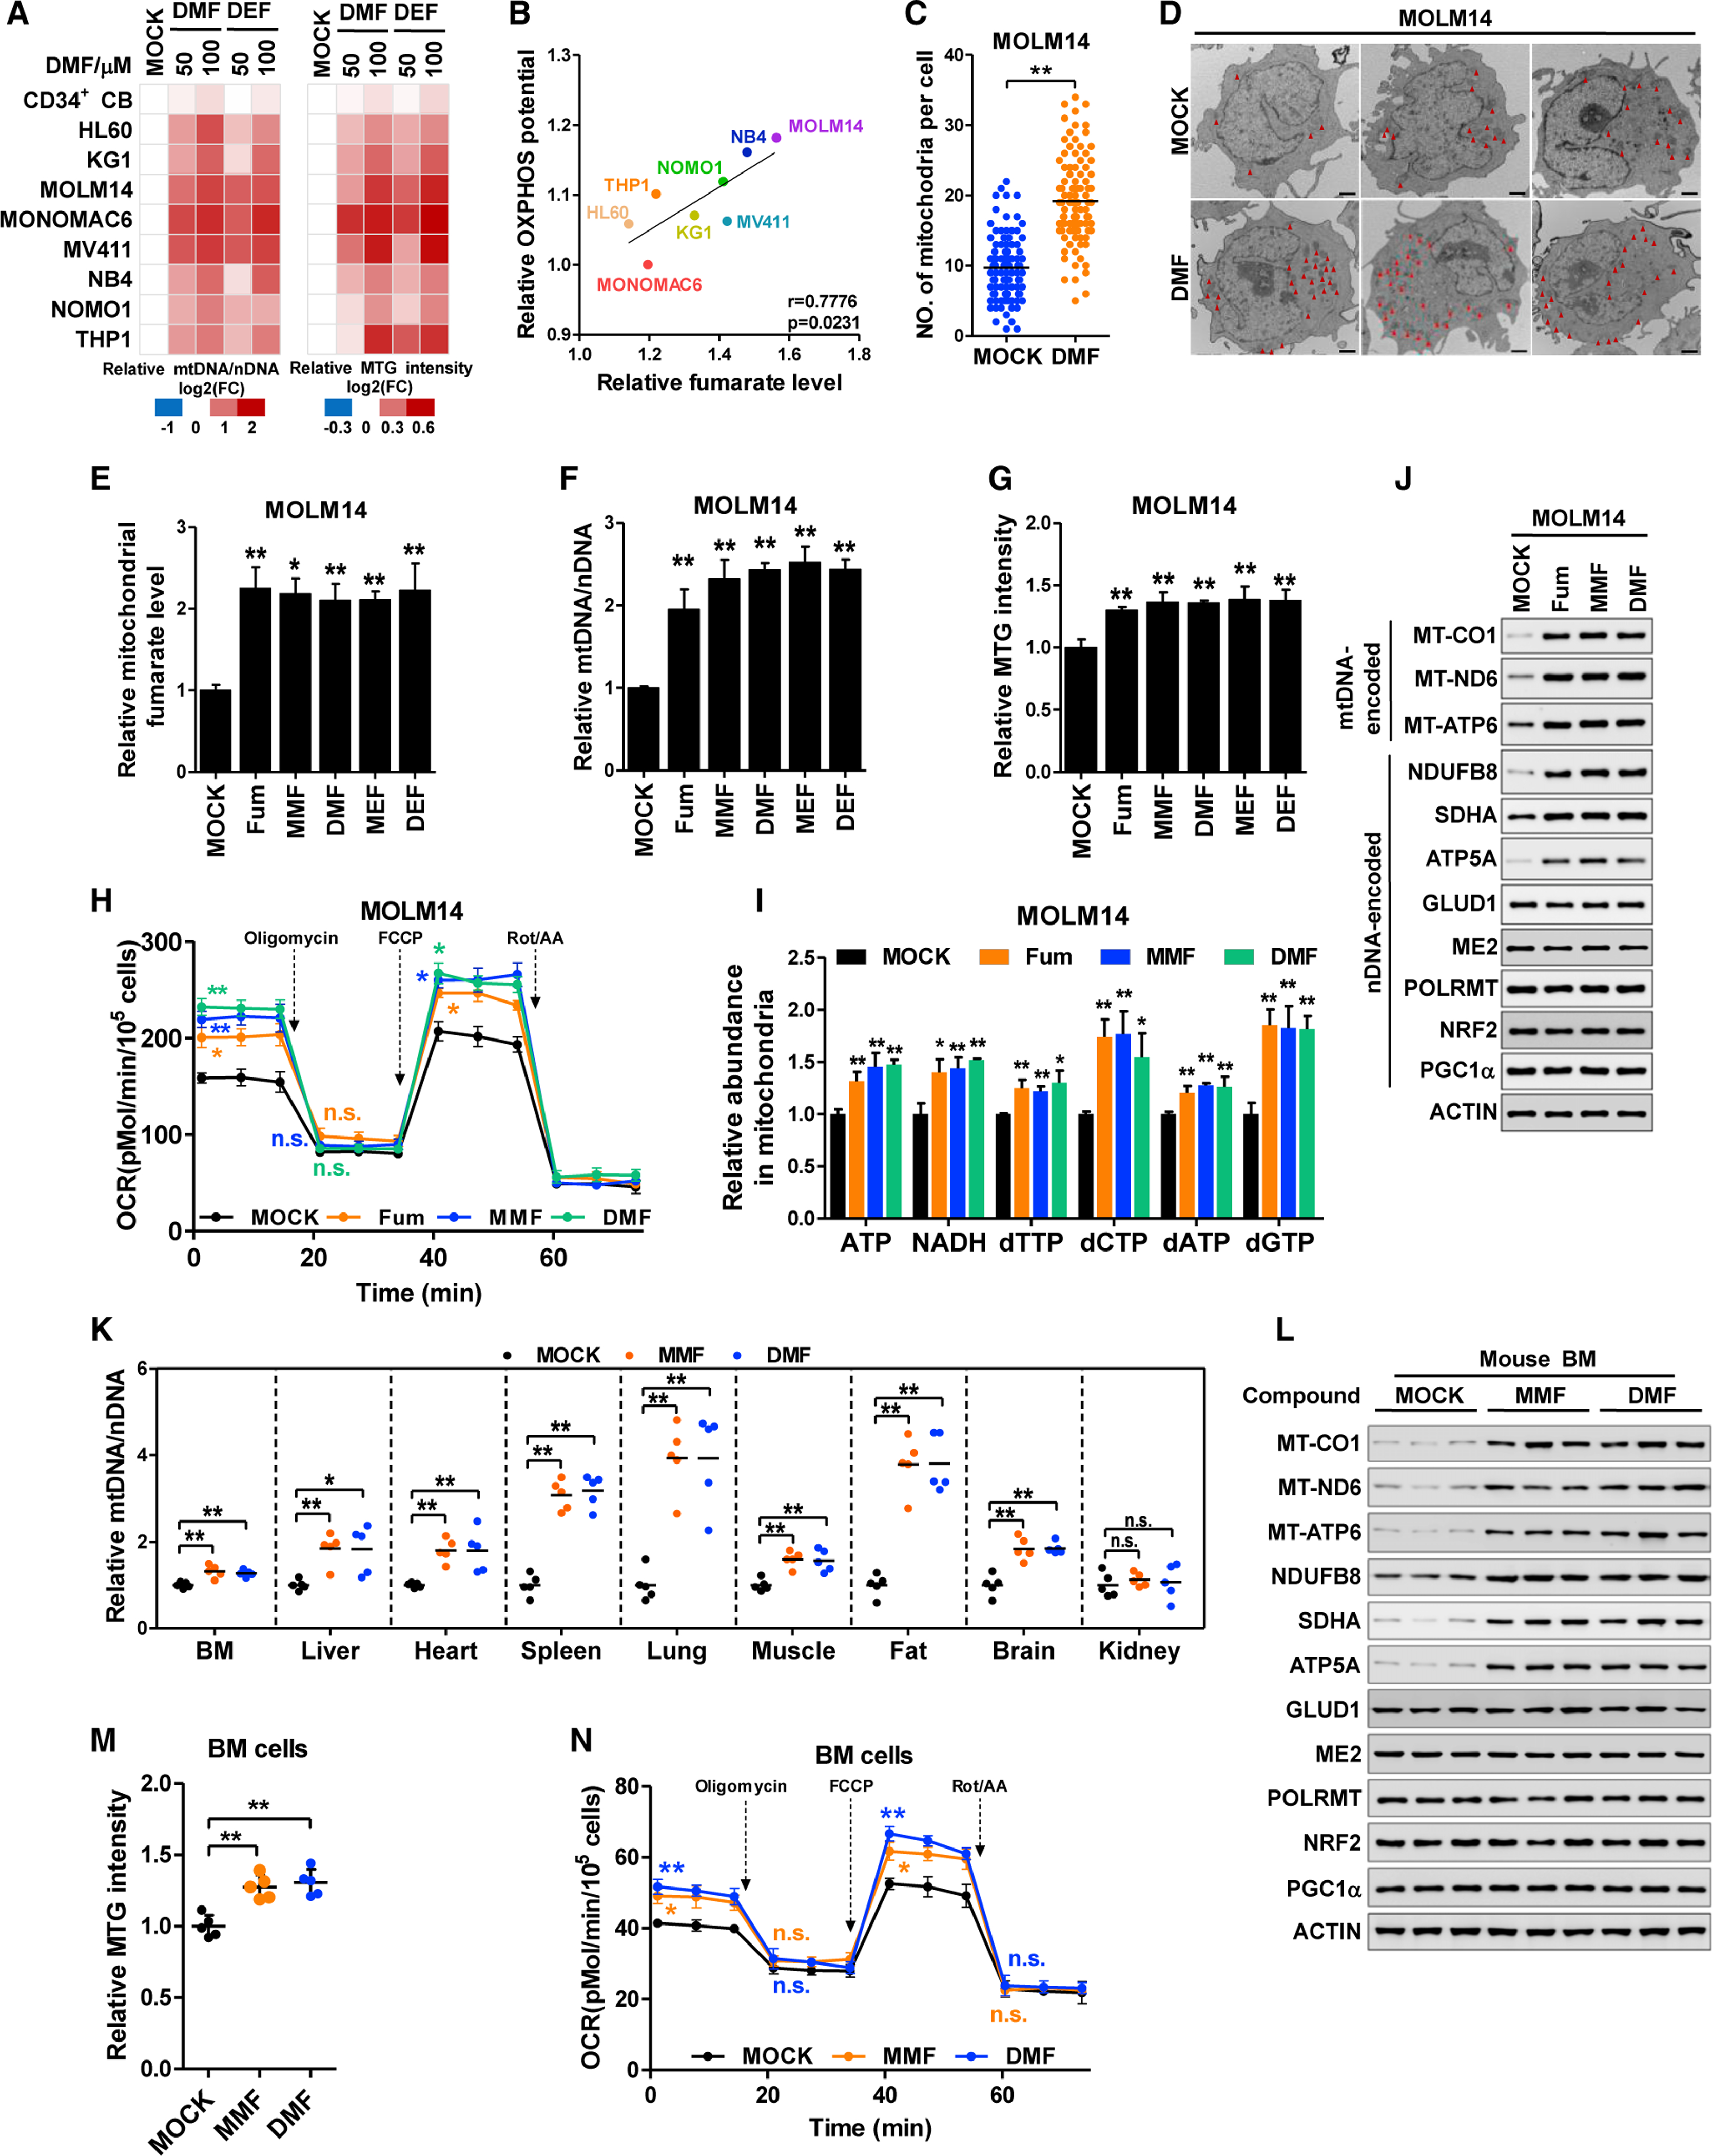
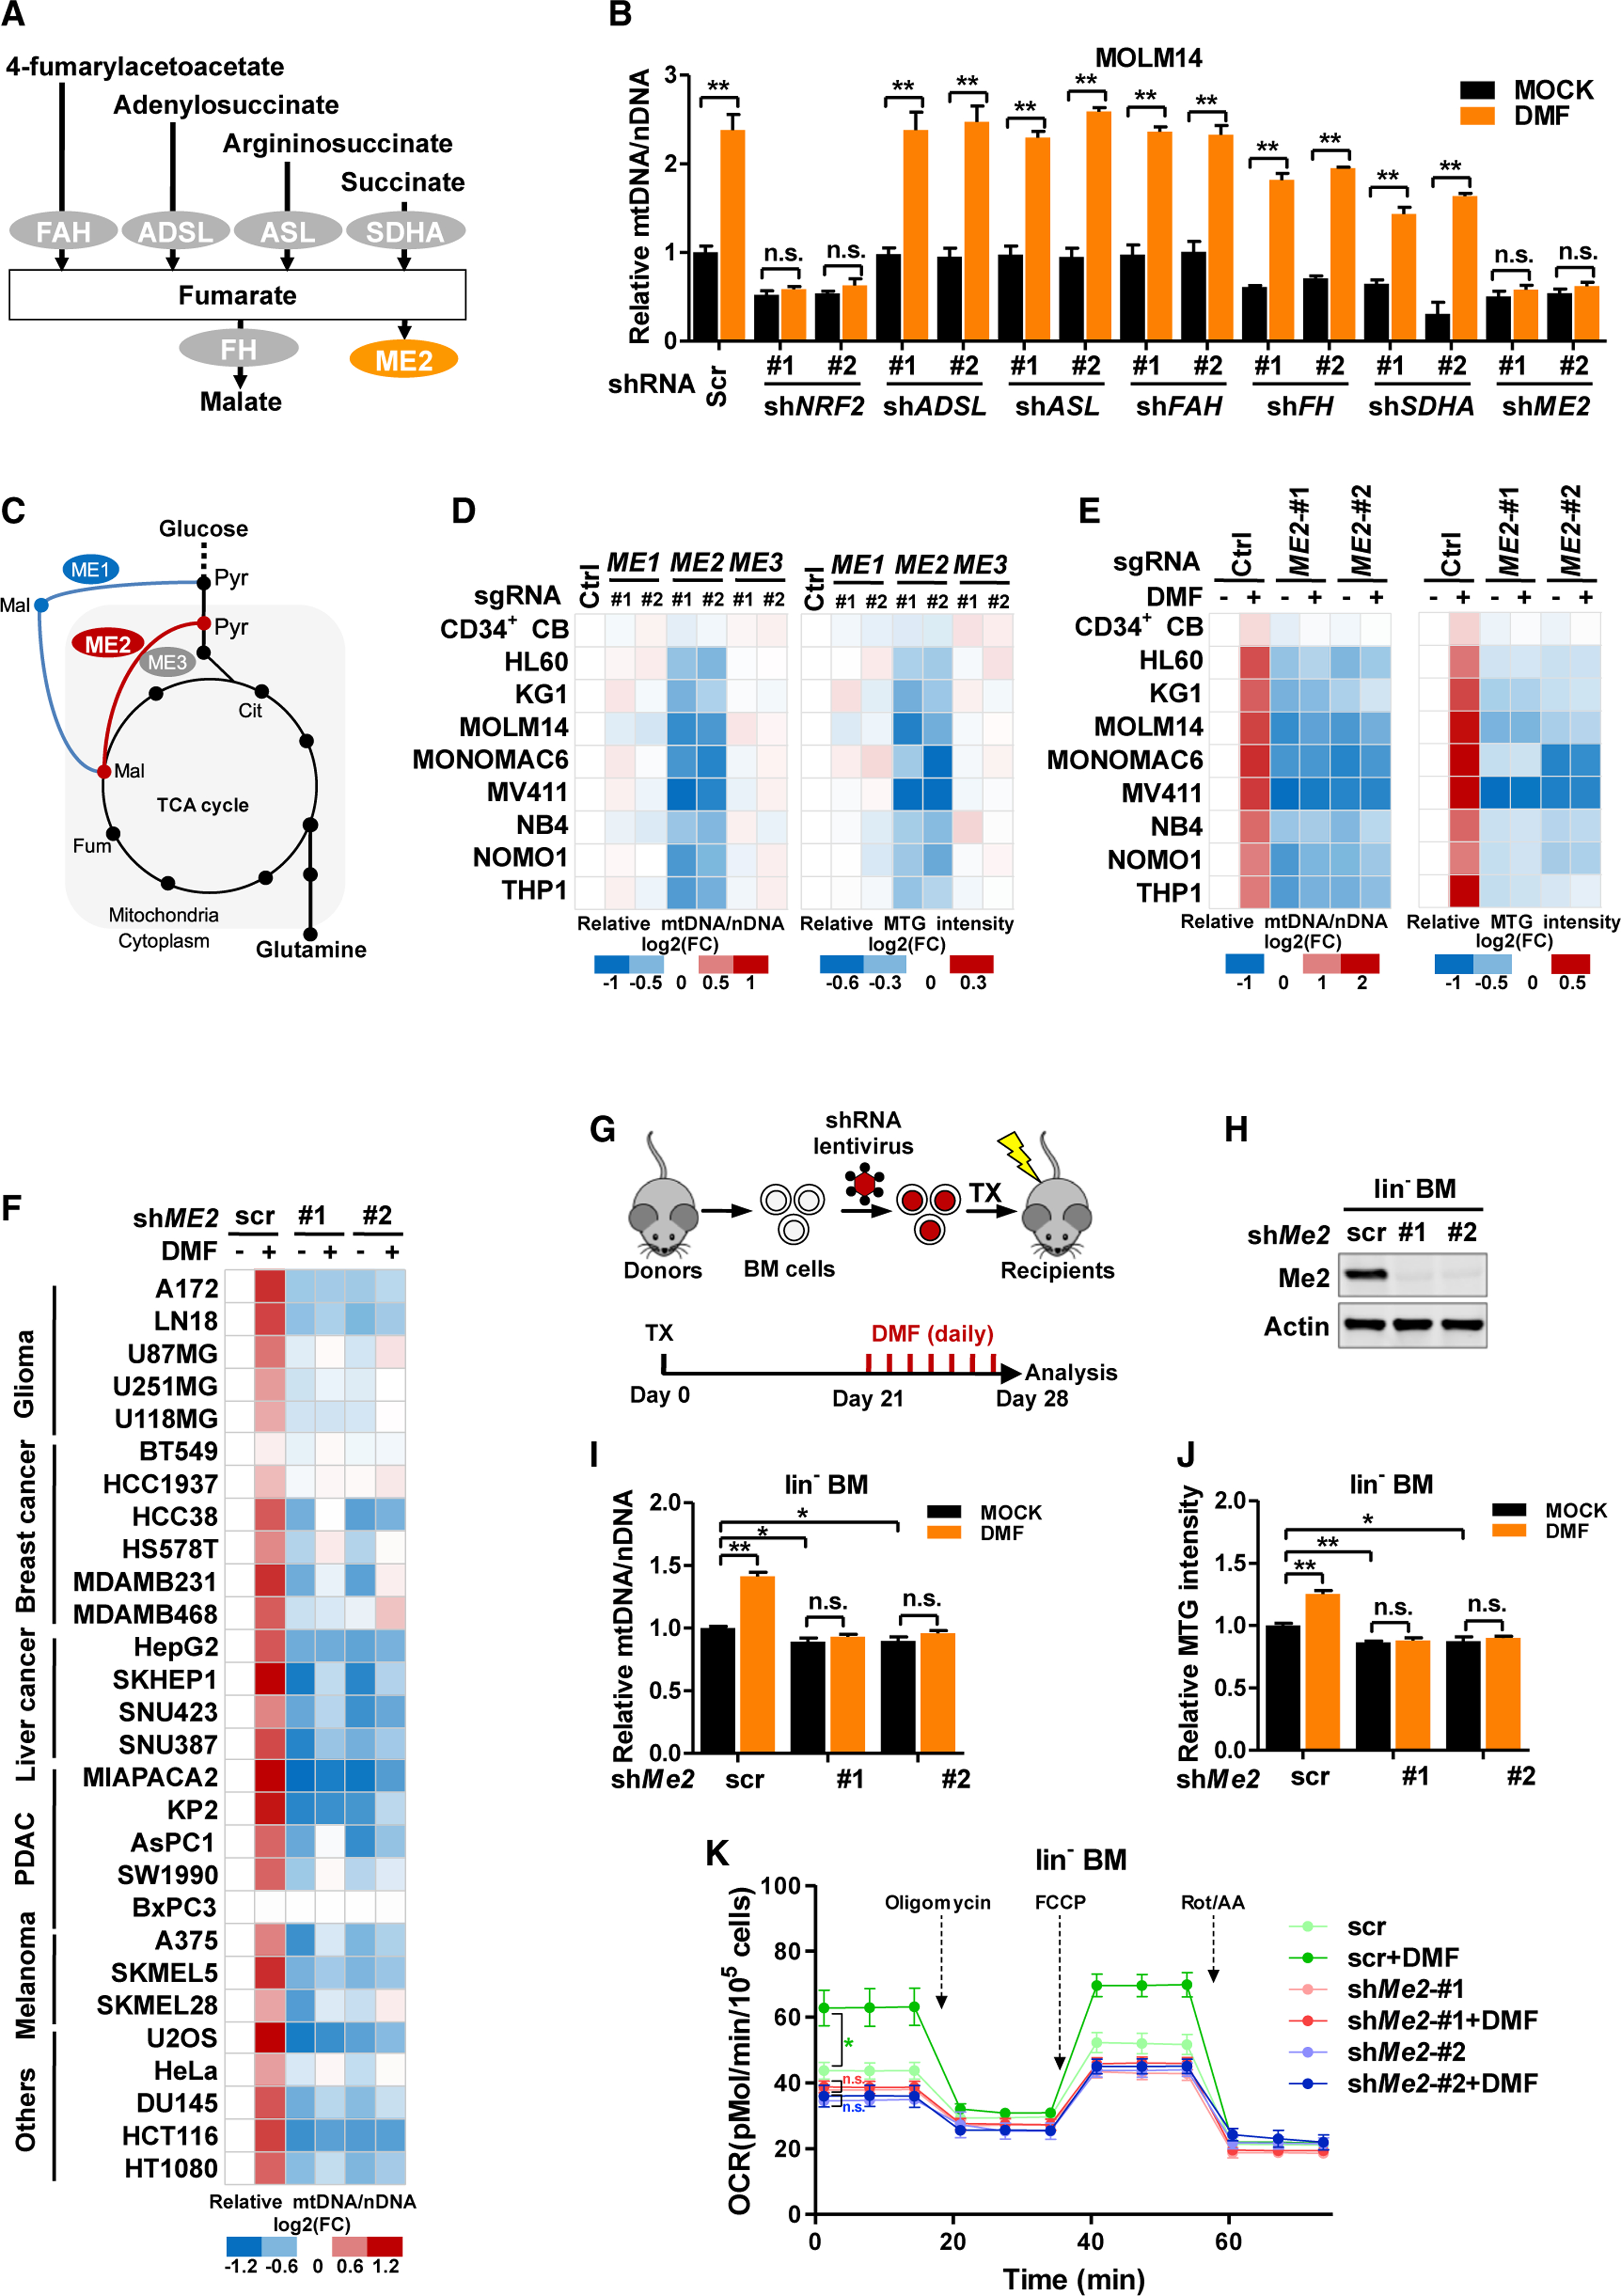
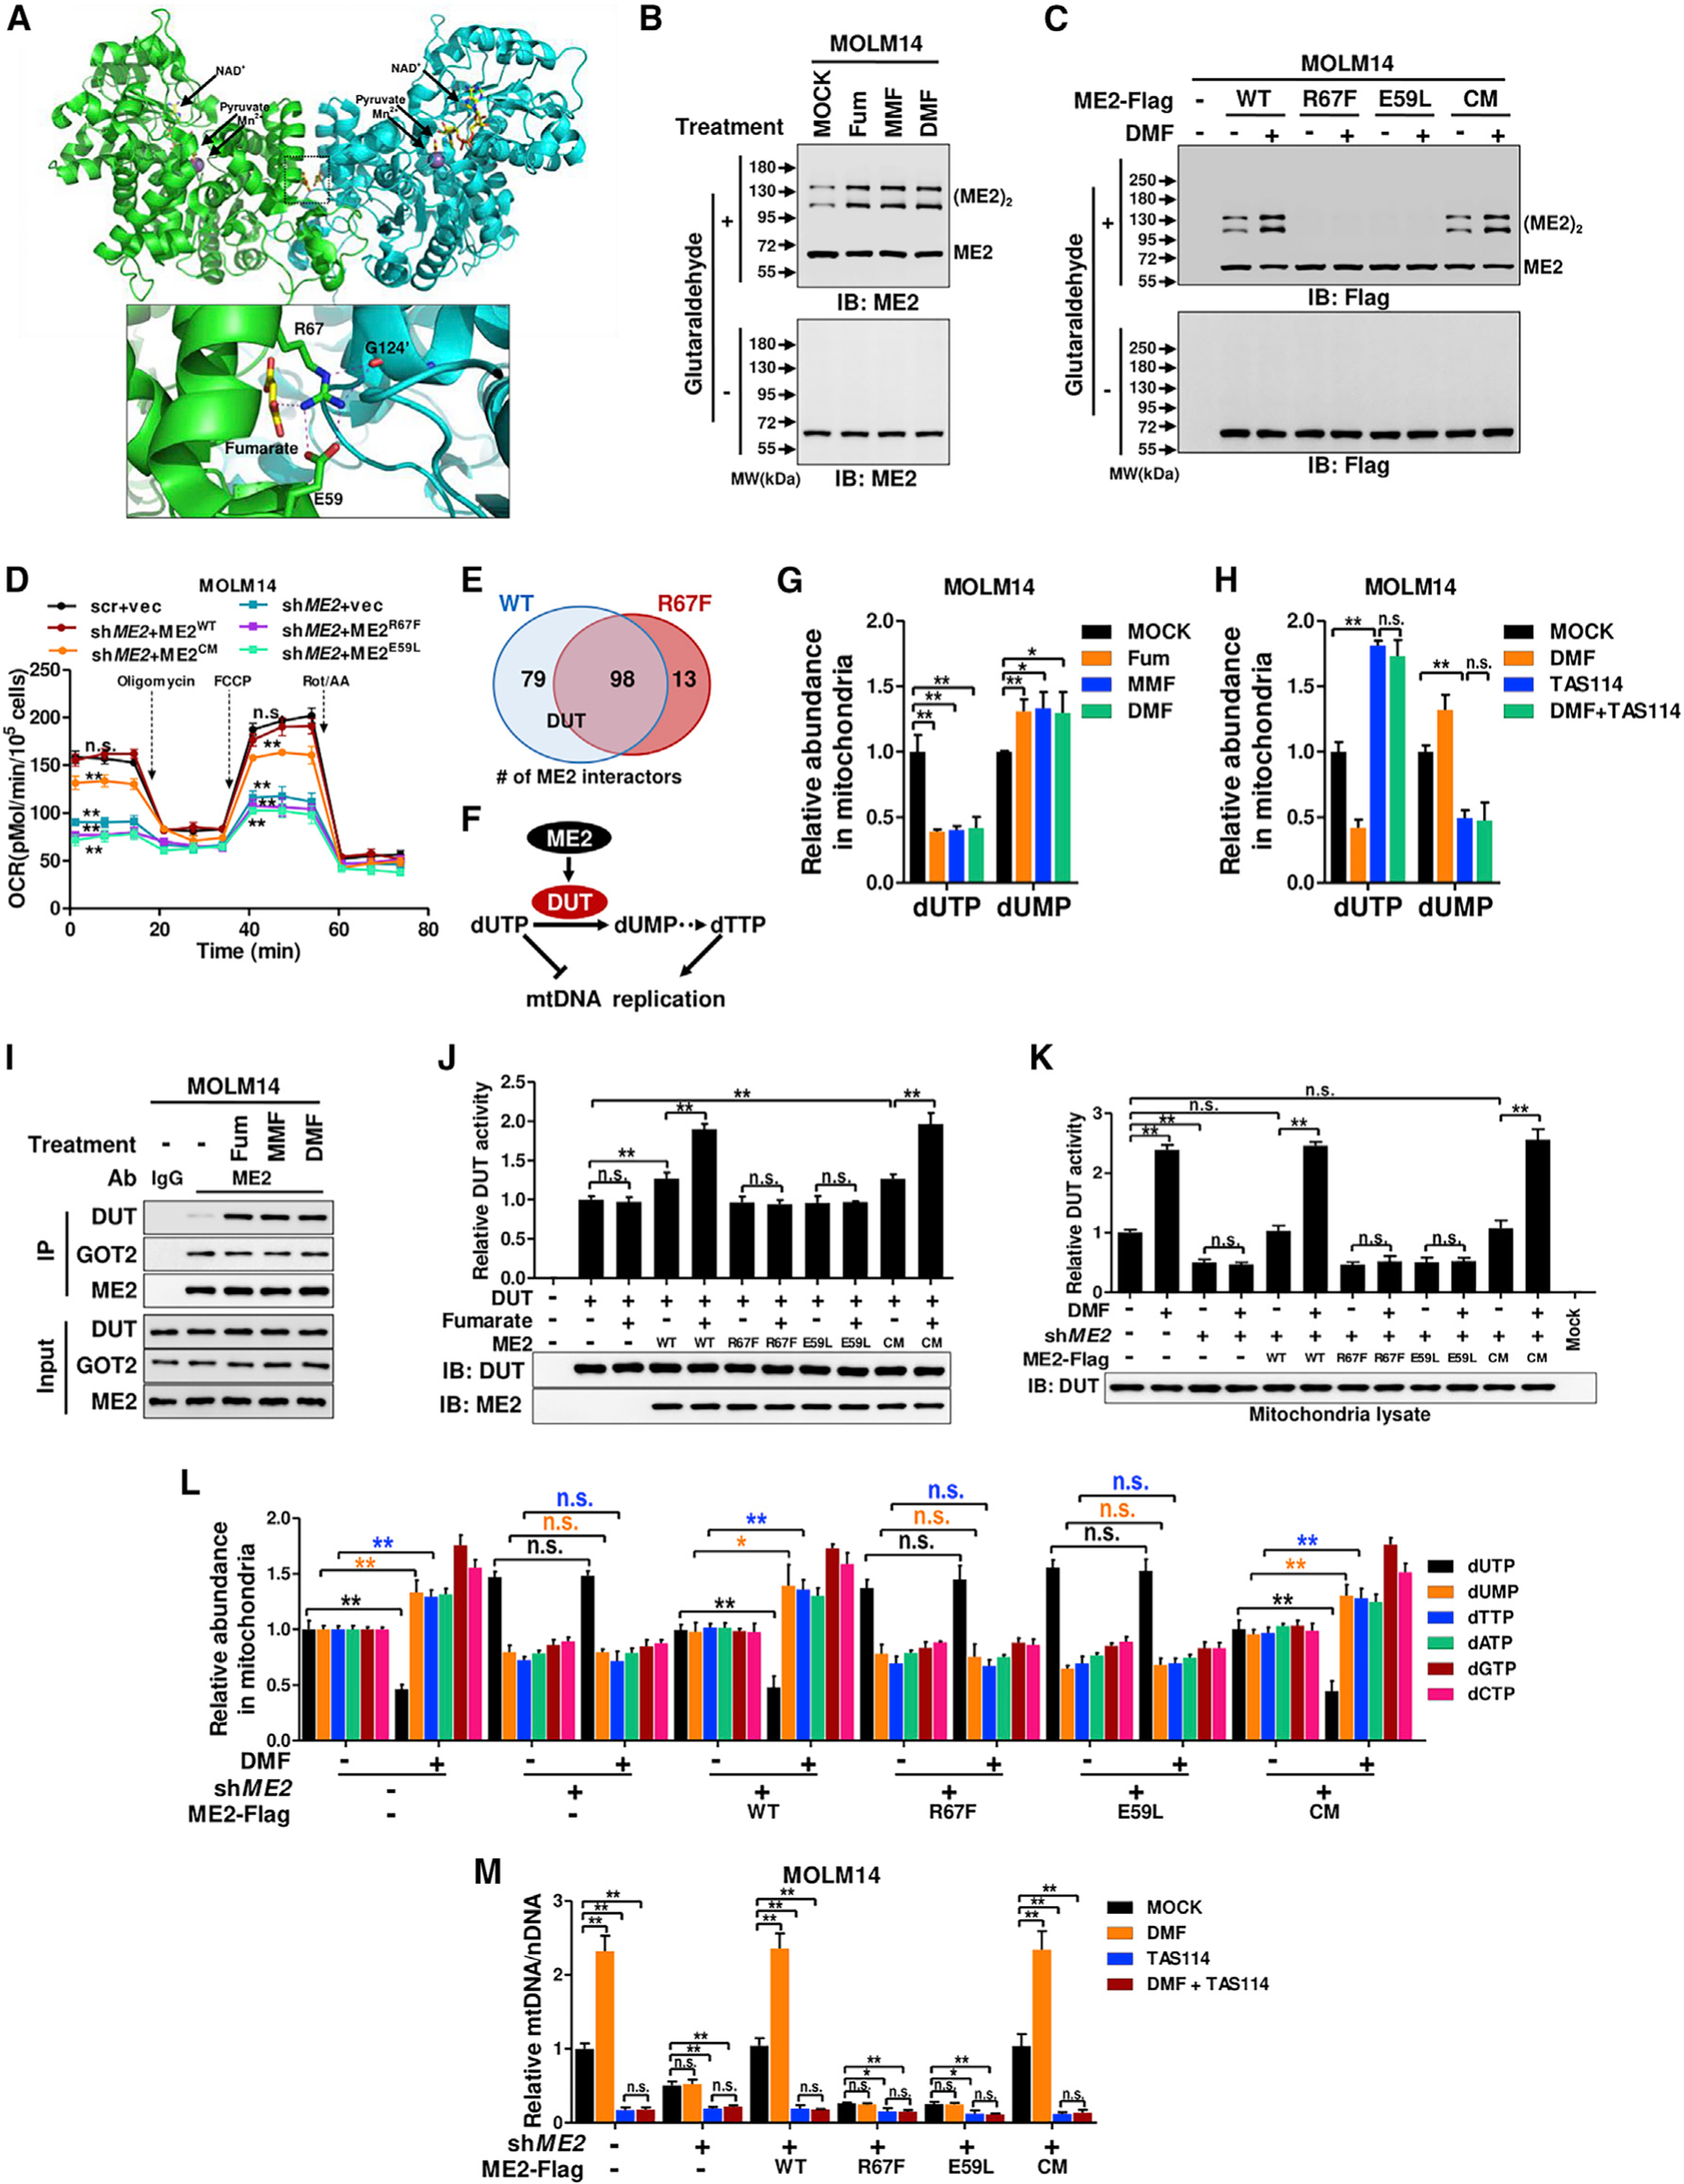
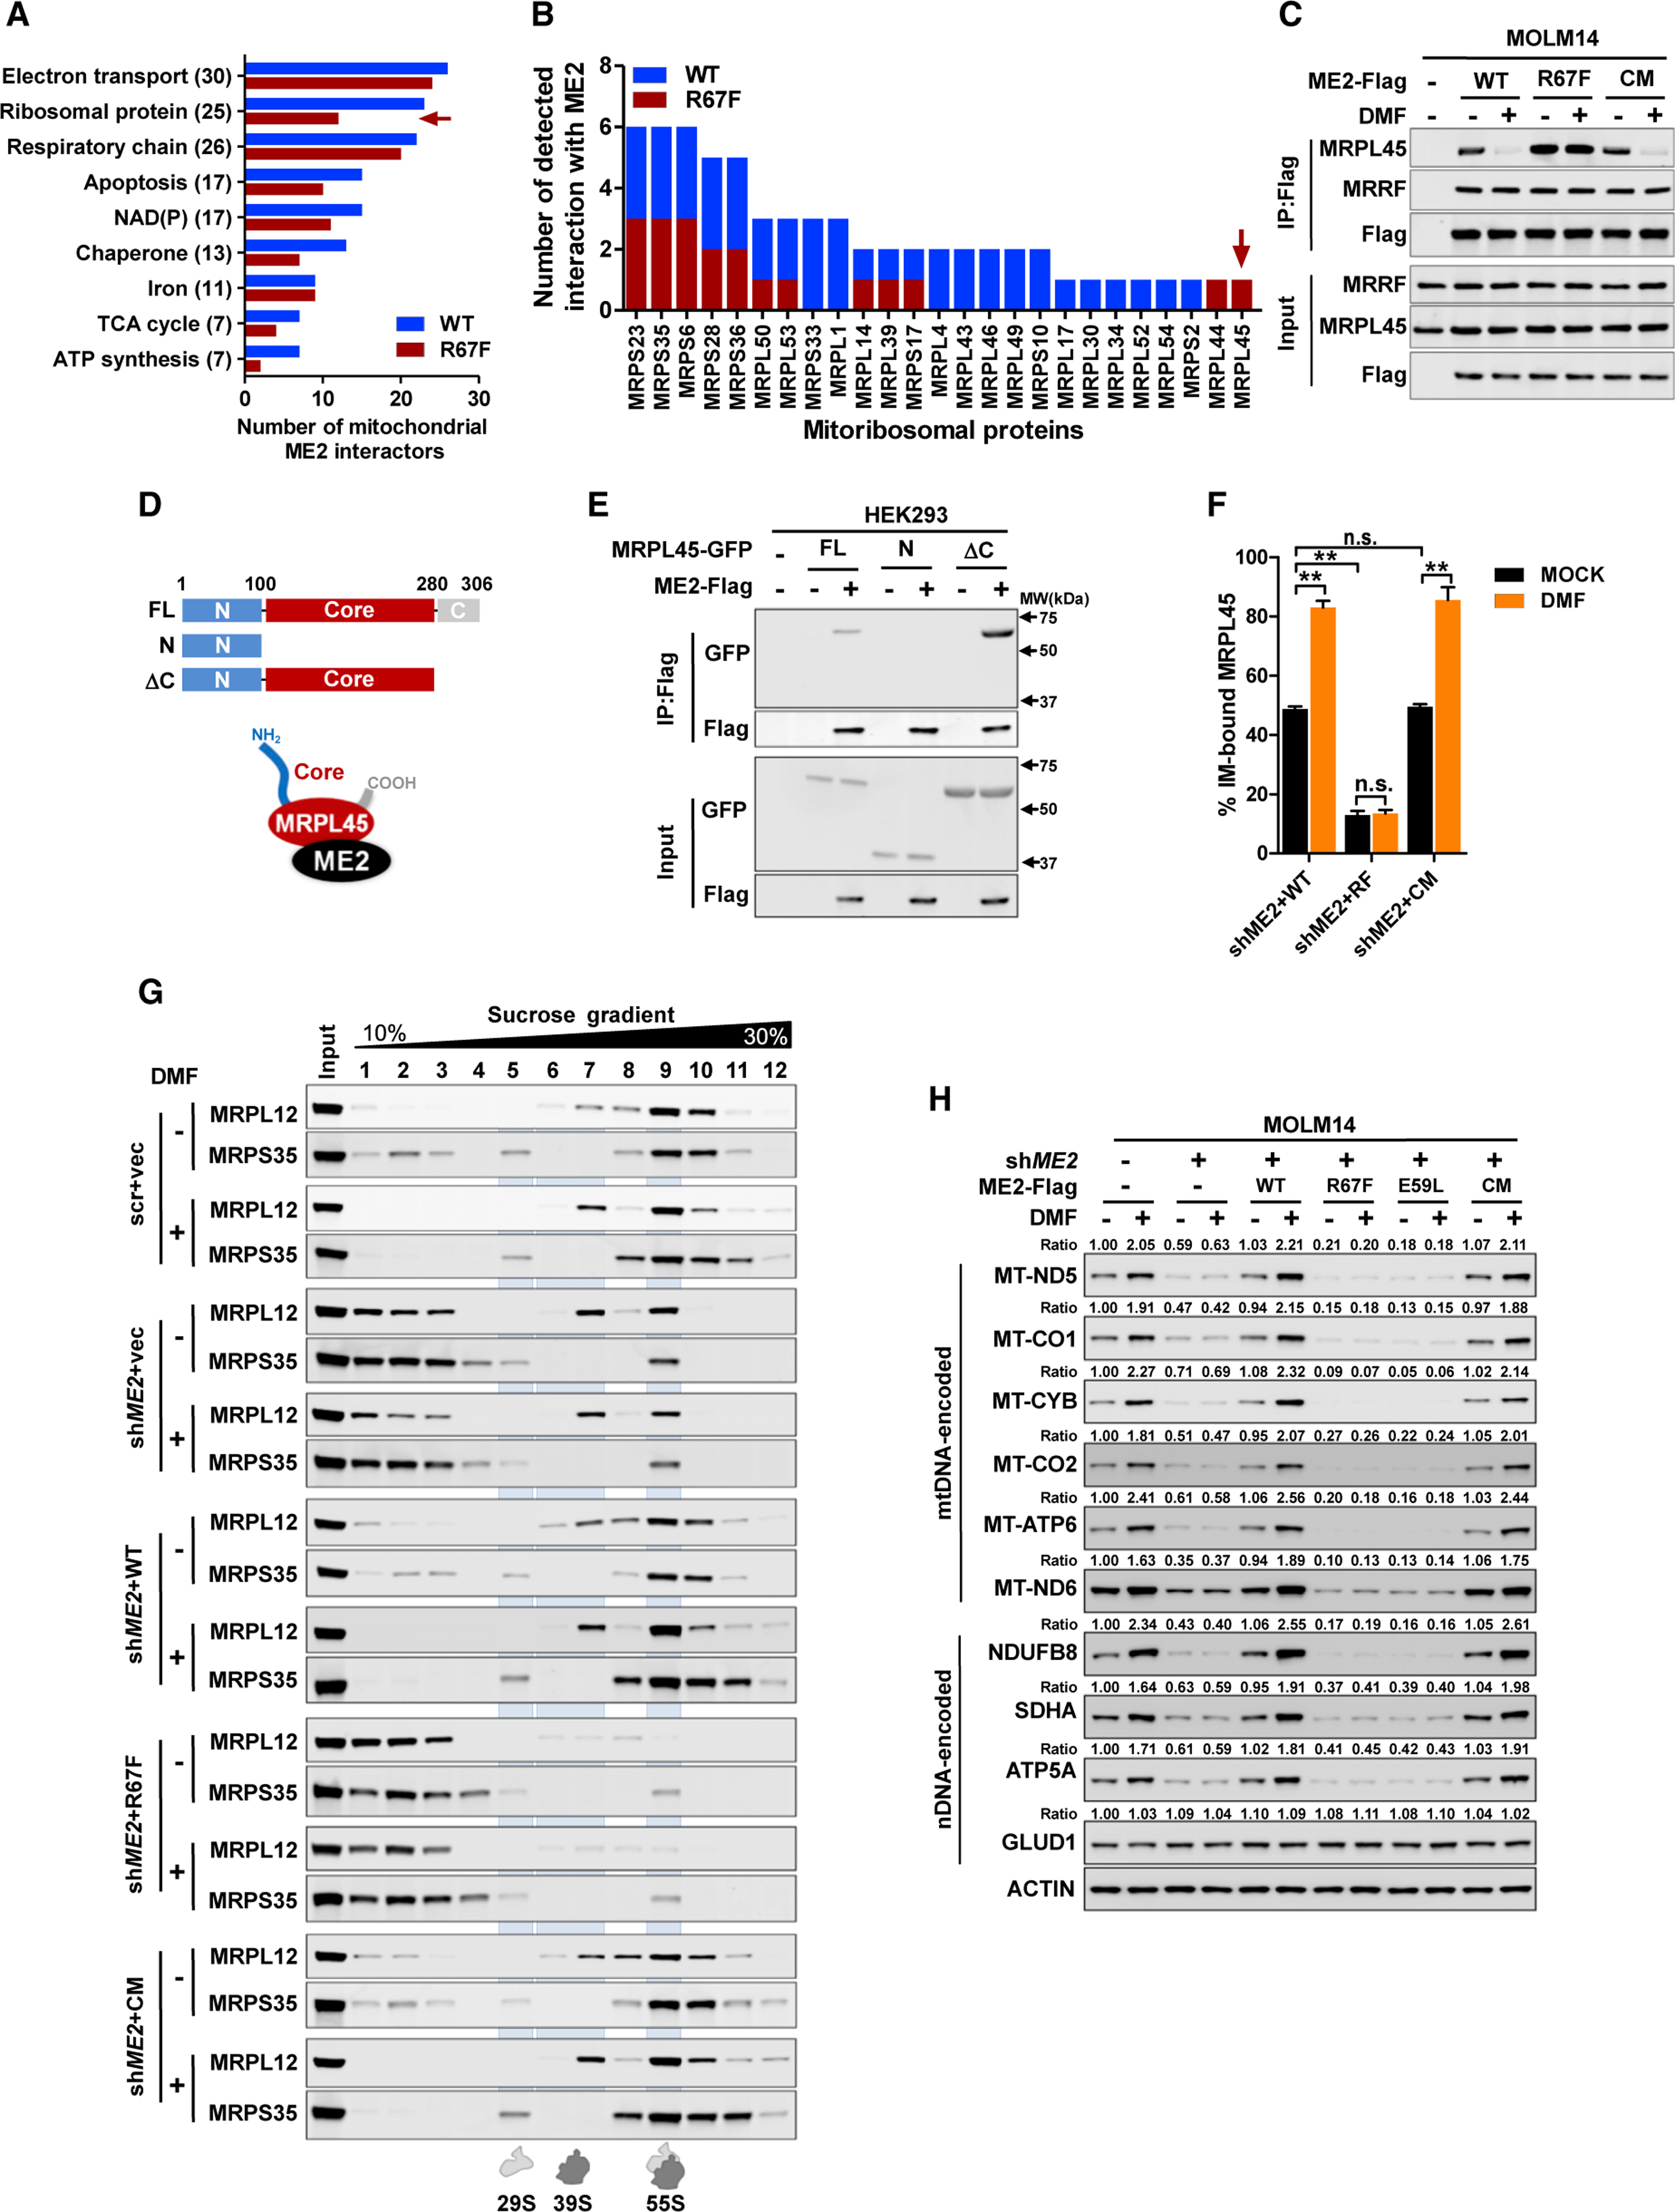
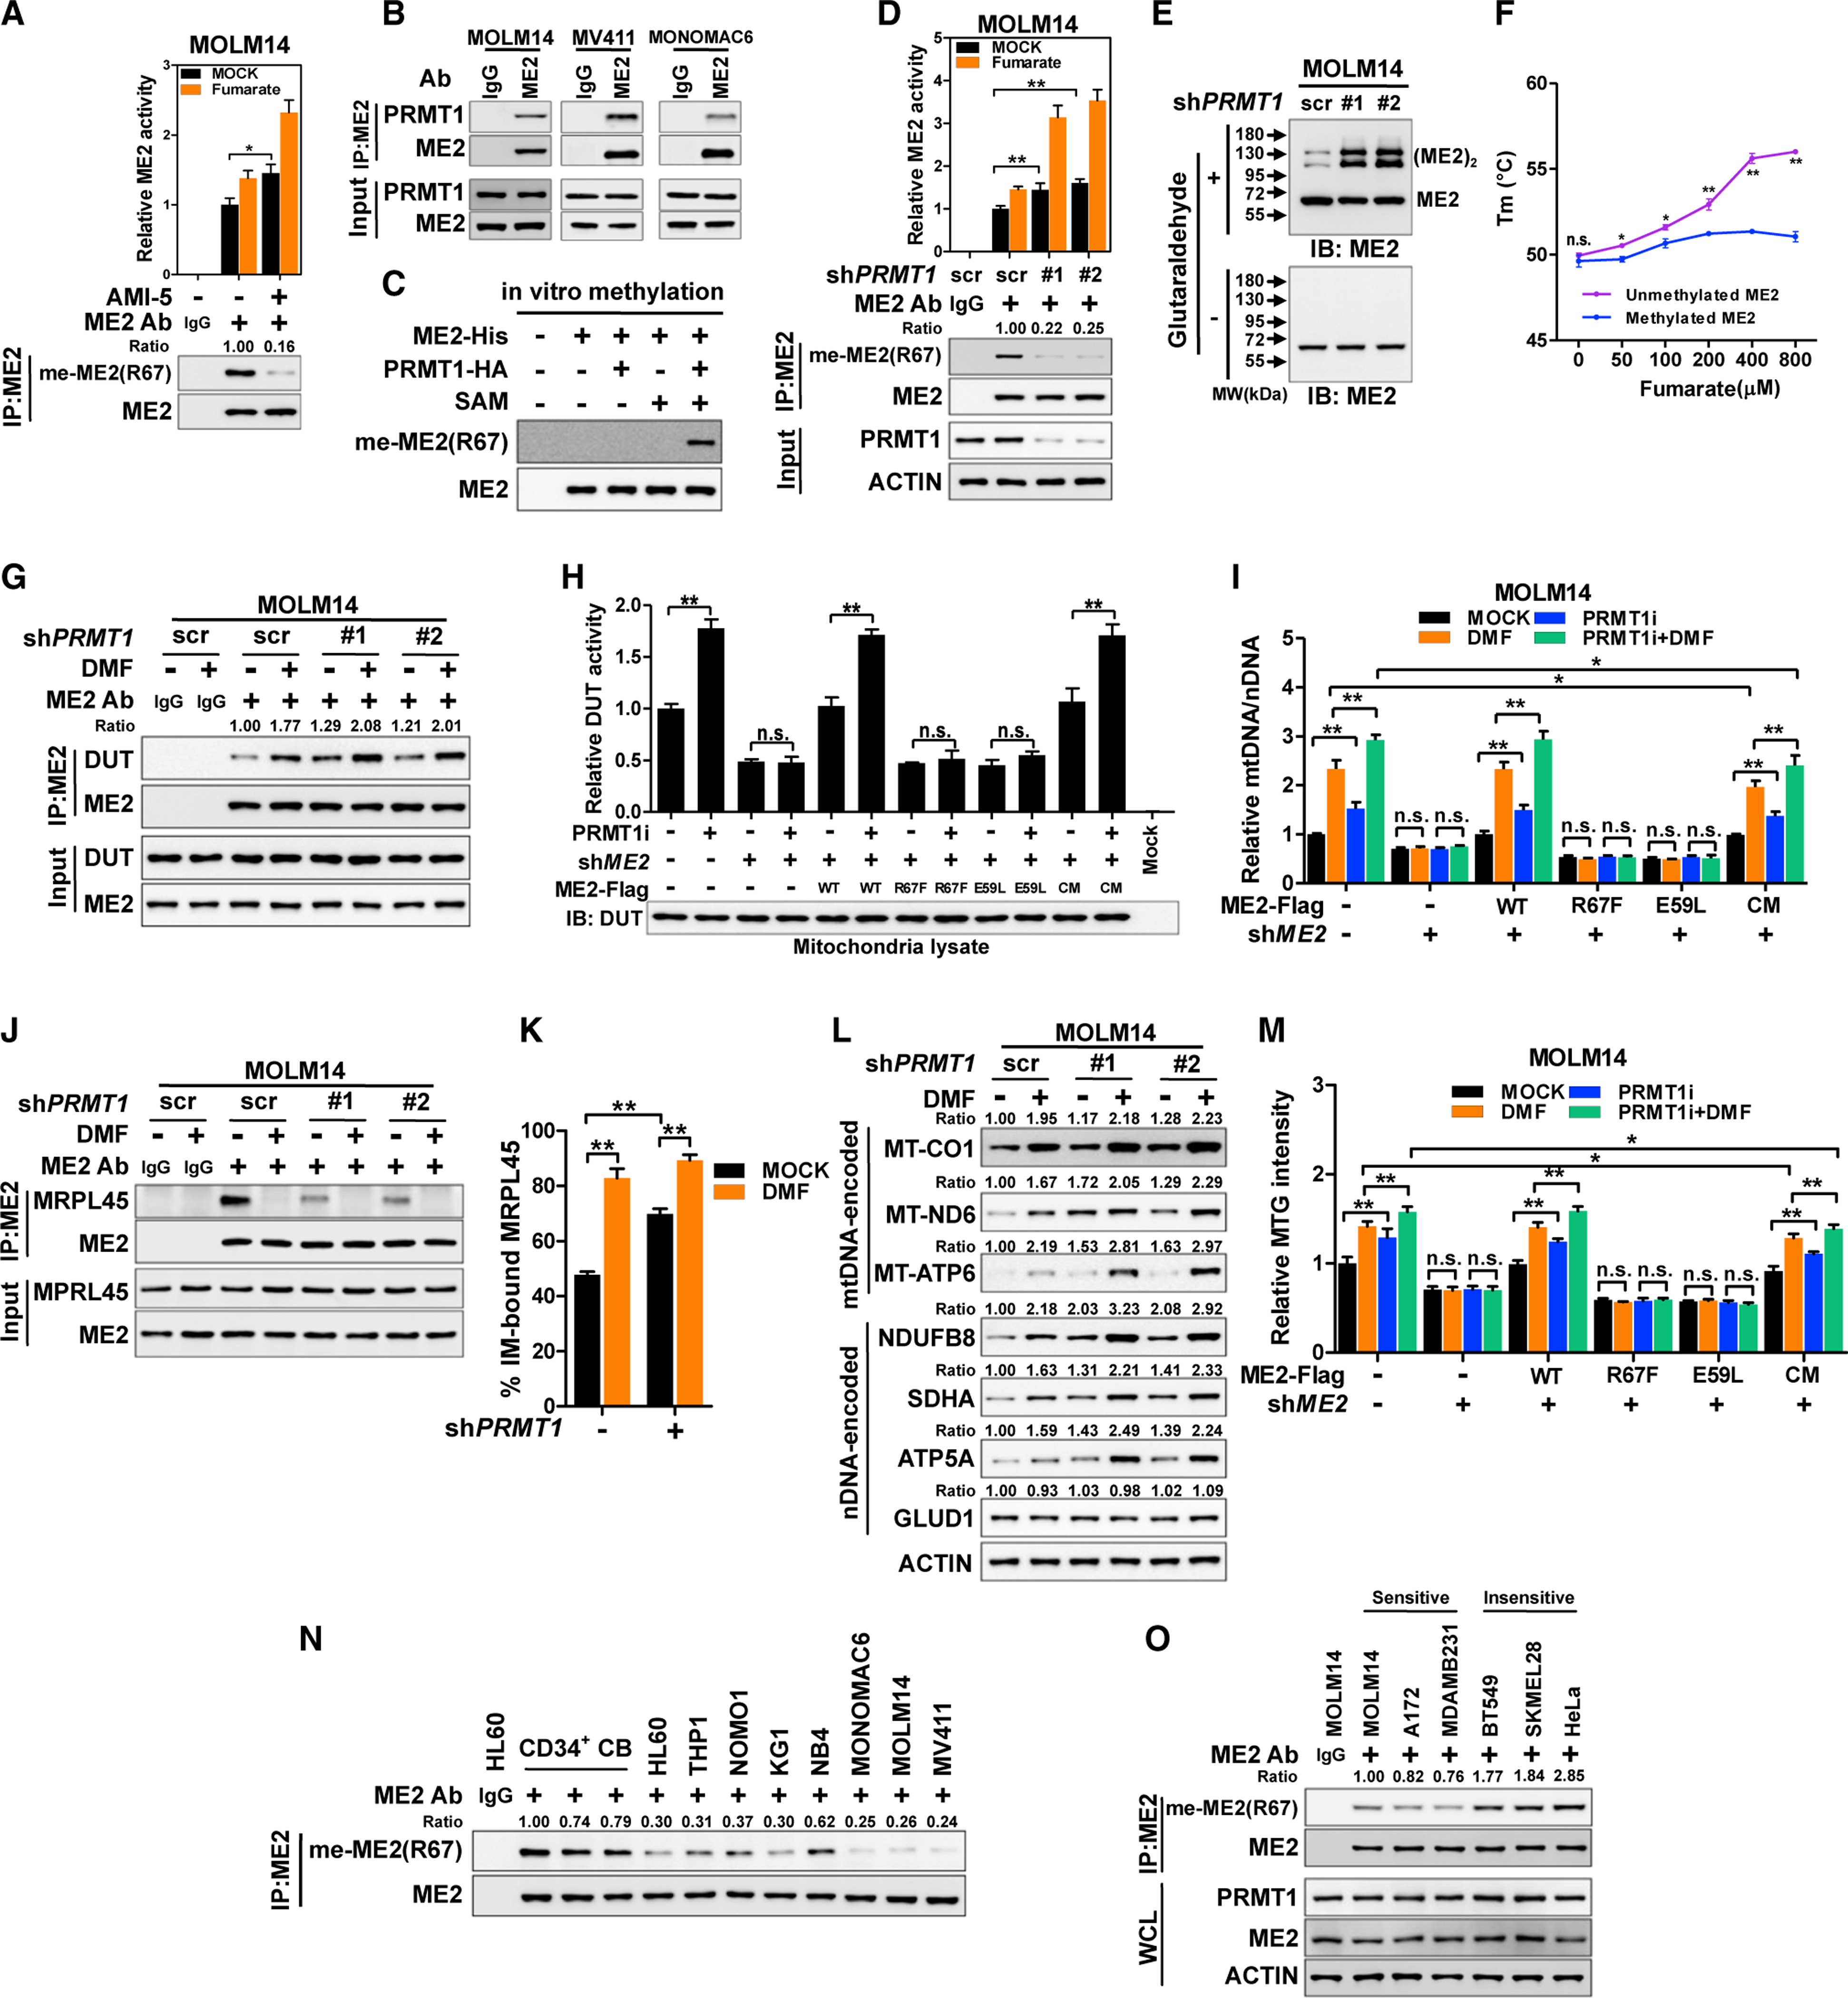
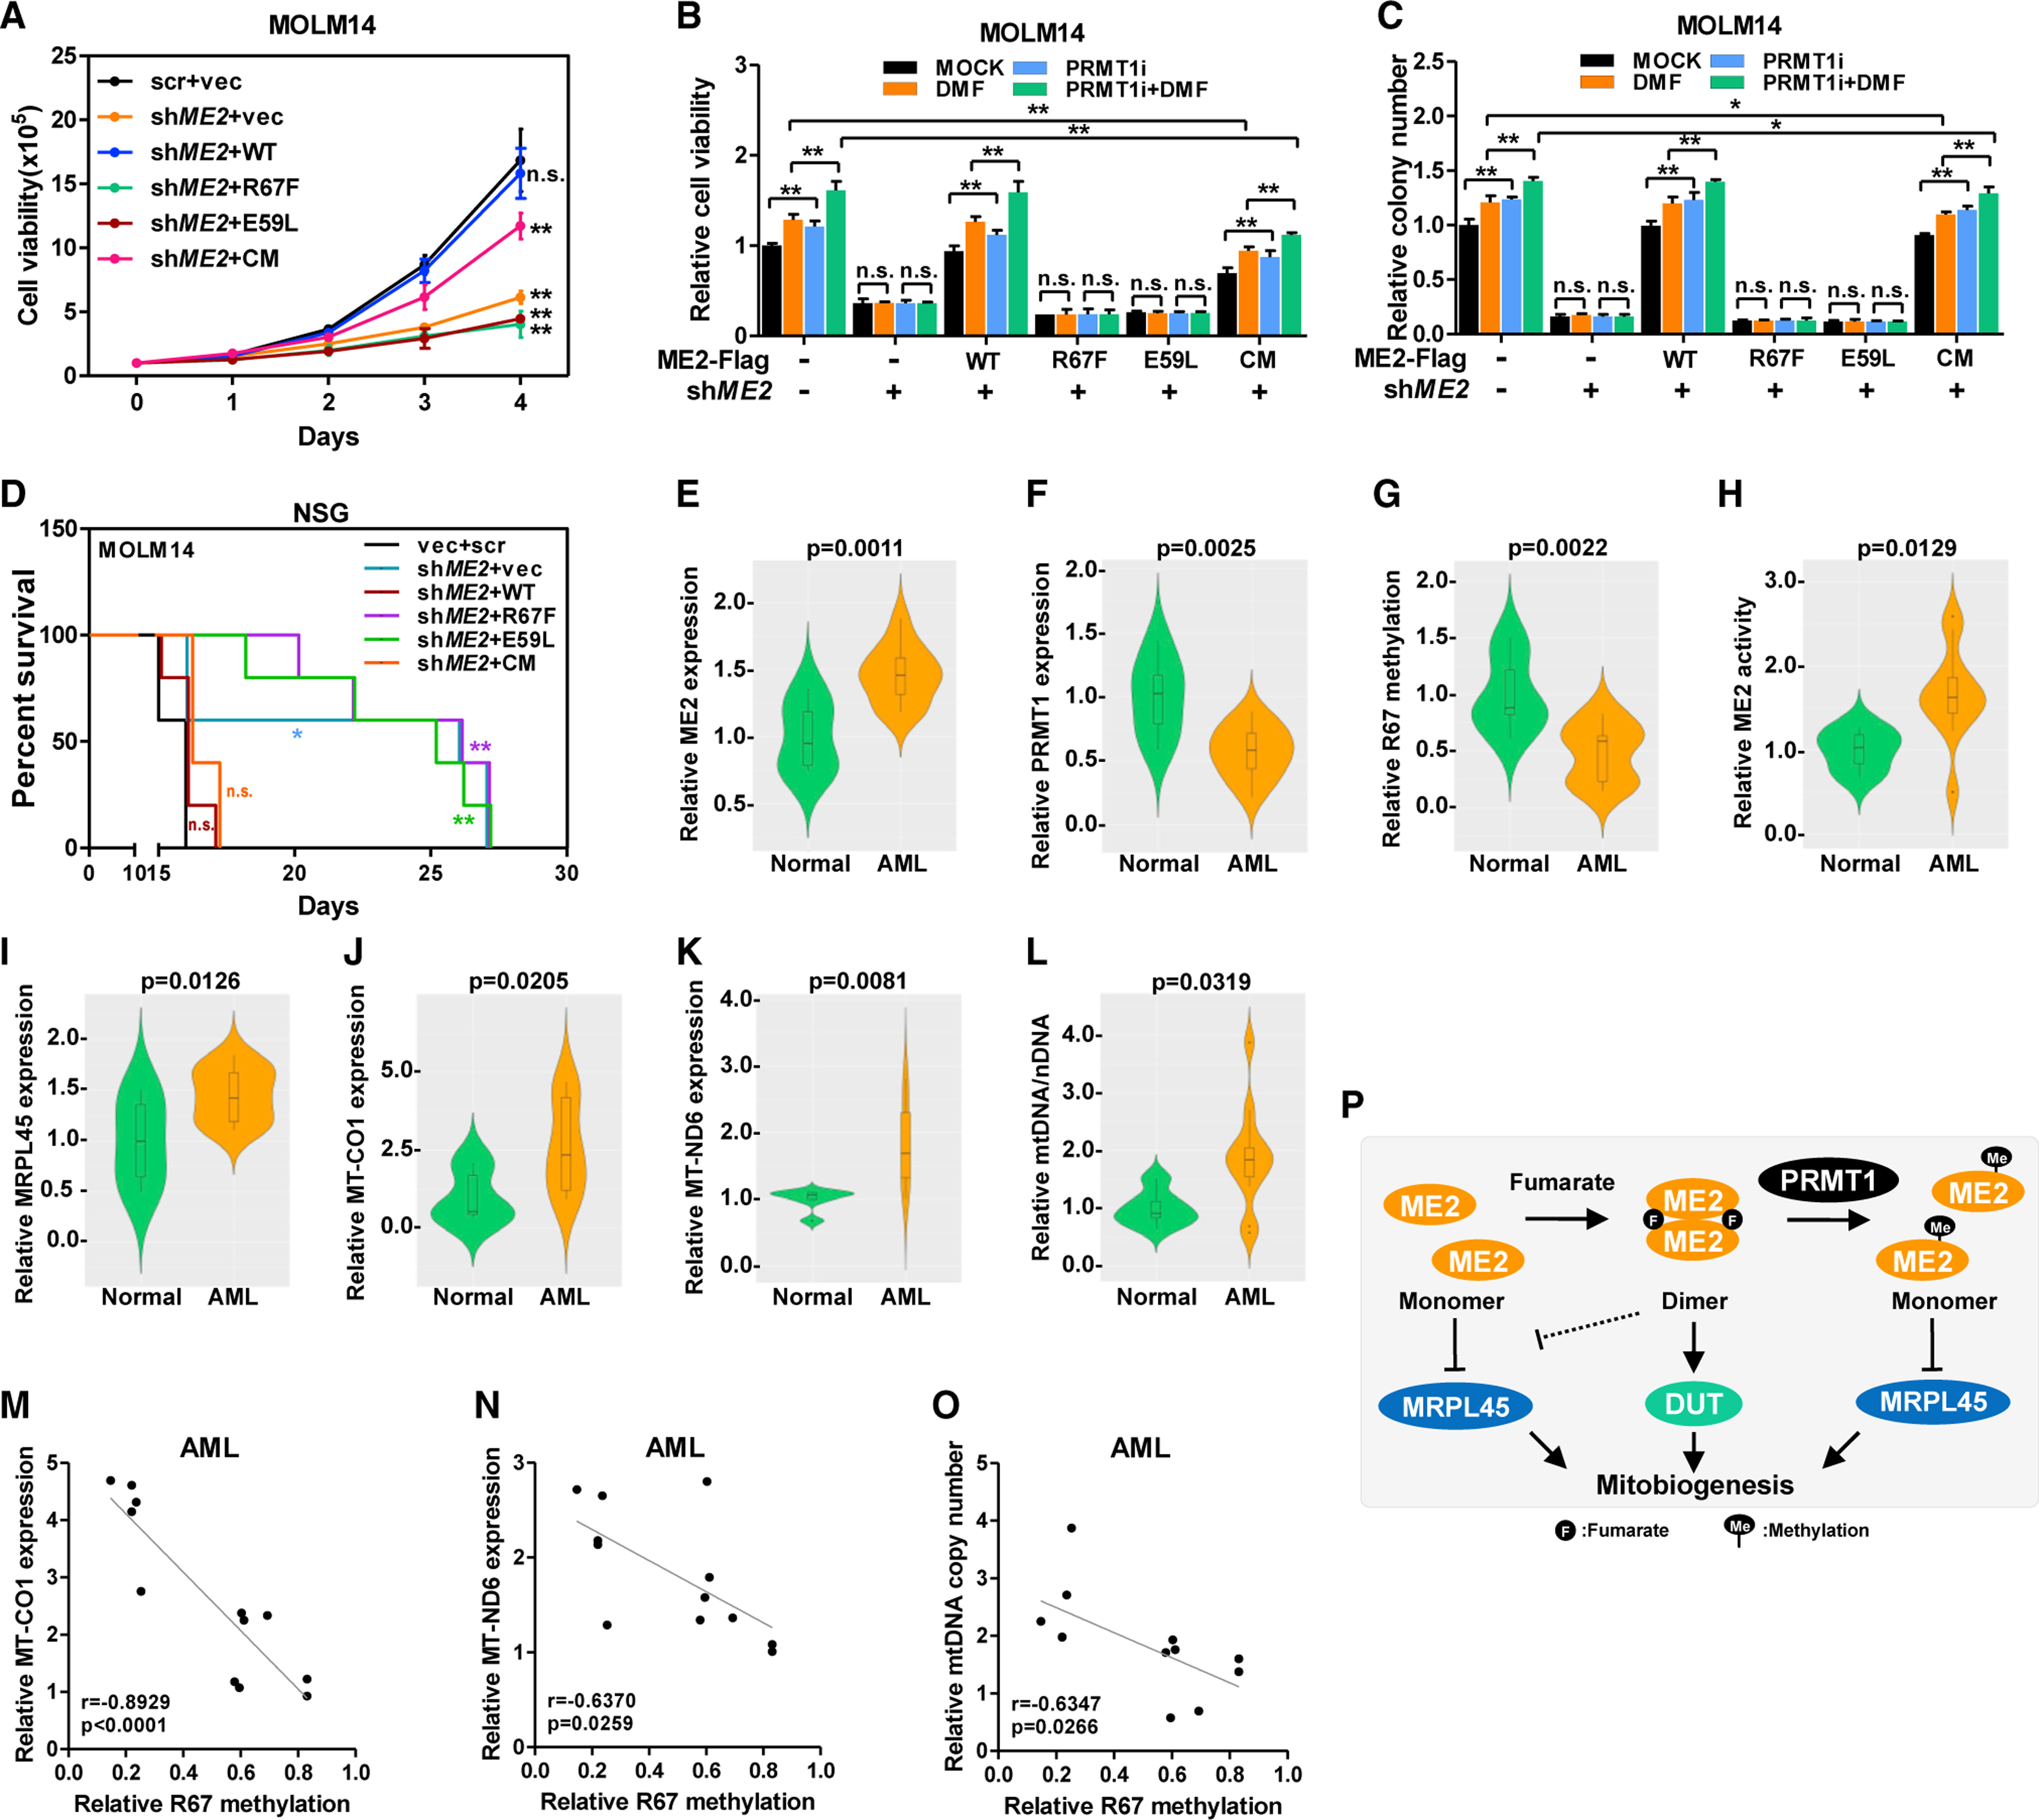
Mitochondria have an independent genome (mtDNA) and protein synthesis machinery that coordinately activate for mitochondrial generation. Here, we report that the Krebs cycle intermediate fumarate links metabolism to mitobiogenesis through binding to malic enzyme 2 (ME2). Mechanistically, fumarate binds ME2 with two complementary consequences. First, promoting the formation of ME2 dimers, which activate deoxyuridine 5'-triphosphate nucleotidohydrolase (DUT). DUT fosters thymidine generation and an increase of mtDNA. Second, fumarate-induced ME2 dimers abrogate ME2 monomer binding to mitochondrial ribosome protein L45, freeing it for mitoribosome assembly and mtDNA-encoded protein production. Methylation of the ME2-fumarate binding site by protein arginine methyltransferase-1 inhibits fumarate signaling to constrain mitobiogenesis. Notably, acute myeloid leukemia is highly dependent on mitochondrial function and is sensitive to targeting of the fumarate-ME2 axis. Therefore, mitobiogenesis can be manipulated in normal and malignant cells through ME2, an unanticipated governor of mitochondrial biomass production that senses nutrient availability through fumarate.

Keywords: acute myeloid leukemia; arginine methylation; deoxyuridine 5′-triphosphate nucleotidohydrolase; fumarate; malic enzyme 2; mitobiogenesis; mitochondrial ribosome; mitochondrial ribosome protein L45; protein arginine methyltransferase 1.


Conflict of interest statement

Declaration of interests D.T.S. declares the following competing interests: Novartis, sponsored research; Agios, director and equity holder; Editas Medicines, director and equity holder; Fate Therapeutics, founder and equity holder; Magenta Therapeutics, director, founder, equity holder, and consultant; Clear Creek Bio, director, equity holder, and consultant; LifeVaultBio, director and equity holder; Fog Pharma, consultant; VCanbio, consultant.

Figures

Figure 1.
Figure 1.. Fumarate upregulates mitochondrial biomass
(A) Human cord blood CD34+ cells and AML cell lines were treated with DMF or DEF for 24 h. mtDNA was determined by qPCR and normalized to nDNA (left). Cells were stained with MTG and the fluorescent intensity was normalized to cell number (right). All data were normalized to DMSO-treated group. The fold change (FC) was presented on a log2 scale. (B) Pearson correlation of fumarate and maximum respiration capacity (OXPHOS potential) of AML cell lines. (C and D) Control and DMF-treated MOLM14 cells were analyzed with transmission electron microscopy. Mitochondria numbers in 100 cells were counted (C). Representative images were shown in (D) (scale bar, 1 μm). (E–J) MOLM14 cells were treated with fumarate (Fum) and its esters for 24 h. Mitochondrial fumarate (E), mtDNA copies (F), MTG intensity (G), oxygen consumption rate (H), and mitochondrial ATP, NADH, and dNTPs (I) were quantified. Whole-cell lysates were subjected to western blotting; β-actin (actin) was included as the loading control (J). (K–N) Mice were injected intraperitoneally with DMSO (MOCK), MMF, or DMF for 7 days. mtDNA copies from multiple tissues were quantified (n = 5) (K). Mitochondrial proteins in the BM cells from three independent mice was determined by western blotting (L). MTG intensity (M) and oxygen consumption rate (N) of BM cells were assayed (n = 5). All data are shown as mean ± SEM from three independent experiments. *p < 0.05, **p < 0.01; n.s. indicates not significant. See also Figure S1.
Figure 2.
Figure 2.. Fumarate relies on ME2 to increase mitochondrial mass
(A) Schematic overview of fumarate-interacting enzymes. (B) Scrambled control (Scr) or shRNAs targeting fumarate-binding enzymes were stably expressed in MOLM14 cells. mtDNA was determined by qPCR after DMF treatment. (C) Schematic overview of malic enzymes in central carbon metabolism. (D and E) Human CD34+ CB cells and AML cells were transduced with control short guide RNA (sgRNA) or sgRNAs targeting malic enzymes. mtDNA abundance (left) and MTG intensity (right) were determined (D). Cells were further treated with DMF. mtDNA abundance (left) and MTG intensity (right) were assayed (E). All data were normalized to the control group. (F) A panel of solid tumor cell lines was transduced with scrambled control or shRNAs targeting ME2. mtDNA were quantified after DMF treatment. All data were normalized to the scrambled control. (G–K) Mouse BM cells were transduced with scrambled control or shRNAs targeting Me2. BM cells were transplanted (TX) into lethally irradiated mice. Twentyone days after transplantation, mice were injected intraperitoneally with DMSO (MOCK) or DMF for 7 days (G). Me2 protein (H), mtDNA abundance (I), MTG intensity (J), and oxygen consumption (K) in lin BM cells were assayed (n = 5). All data are shown as mean ± SEM from three independent experiments. *p < 0.05, **p < 0.01; n.s. indicates not significant. See also Figure S2 and Table S1.
Figure 3.
Figure 3.. ME2 responds to fumarate by increasing DUT activity and mtDNA
(A) ME2 dimer (PDB: 1PJ4) (Tao et al., 2003) was colored green and cyan on each subunit. (B) Whole-cell lysate was analyzed by crosslinking after treating MOLM14 cells with fumarate or its esters. (C) MOLM14 cells expressing ME2-Flag and its mutants were treated with DMF and subjected to crosslinking assay. (D) The oxygen consumption rate of ME2-knockdown and re-expression MOLM14 cells was determined. (E) ME2-Flag and its R67F mutant were stably expressed in MOLM14 cells. ME2-interacting proteins were identified by pull-down mass spectrometry. Shown are numbers of wild-type or mutant ME2-interacting mitochondrial proteins. (F) DUT limits dUTP and enhances dTTP synthesis. (G) Mitochondrial dUTP and dUMP were determined after treating MOLM14 cells with fumarate or its esters. (H) Mitochondrial dUTP and dUMP were quantified after treating MOLM14 cells with DMF and TAS114. (I) Endogenous ME2 was immunoprecipitated to determine its interaction with DUT and GOT2 in fumarate-treated MOLM14 cells. (J) DUT-Flag was immunopurified from MOLM14 cells and mixed with recombinant ME2 to determine its activity. (K and L) ME2-knockdown and re-expression MOLM14 cells were treated with DMF for 24 h. Mitochondria lysate was subjected to DUT activity assay (K). Mitochondrial dUTP, dUMP, and four dNTPs were quantified (L). (M) mtDNA was determined after treating MOLM14 cells with DMF and TAS114. All data are presented as mean ± SEM from three independent experiments. *p < 0.05, **p < 0.01; n.s. indicates not significant. See also Figure S3 and Table S2.
Figure 4.
Figure 4.. ME2 responds to fumarate by modulating mitoribosome assembly
(A) ME2 interactors were functionally grouped; the number on the y axis indicates total number of wild-type or mutant ME2-binding proteins. (B) ME2-interacting proteins were identified by pull-down mass spectrometry in three independent experiments. The number of detected interactions of ME2 (wild-type and R67F mutant) with mitoribosomal proteins was determined. (C) MOLM14 cells expressing ME2-Flag and its mutants were treated with DMF. The interaction of ME2 with MRPL45 and MRRF was determined. (D and E) GFP-tagged full-length MRPL45 (FL) and its mutants (N and ΔC) (D) were co-expressed with ME2-Flag to determine their association (E). (F) ME2-knockdown and re-expression MOLM14 cells were treated with DMF. Isolated mitochondria were fractionated to determine MRPL45 localization. (G and H) ME2-knockdown and re-expression MOLM14 cells were treated with DMF for 24 h. Isolated mitochondria were loaded on a sucrose gradient to fractionate mitoribosome (G). mtDNA and nDNA-encoded proteins were determined (H). All data are presented as mean ± SEM from three independent experiments. **p < 0.01; n.s. indicates not significant. See also Figure S4.
Figure 5.
Figure 5.. PRMT1 methylates ME2, inhibiting fumarate sensing
(A) R67 methylation of immunoprecipitated ME2 was determined in MOLM14 cells after AMI-5 treatment for 24 h. (B) The interaction between ME2 and PRMT1 in AML cells was assayed. (C) Recombinant ME2-His was incubated with PRMT1-HA in the presence of SAM. R67 methylation was determined. (D and E) ME2 was immunopurified from control and PRMT1-knockdown MOLM14 cells, and subjected to western blotting and enzymatic activity assay (D). Whole-cell lysate of MOLM14 cells was subjected to crosslinking assay (E). (F) The melting temperature (Tm) of unmethylated and methylated ME2 (lanes 4 and 5 in C) was determined. (G) Control and PRMT1-knockdown MOLM14 cells were treated with DMF. The interaction between ME2 and DUT was determined. (H and I) ME2-knockdown and re-expression MOLM14 cells were treated with PRMT1i for 24 h. Mitochondrial lysate was subjected to DUT activity assay (H). Stable cells were treated with PRMT1i and DMF as indicated. mtDNA was quantified (I). (J–L) Control or PRMT1-knockdown cells were treated with DMF. Interaction of ME2 and MRPL45 was assayed (J). MRPL45 protein in inner-membrane and matrix fractions was quantified (K). The expression of mtDNA and nDNA-encoded proteins was determined (L). (M) Stable MOLM14 cells were treated with PRMT1i and DMF as indicated. MTG intensity was determined. (N and O) Endogenous ME2 was immunopurified from CD34+ CB cells, AML cells (N), and representative solid tumor cell lines (O) to determine R67 methylation. Whole-cell lysate was used to detect PRMT1 and ME2 (O). All data are presented as mean ± SEM from three independent experiments. *p < 0.05, **p < 0.01; n.s. indicates not significant. See also Figure S5.
Figure 6.
Figure 6.. ME2-mediated fumarate sensing supports leukemia growth
(A–C) Growth curves of stable MOLM14 cells were determined (A). Cells were treated with PRMT1i and DMF. Cell viability was determined by cell counting after 4 days of culture (B). Colonies of MOLM14 cells were counted 7 days after treatment (C). (D) ME2-knockdown and re-expression MOLM14 cells were transplanted into sublethally irradiated NSG mice to monitor leukemia progression (n = 5). (E–O) ME2 (E) and PRMT1 (F) protein in normal and leukemic human BM samples were determined. R67 methylation of immunoprecipitated ME2 was determined (G). ME2 activity was assayed in the presence of fumarate (H). MRPL45 (I), MT-CO1 (J), and MT-ND6 (K) were quantified by western blotting. mtDNA was quantified by qPCR (L). Pearson’s correlation of ME2 protein with MT-CO1 (M), MT-ND6 (N), and mtDNA abundance (O) in AML samples was determined. (P) Working model of ME2-mediated fumarate signaling. Data are presented as mean ± SEM from three independent experiments. *p < 0.05, **p < 0.01; n.s. indicates not significant. See also Figure S6.

References

    1. Agaronyan K, Morozov YI, Anikin M, and Temiakov D (2015). Mitochondrial biology. Replication-transcription switch in human mitochondria. Science 347, 548–551. - PMC - PubMed
    1. Baccelli I, Gareau Y, Lehnertz B, Gingras S, Spinella JF, Corneau S, Mayotte N, Girard S, Frechette M, Blouin-Chagnon V, et al. (2019). Mubritinib targets the electron transport chain complex I and reveals the landscape of OXPHOS dependency in acute myeloid leukemia. Cancer Cell 36, 84–99.e8. - PubMed
    1. Bardella C, Olivero M, Lorenzato A, Geuna M, Adam J, O’Flaherty L, Rustin P, Tomlinson I, Pollard PJ, and Di Renzo MF (2012). Cells lacking the fumarase tumor suppressor are protected from apoptosis through a hypoxia-inducible factor-independent, AMPK-dependent mechanism. Mol. Cell. Biol. 32, 3081–3094. - PMC - PubMed
    1. Birsoy K, Wang T, Chen WW, Freinkman E, Abu-Remaileh M, and Sabatini DM (2015). An essential role of the mitochondrial electron transport chain in cell proliferation is to enable aspartate synthesis. Cell 162, 540–551. - PMC - PubMed
    1. Blanc RS, and Richard S (2017). Arginine methylation: the coming of age. Mol. Cell 65, 8–24. - PubMed

Publication types

MeSH terms