. 2021 May:41:101942.
doi: 10.1016/j.redox.2021.101942. Epub 2021 Mar 13.

Quiescin sulfhydryl oxidase 1 promotes sorafenib-induced ferroptosis in hepatocellular carcinoma by driving EGFR endosomal trafficking and inhibiting NRF2 activation

Affiliations

Quiescin sulfhydryl oxidase 1 promotes sorafenib-induced ferroptosis in hepatocellular carcinoma by driving EGFR endosomal trafficking and inhibiting NRF2 activation

Jialei Sun et al. Redox Biol. 2021 May.

Abstract

Sorafenib is a first-line molecular-target drug for advanced hepatocellular carcinoma (HCC), but its clinical effects are still limited. In this study we identify Quiescin sulfhydryl oxidase 1 (QSOX1) acting as a cellular pro-oxidant, specifically in the context of sorafenib treatment of HCC. QSOX1 disrupts redox homoeostasis and sensitizes HCC cells to oxidative stress by inhibiting activation of the master antioxidant transcription factor NRF2. A negative correlation between QSOX1 and NRF2 expression was validated in tumor tissues from 151 HCC patients. Mechanistically, QSOX1 restrains EGF-induced EGFR activation by promoting ubiquitination-mediated degradation of EGFR and accelerating its intracellular endosomal trafficking, leading to suppression of NRF2 activity. Additionally, QSOX1 potentiates sorafenib-induced ferroptosis by suppressing NRF2 in vitro and in vivo. In conclusion, the data presented identify QSOX1 as a novel candidate target for sorafenib-based combination therapeutic strategies in HCC or other EGFR-dependent tumor types.

Keywords: Antioxidant; Ferroptosis; HCC; QSOX1; ROS.


Conflict of interest statement

The authors declare that they have no known competing financial interests or personal relationships that could have appeared to influence the work reported in this paper.

The authors declare no conflict of interest.

Figures

Image 1
Graphical abstract
Fig. 1
Fig. 1
QSOX1 disturbs cellular redox homoeostasis, impairs cellular antioxidant capacity and sensitizes HCC cells to oxidative stress. (a) GSEA plots of genes in high QSOX1 expression group compared with low QSOX1 expression group. High-rank gene sets are shown with the enrichment score, normalized enrichment score (NES) and nominal P valve. (b) NADPH/NADP+ ratio and (c) GSH/GSSH ratio were measured in the indicated cells. (d-e) Intracellular ROS of the indicated cells were stained by CM-H2DCFDA and determined by flow cytometry (FCM). (f) Mitochondrial ROS were stained by MitoSOX Red and measured by fluorescence microplate reader. The fold changes of ROS levels relative to controls were shown. (g) The cells with depolarized mitochondria are represented as the cells that have lost ΔΨm. The proportions of the cell with depolarized mitochondria in the indicated cells are shown. For NAC treatment in d, f and g, MHCC97H/QSOX1 cells were pre-treated with 100 nM NAC for 24 h before collection. (h) Total antioxidant capacity in the indicated cells was detected. (i) Cell death was determined in the indicated cell with treatment of the incremental doses of H2O2 for 24 h. All data are representative of three independent experiments with similar results and presented as the mean ± SEM. *, p < 0.05, **, p < 0.01, ***, p < 0.001. (For interpretation of the references to colour in this figure legend, the reader is referred to the Web version of this article.)
Fig. 2
Fig. 2
QSOX1 impairs antioxidant capacity of HCC cells by suppressing NRF2 activation. (a) NRF2 expression levels in the whole cell lysate from the indicated cells were assessed using Western blot. (b) The half-life of NRF2 in HCC cells with QSOX1 overexpression or knockdown was assayed. Cells were incubated with 20 μg/mL cycloheximide (CHX) and lysed at indicated time points followed by Western blot. (c) Ubiquitination of NRF2 was enhanced by QSOX1 overexpression and was attenuated by QSOX1 knockdown. The cells were lysed and immunoprecipitated with anti-NRF2 antibody followed by Western blot analysis with anti-ubiquitin antibody. (d-e) QSOX1 promoted the translocation of NRF2 from cytoplasm to nucleus in HCC cells. NRF2 location in the indicated cells was observed using fluorescent microscopy. Green: NRF2; Blue: DAPI. Scale bar: 50 μm. The NRF2 expression levels in cytoplasmic fraction and nuclear fraction from the indicated cells were analyzed using Western blot. (f) The mRNA expression of the indicated antioxidant genes targeted by NRF2 was detected with qRT-PCR in the indicated cells. The number shown in the heatmap mean the transcript levels normalized by those of cells transduced with empty vector. (g-h) Intracellular ROS, mitochondrial ROS and proportion of the cells with depolarized mitochondria were measured in the indicated cells. For SFN and AT treatment, MHCC97H/QSOX1 cells and Hep3B/shQSOX1 cells were treated with 5 μM SFN and 0.5 μM AT for 24 h before collection, respectively. All data are representative of three independent experiments with similar results and presented as the mean ± SEM. *, p < 0.05, **, p < 0.01, ***, p < 0.001. (For interpretation of the references to colour in this figure legend, the reader is referred to the Web version of this article.)
Fig. 3
Fig. 3
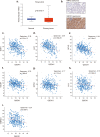
QSOX1 expression negatively correlates with NRF2 expression in HCC tissues, and in combination represent a better predictor for HCC prognosis. (a) The mRNA expression levels of QSOX1 were detected in 95-paired tumor and peritumoral tissues from HCC patients by qRT-PCR. Left: waterfall plots presented the log2-transformed fold change of QSOX1 mRNA (T/N = − [(CTQSOX1 - CTGAPDH) of HCC - (CTQSOX1 - CTGAPDH) of peritumor]). Right: paired QSOX1 mRNA expression in tumor and non-tumorous tissues was compared using paired Student's t-test. (b) The expression levels of QSOX1 in paired tumor and peritumoral tissues from 4 HCC patients was compared using Western blot. (c) Representative IHC figures of QSOX1 and NRF2 expression patterns in the indicated groups are shown. Scale bar: 500 μm. (d) QSOX1 and NRF2 expression levels in 151 paired HCC and peritumoral samples were respectively compared by Student's t-test. (e) In total 151 HCC samples, the percentages of tumor tissues with high or low NRF2 expression levels in those with high or low QSOX1 expression levels are shown, and the correlation between QSOX1 and NRF2 expression was analyzed using Pearson χ2 test. (f) High tumor NRF2 levels and (g) low tumor QSOX1 levels were significantly related to poor overall survival in HCC patients. (h) Combination of low QSOX1 and high NRF2 levels showed poor overall survival among all groups. The median IHC score of tumor QSOX1 or NRF2 levels was used as cut off for classification of high and low expression groups. **, p < 0.01.
Fig. 4
Fig. 4
QSOX1 inhibits NRF2 activation by limiting EGFR signaling. (a-b) Western blot revealed protein expression levels of EGFR, p-EGFR and NRF2 in whole cell lysate or nuclear fraction from the indicated cells. For EGF treatment, MHCC97H/QSOX1 cells were pre-treated with 100 ng/mL EGF for 24 h before collection. For gefitinib treatment, Hep3B/shQSOX1 cells were pre-treated with 10 μM gefitinib for 4 h before collection. (c-d) QSOX1 reduced EGFR protein stability after EGF stimulation in HCC cells. The indicated cells were pre-starved overnight with DMEM containing 1% FBS and then stimulated with 20 μg/mL CHX. Cells were collected at indicated time points (minute) for subsequent Western blot analysis. (e-f) QSOX1 reduced the intensity and duration of EGF-induced EGFR signaling activation. All cells were pre-starved overnight as described in (c-d) and then treated with 100 ng/mL EGF for the indicated period. The expression levels of EGFR, p-EGFR and NRF2 were determined using Western blot at the indicated time points (e left and f left) and were quantified using densitometry (e right and f right). Student's t tests were used to compare the means of two groups. All data are representative of three independent experiments with similar results and presented as the mean ± SEM. *, p < 0.05, **, p < 0.01, ***, p < 0.001.
Fig. 5
Fig. 5
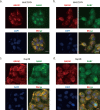
QSOX1 promotes ubiquitination of EGFR and accelerates EGF-induced EGFR endosome trafficking. (a) The ubiquitination level of EGFR in the indicated cells was analyzed. The HCC cells were incubated with or without 10 μM MG-132 for 4 h and then lysed to immunoprecipitate with anti-EGFR antibody followed by western blotting with an anti-ubiquitin antibody. (b) QSOX1 interacted with EGFR after EGF stimulation. MHCC97H and Hep3B cells were pre-starved overnight with DMEM containing 1% FBS and then incubated with or without 100 ng/mL EGF for 15 min. Cells were lysed to immunoprecipitate with anti-EGFR antibody followed by Western blot analysis with an anti-QSOX1 antibody. (c) Representative immunofluorescence staining showed co-localization of QSOX1 and EGFR in MHCC97H cells. The cells were pre-starved and treated with or without 100 ng/mL EGF. Green: EGFR. Red: QSOX1. Blue: DAPI. Scale bar: 20 μm (d-g) Immunofluorescence shows co-localization between EGFR and Rab5 or Rab7, respectively. The indicated cells were pre-starved and then stimulated with EGF as in b, followed by immunofluorescence staining at indicated time points. Cells were costained with anti-EGFR (Red) and -Rab5 (Green, d and f) or -Rab7 (Green, e and g) antibodies. The co-localization of EGFR and Rab5 or Rab7 were quantified using Mander's coefficient and results were showed in the histogram. Data from Independent 3 random fields containing at least 50 cells were presented. Scale bar: 10 μm. All data presented as the mean ± SEM.*, p < 0.05, **, p < 0.01, ***, p < 0.001. (For interpretation of the references to colour in this figure legend, the reader is referred to the Web version of this article.)
Fig. 6
Fig. 6
QSOX1 promotes sorafenib-induced ferroptosis by inhibiting NRF2 in HCC cells. (a) The indicated cells were treated with increasing doses of sorafenib for 24 h and the cell death was measured. (b) The expression of EGFR, p-EGFR and NRF2 were assayed by Western blot in the indicated cells, untreated or treated with 5 μM sorafenib for 24 h. (c) Indicated cells were treated with or without 5 μM sorafenib for 24 h in the presence of different cell death inhibitors (Fer-1: Ferrostatin-1 5 μM; DFO: Deferoxamine 50 μM; ZVAD: ZVAD-FMK 10 μM; Necro: Necrosulfonamide 1 μM). Cell death was measured using cytotoxicity LDH assay. (d) Indicated cells were untreated or treated with 5 μM sorafenib for 24 h. Cells were lysed and GSH content measured. (e-h) Indicated cells were treated without or with 5 μM sorafenib for 24 h. Cells were collected, and flow cytometry was used to detect (e-f) Fe2+ levels and (g-h) lipid peroxides. For SFN and AT treatment in d-h, 5 μM SFN and 0.5 μM AT were used for 24 h. All data are representative of three independent experiments with similar results and presented as the mean ± SEM. *, p < 0.05, **, p < 0.01, ***, p < 0.001.
Fig. 7
Fig. 7
QSOX1 improves in vivo anti-tumor activity of sorafenib via potentiation of ferroptosis. (a) BALB/c nude mice were orthotopically implanted with 5 mm3 tumor tissues formed by MHCC97H/Vector or MHCC97H/QSOX1 cells. At the 7th day following implantation, mice were administrated with 10 mg/kg sorafenib through i.p. once every other day. On the 28th day after implantation, the mice were sacrificed, and livers dissected and tumor volume was measured via caliper. (b) Representative magnetic resonance images of tumors in each group on the 28th day were shown. The representative IHC images and statistical results of (c-d) QSOX1, p-EGFR, NRF2, and cleaved caspase 3, (e) 4-HNE and (f) TFRC in tumor tissues from indicated orthotopic nude mice models are shown. Cleaved caspase 3 in all tested groups were negative. Scale bar: 100 μm. All data are presented as the mean ± SEM. *, p < 0.05, **, p < 0.01, ***, p < 0.001.
Fig. 8
Fig. 8
High tumor QSOX1 expression predicts better response to postoperative adjuvant sorafenib therapy. (a) Overall survival (OS) of HCC patients, who had received (n = 63) or not received (n = 136) adjuvant sorafenib therapy after hepatectomy, were compared using Kaplan-Mier analysis. (b-d) OS of indicated subgroups were compared using Kaplan-Mier analysis. (e) A scheme for the roles of QSOX1 on the regulation of EGFR/NRF2 signaling and sorafenib-induced ferroptosis in the context of HCC.
Fig. S1
Fig. S1
Fig. S2
Fig. S2
Fig. S3
Fig. S3
Fig. S4
Fig. S4
Fig. S5
Fig. S5
Fig. S6
Fig. S6
Fig. S7
Fig. S7
Fig. S8
Fig. S8

Similar articles

Cited by

References

    1. Bray F., Ferlay J., Soerjomataram I. Global cancer statistics 2018: GLOBOCAN estimates of incidence and mortality worldwide for 36 cancers in 185 countries. CA A Cancer J. Clin. 2018;68:394–424. doi: 10.3322/caac.21492. - DOI - PubMed
    1. Forner A., Llovet J.M., Bruix J. Hepatocellular carcinoma. Lancet. 2012;379:1245–1255. doi: 10.1016/S0140-6736(11)61347-0. - DOI - PubMed
    1. Llovet J.M., Ricci S., Mazzaferro V. Sorafenib in advanced hepatocellular carcinoma. N. Engl. J. Med. 2008;359:378–390. doi: 10.1056/NEJMoa0708857. - DOI - PubMed
    1. Kudo M., Finn R.S., Qin S. Lenvatinib versus sorafenib in first-line treatment of patients with unresectable hepatocellular carcinoma: a randomised phase 3 non-inferiority trial. Lancet. 2018;391:1163–1173. doi: 10.1016/S0140-6736(18)30207-1. - DOI - PubMed
    1. Bruix J., Qin S., Merle P. Regorafenib for patients with hepatocellular carcinoma who progressed on sorafenib treatment (RESORCE): a randomised, double-blind, placebo-controlled, phase 3 trial. Lancet. 2017;389:56–66. doi: 10.1016/S0140-6736(16)32453-9. - DOI - PubMed

Publication types