. 2021 Mar 26;19(1):19.
doi: 10.1186/s12962-021-00272-w.

Cost effectiveness of outpatient lumbar discectomy

Affiliations

Cost effectiveness of outpatient lumbar discectomy

Daniela Linhares et al. Cost Eff Resour Alloc. .

Abstract

Background: Microdiscectomy is the most commonly performed spine surgery and the first transitioning for outpatient settings. However, this transition was never studied, in what comes to cost-utility assessment. Accordingly, this economic study aims to access the cost-effectiveness of outpatient lumbar microdiscectomy when compared with the inpatient procedure.

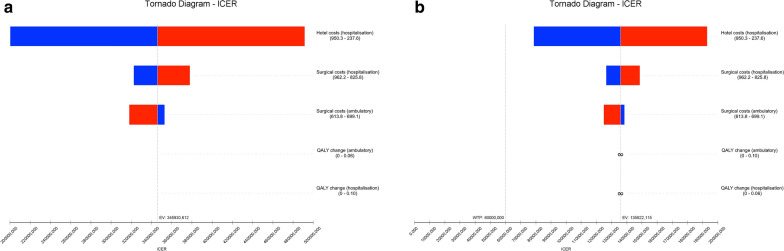
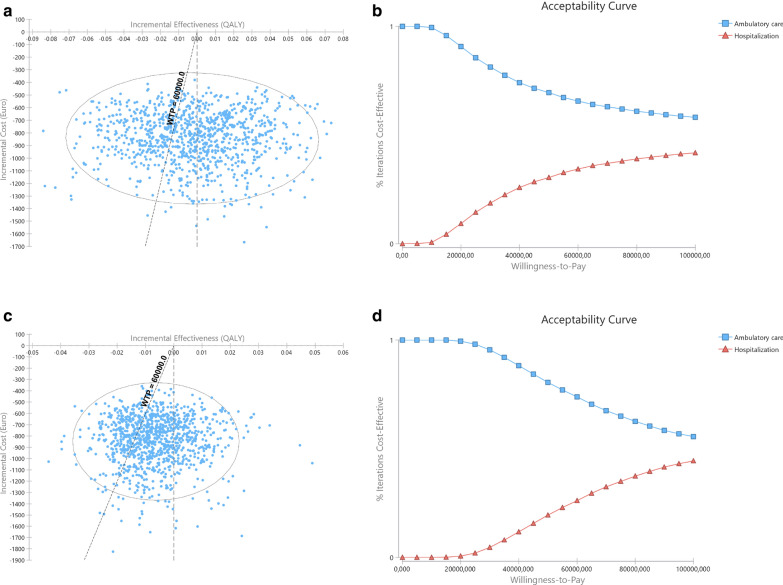
Methods: This is a cost utility study, adopting the hospital perspective. Direct medical costs were retrieved from the assessment of 20 patients undergoing outpatient lumbar microdiscectomy and 20 undergoing inpatient lumbar microdiscectomy Quality-adjusted life-years were calculated from Oswestry Disability Index values (ODI). ODI was prospectively assessed in outpatients in pre and 3- and 6-month post-operative evaluations. Inpatient ODI data were estimated from a meta-analysis. A probabilistic sensitivity analysis was performed and incremental cost-effectiveness ratio (ICER) calculated.

Results: Outpatient procedure was cost-saving in all models tested. At 3-month assessment ICER ranged from €135,753 to €345,755/QALY, higher than the predefined threshold of €60,000/QALY gained. At 6-month costs were lower and utilities were higher in outpatient, overpowering the inpatient procedure. Probabilistic sensitivity analysis showed that in 65% to 73% of simulations outpatient was the better option. The savings with outpatient were about 55% of inpatient values, with similar utility scores. No 30-day readmissions were recorded in either group.

Conclusion: This is the first economic study on cost-effectiveness of outpatient lumbar microdiscectomy, showing a significant reduction in costs, with a similar clinical outcome, proving it cost-effective.

Keywords: Cost–Benefit Analysis; Diskectomy; Economics; Intervertebral Disc Displacement; Outpatients; Patient Reported Outcome Measures.


Conflict of interest statement

The authors declare that they have no competing interests.

Figures

Fig. 1
Fig. 1
Incremental cost-effectiveness ratio (ICER) tornado diagram for one-way sensitivity analyses at 3-month assessment with inpatient costs calculated for the observed admission time. The minimum and maximum values for each input variable are presented in brackets and the dashed line represents the willingness-to-pay threshold. a Sensitivity analyses with QALYs change computed based on the area under curve approach; b Sensitivity analyses with QALYs change computed based on the change from baseline approach
Fig. 2
Fig. 2
Incremental cost-effectiveness ratio (ICER) tornado diagram for one-way sensitivity analyses at 6-month assessment with inpatient costs calculated for the observed admission time. The minimum and maximum values for each input variable are presented in brackets and the dashed line represents the willingness-to-pay threshold. a Sensitivity analyses with QALYs change computed based on the area under curve approach; b Sensitivity analyses with QALYs change computed based on the change from baseline approach
Fig. 3
Fig. 3
Results of probabilistic sensitivity analysis at 3-month assessment with inpatient costs calculated based in the observed admission time. a and b with QALYs computed based in area under curve; c and d based in change from baseline. Right (a and c): Incremental cost-effectiveness ratio scatterplots and 95% confidence interval ellipse. Each point represents a simulation, with indication of the mean incremental cost and effectiveness of outpatient compared to inpatient MD; the oblique dashed line represents the willingness-to-pay (WTP) threshold; Simulations represented to the left of the oblique dashed line (WTP line) represent those in which outpatient surgery was found to be less costly and less effective than inpatient surgery, with inpatient being the treatment of choice; Simulations to the right of the oblique dashed line (WTP line) and of the vertical line represent those in which outpatient surgery was found to be less costly and more effective than inpatient surgery with outpatient surgery being the treatment of choice. Between dashed lines are those in which outpatient was found to be less costly and less effective, but the effectiveness losses do not compensate the cost savings, and outpatient is the treatment of choice. In this model, and according to €60,000 WTP outpatient is better than inpatient in 65.2% (AUC) or 73.0% (CfB) of simulations. Left (b and d): Cost-effectiveness acceptability curve of outpatient versus inpatient. The Y-axis represents the probability of each comparator being cost-effective at a given willingness-to-pay (WTP) threshold, and ranges between 0 and 100%. Outpatient MD has been identified has cost effective throughout all different WTP thresholds depicted
Fig. 4
Fig. 4
Results of probabilistic sensitivity analysis at 6-month assessment with inpatient costs calculated based in the observed admission time. a and b with QALYs computed based in area under curve; c and d based in change from baseline. Right (a and c): Incremental cost-effectiveness ratio scatterplots and 95% confidence interval ellipse. Each point represents a simulation, with indication of the mean incremental cost and effectiveness of outpatient compared to inpatient MD; the oblique dashed line represents the willingness-to-pay (WTP) threshold; Simulations represented to the left of the oblique dashed line (WTP line) represent those in which outpatient surgery was found to be less costly and less effective than inpatient surgery, with inpatient being the treatment of choice; Simulations to the right of the oblique dashed line (WTP line) and of the vertical line represent those in which outpatient surgery was found to be less costly and more effective than inpatient surgery with outpatient surgery being the treatment of choice. Between dashed lines are those in which outpatient was found to be less costly and less effective, but the effectiveness losses do not compensate the cost savings, and outpatient is the treatment of choice. In this model, and according to €60,000 WTP outpatient is better than inpatient in 68.9% (AUC) or 71.8% (CfB) of simulations. Left (b and d): Cost-effectiveness acceptability curve of outpatient versus inpatient. The Y-axis represents the probability of each comparator being cost-effective at a given willingness-to-pay (WTP) threshold, and ranges between 0 and 100%. Outpatient MD has been identified has cost effective throughout all different WTP thresholds depicted
Fig. 5
Fig. 5
Results of probabilistic sensitivity analysis at 3-month assessment with inpatient costs calculated for one day of admission time. a and b with QALYs computed based in area under curve; c and d based in change from baseline. Right (a and c): Incremental cost-effectiveness ratio scatterplots and 95% confidence interval ellipse. Each point represents a simulation, with indication of the mean incremental cost and effectiveness of outpatient compared to inpatient MD; the oblique dashed line represents the willingness-to-pay (WTP) threshold; Simulations represented to the left of the oblique dashed line (WTP line) represent those in which outpatient surgery was found to be less costly and less effective than inpatient surgery, with inpatient being the treatment of choice; Simulations to the right of the oblique dashed line (WTP line) and of the vertical line represent those in which outpatient surgery was found to be less costly and more effective than inpatient surgery with outpatient surgery being the treatment of choice. Between dashed lines are those in which outpatient was found to be less costly and less effective, but the effectiveness losses do not compensate the cost savings, and outpatient is the treatment of choice. In this model, and according to €60,000 WTP outpatient is better than inpatient in 58.4% (AUC) or 54.4% (CfB) of simulations. Left (b and d): Cost-effectiveness acceptability curve of outpatient versus inpatient. The Y-axis represents the probability of each comparator being cost-effective at a given willingness-to-pay (WTP) threshold, and ranges between 0 and 100%. Outpatient MD has been identified has cost effective at the €60,000 WTP threshold
Fig. 6
Fig. 6
Results of probabilistic sensitivity analysis at 6-month assessment with inpatient costs calculated for one day of admission time. a and b with QALYs computed based in area under curve; c and d based in change from baseline. Right (a and c): Incremental cost-effectiveness ratio scatterplots and 95% confidence interval ellipse. Each point represents a simulation, with indication of the mean incremental cost and effectiveness of outpatient compared to inpatient MD; the oblique dashed line represents the willingness-to-pay (WTP) threshold; Simulations represented to the left of the oblique dashed line (WTP line) represent those in which outpatient surgery was found to be less costly and less effective than inpatient surgery, with inpatient being the treatment of choice; Simulations to the right of the oblique dashed line (WTP line) and of the vertical line represent those in which outpatient surgery was found to be less costly and more effective than inpatient surgery with outpatient surgery being the treatment of choice. Between dashed lines are those in which outpatient was found to be less costly and less effective, but the effectiveness losses do not compensate the cost savings, and outpatient is the treatment of choice. In this model, and according to €60,000 WTP outpatient is better than inpatient in 66.3% (AUC) or 66.4% (CfB) of simulations. Left (b and d): Cost-effectiveness acceptability curve of outpatient versus inpatient. The Y-axis represents the probability of each comparator being cost-effective at a given willingness-to-pay (WTP) threshold, and ranges between 0 and 100%. Outpatient MD has been identified has cost effective throughout all different WTP thresholds depicted

References

    1. Amin RM, Andrade NS, Neuman BJ. Lumbar disc herniation. Curr Rev Musculoskelet Med. 2017;10(4):507–516. doi: 10.1007/s12178-017-9441-4. - DOI - PMC - PubMed
    1. Martin MD, Boxell CM, Malone DG. Pathophysiology of lumbar disc degeneration: a review of the literature. Neurosurg Focus. 2002;13(2):E1. doi: 10.3171/foc.2002.13.2.2. - DOI - PubMed
    1. Hoffman RM, Wheeler KJ, Deyo RA. Surgery for herniated lumbar discs: a literature synthesis. J Gen Intern Med. 1993;8(9):487–496. doi: 10.1007/BF02600110. - DOI - PubMed
    1. Gray DT, Deyo RA, Kreuter W, Mirza SK, Heagerty PJ, Comstock BA, et al. Population-based trends in volumes and rates of ambulatory lumbar spine surgery. Spine (Phila Pa 1976). 2006;31(17):1957–63. doi: 10.1097/01.brs.0000229148.63418.c1. - DOI - PubMed
    1. Rasouli MR, Rahimi-Movaghar V, Shokraneh F, Moradi-Lakeh M, Chou R. Minimally invasive discectomy versus microdiscectomy/open discectomy for symptomatic lumbar disc herniation. Cochrane Database Syst Rev. 2014 doi: 10.1002/14651858.CD010328.pub2. - DOI - PMC - PubMed

LinkOut - more resources