Meta-Analysis
. 2021 Mar 26;22(1):90.
doi: 10.1186/s13059-021-02275-5.

Meta-analysis of genome-wide DNA methylation identifies shared associations across neurodegenerative disorders

Marta F Nabais  1   2 Simon M Laws  3 Tian Lin  1 Costanza L Vallerga  1   4 Nicola J Armstrong  5 Ian P Blair  6 John B Kwok  7 Karen A Mather  8   9 George D Mellick  10 Perminder S Sachdev  8   11 Leanne Wallace  1 Anjali K Henders  1 Ramona A J Zwamborn  12 Paul J Hop  12 Katie Lunnon  2 Ehsan Pishva  2 Janou A Y Roubroeks  2 Hilkka Soininen  13 Magda Tsolaki  14 Patrizia Mecocci  15 Simon Lovestone  16 Iwona Kłoszewska  17 Bruno Vellas  18 Australian Imaging Biomarkers and Lifestyle studyAlzheimer’s Disease Neuroimaging InitiativeSarah Furlong  19 Fleur C Garton  1 Robert D Henderson  20   21   22 Susan Mathers  23 Pamela A McCombe  21   22 Merrilee Needham  24   25   26 Shyuan T Ngo  20   21   27 Garth Nicholson  28 Roger Pamphlett  29 Dominic B Rowe  19 Frederik J Steyn  22   30 Kelly L Williams  19 Tim J Anderson  31   32 Steven R Bentley  33 John Dalrymple-Alford  31   34 Javed Fowder  10 Jacob Gratten  35   36 Glenda Halliday  37 Ian B Hickie  37 Martin Kennedy  38 Simon J G Lewis  37 Grant W Montgomery  1 John Pearson  39 Toni L Pitcher  31   32 Peter Silburn  20 Futao Zhang  1 Peter M Visscher  1 Jian Yang  1   40   41 Anna J Stevenson  42 Robert F Hillary  42 Riccardo E Marioni  42 Sarah E Harris  43 Ian J Deary  43 Ashley R Jones  44 Aleksey Shatunov  44 Alfredo Iacoangeli  44 Wouter van Rheenen  12 Leonard H van den Berg  12 Pamela J Shaw  45 Cristopher E Shaw  44 Karen E Morrison  46 Ammar Al-Chalabi  44   47 Jan H Veldink  12 Eilis Hannon  2 Jonathan Mill  2   48 Naomi R Wray  1   20 Allan F McRae  49
Affiliations
Meta-Analysis

Meta-analysis of genome-wide DNA methylation identifies shared associations across neurodegenerative disorders

Marta F Nabais et al. Genome Biol. .

Abstract

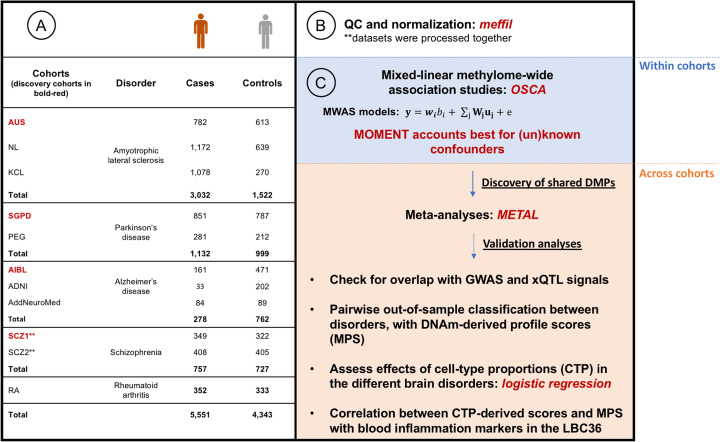
Background: People with neurodegenerative disorders show diverse clinical syndromes, genetic heterogeneity, and distinct brain pathological changes, but studies report overlap between these features. DNA methylation (DNAm) provides a way to explore this overlap and heterogeneity as it is determined by the combined effects of genetic variation and the environment. In this study, we aim to identify shared blood DNAm differences between controls and people with Alzheimer's disease, amyotrophic lateral sclerosis, and Parkinson's disease.

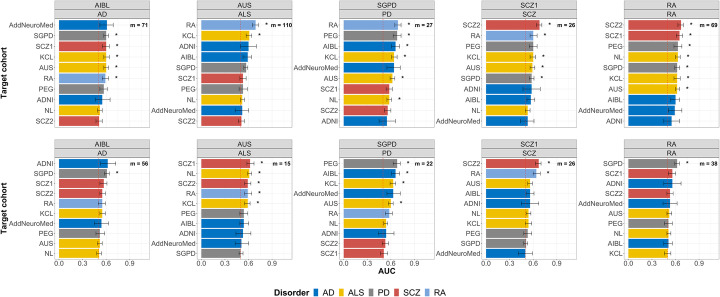
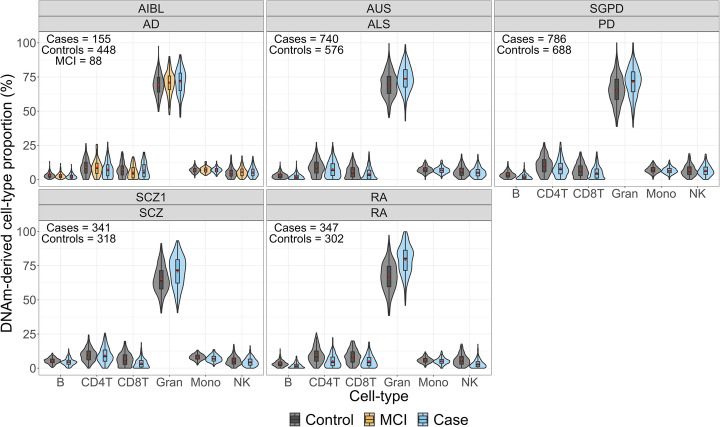
Results: We use a mixed-linear model method (MOMENT) that accounts for the effect of (un)known confounders, to test for the association of each DNAm site with each disorder. While only three probes are found to be genome-wide significant in each MOMENT association analysis of amyotrophic lateral sclerosis and Parkinson's disease (and none with Alzheimer's disease), a fixed-effects meta-analysis of the three disorders results in 12 genome-wide significant differentially methylated positions. Predicted immune cell-type proportions are disrupted across all neurodegenerative disorders. Protein inflammatory markers are correlated with profile sum-scores derived from disease-associated immune cell-type proportions in a healthy aging cohort. In contrast, they are not correlated with MOMENT DNAm-derived profile sum-scores, calculated using effect sizes of the 12 differentially methylated positions as weights.

Conclusions: We identify shared differentially methylated positions in whole blood between neurodegenerative disorders that point to shared pathogenic mechanisms. These shared differentially methylated positions may reflect causes or consequences of disease, but they are unlikely to reflect cell-type proportion differences.

Keywords: DNA methylation; Inflammatory markers; Methylation profile score; Mixed-linear models; Neurodegenerative disorders; Out-of-sample classification.


Conflict of interest statement

The authors declare that there are no competing interests.

Figures

Fig. 1
Fig. 1
Study design flowchart. (1) Whole-blood DNA methylation (DNA methylation) data was available for three amyotrophic lateral sclerosis (AUS, KCL and NL), two Parkinson’s disease (SGPD and PEG), and three Alzheimer’s disease (AIBL, ADNI and AddNeuroMed), for which a subset of individuals was diagnosed with mild cognitive impairment (MCI). The MCI patients were not included in analyses, due to lack of power. We also had available two schizophrenia (SCZ1 and SCZ2) and one rheumatoid arthritis cohorts, used to check specificity of results to neurodegenerative disorders. In total, 5551 cases and 4343 controls were available for analyses, after quality control (QC). (2) QC and normalization of DNA methylation data were conducted using the R package meffil [27], which applies an automated estimation of functional normalization parameters that reduces technical variation in DNA methylation levels, thus reducing false positive rates and improving power. (3) To discover differentially methylated positions (DMPs), we applied mixed-linear model-based association studies of DNA methylation for each of the eight available cohorts, using two different methods: MOA and MOMENT [24]. To discover DMPs shared between neurodegenerative disorders, MOMENT results were meta-analyzed, between AUS, KCL, NL, SGPD, PEG, and AIBL cohort. We also found a similar distribution pattern of predicted immune cell-type proportions (CTP) between cases and controls of all disorders. We then attempted to validate our results using out-of-sample classification between disorders—with profile scores derived from CTP and DNA methylation effect sizes—and checking for overlap with GWAS, eQTL, mQTL, and haQTL (xQTLs) signals. Finally, we investigated the relationship between the CTP and DNA methylation-derived scores and blood inflammatory markers in a healthy aging cohort (Lothian Birth Cohort 1936)
Fig. 2
Fig. 2
Manhattan (a), quantile-quantile (b) and volcano plots (c) of the MOMENT meta-analysis, of ALS, PD, and AD cohorts (Ncases = 4328, Ncontrols = 2994). The solid black lines in a and c refer to the genome-wide significant p value threshold (p = 3.30 × 10−7) and the dashed line refers to the suggestive p value threshold (p = 1 × 10−5). The dashed lines in b mark the upper and lower confidence intervals at 95%, for the p values. λ is the genomic inflation factor (the median of χ2 test-statistics of all DNA methylation sites divided by its expected value under the null)
Fig. 3
Fig. 3
Accuracy of out-of-sample classification in each target cohort, measured by the area under the curve (AUC) statistics obtained from DNA methylation profile scores (MPS), using MOA (top-row) or MOMENT (bottom-row) results at p value < 1 × 10−4, from each discovery cohort (column). AD, Alzheimer’s disease (dark blue); ALS, amyotrophic lateral sclerosis (yellow); PD, Parkinson’s disease (gray); RA, rheumatoid arthritis (light blue); SCZ, schizophrenia (red). Bars indicate 95% confidence intervals of AUC values; m = number of probes used in the classifier; stars represent p values lower than Bonferroni threshold (i.e., p < 0.05/700 tests), from logistic regression
Fig. 4
Fig. 4
Violin plots of predicted cell-type proportions (CTP) in cases and controls of each discovery cohort. ALS, amyotrophic lateral sclerosis; AD, Alzheimer’s disease; MCI, mild cognitive impairment; PD, Parkinson’s disease; RA, rheumatoid arthritis; SCZ, schizophrenia. The boxplot horizontal black line marks the median CTP value in that group. The red circle inside the boxplots marks the mean CTP value in that group. The lower and upper hinges correspond to the first and third quartiles (the 25th and 75th percentiles). The upper whisker extends from the hinge to the largest value no further than 1.5 * IQR from the hinge (where IQR is the inter-quartile range, or distance between the first and third quartiles). The lower whisker extends from the hinge to the smallest value at most 1.5 * IQR of the hinge
Fig. 5
Fig. 5
Scatterplot of TGF-alpha and disease-associated CTP-scores, real white blood cell counts, CRP-MPS, MOA-MPS, and MOMENT-MPS in the Lothian Birth Cohort 1936 (N = 823). Scatterplots and marginal histograms of TGF-alpha (rank-based inverse transform) vs disease-associated CTP-scores (dark red), real white blood cell counts (109/L, in orange), DNA methylation-derived CRP-scores (gray), MOA- (dark green), and MOMENT-MPS of meta-analyses of three neurodegenerative disorders (dark blue), which included amyotrophic lateral sclerosis, Alzheimer’s disease, and Parkinson’s disease. The red line shows the best linear fit to the data, with gray background representing the s.e.

References

    1. De Jager PL, Yang H-S, Bennett DA. Deconstructing and targeting the genomic architecture of human neurodegeneration. Nat Neurosci. 2018;21:1310–1317. doi: 10.1038/s41593-018-0240-z. - DOI - PubMed
    1. Pihlstrøm L, Wiethoff S, Houlden H. Chapter 22 - Genetics of neurodegenerative diseases: an overview. In: Kovacs GG, Alafuzoff I, editors. Handbook of Clinical Neurology. Volume 145: Elsevier; 2018. p. 309–23. 10.1016/b978-0-12-802395-2.00022-5. - PubMed
    1. Gan L, Cookson MR, Petrucelli L, La Spada AR. Converging pathways in neurodegeneration, from genetics to mechanisms. Nat Neurosci. 2018;21:1300–1309. doi: 10.1038/s41593-018-0237-7. - DOI - PMC - PubMed
    1. Armstrong RA, Lantos PL, Cairns NJ. Overlap between neurodegenerative disorders. Neuropathology. 2005;25:111–124. doi: 10.1111/j.1440-1789.2005.00605.x. - DOI - PubMed
    1. Gratten J, Visscher PM. Genetic pleiotropy in complex traits and diseases: implications for genomic medicine. Genome Med. 2016;8:78. doi: 10.1186/s13073-016-0332-x. - DOI - PMC - PubMed

Publication types