. 2021 Mar 26;13(1):47.
doi: 10.1186/s13073-021-00863-5.

Microglial PGC-1α protects against ischemic brain injury by suppressing neuroinflammation

Affiliations

Microglial PGC-1α protects against ischemic brain injury by suppressing neuroinflammation

Bin Han et al. Genome Med. .

Abstract

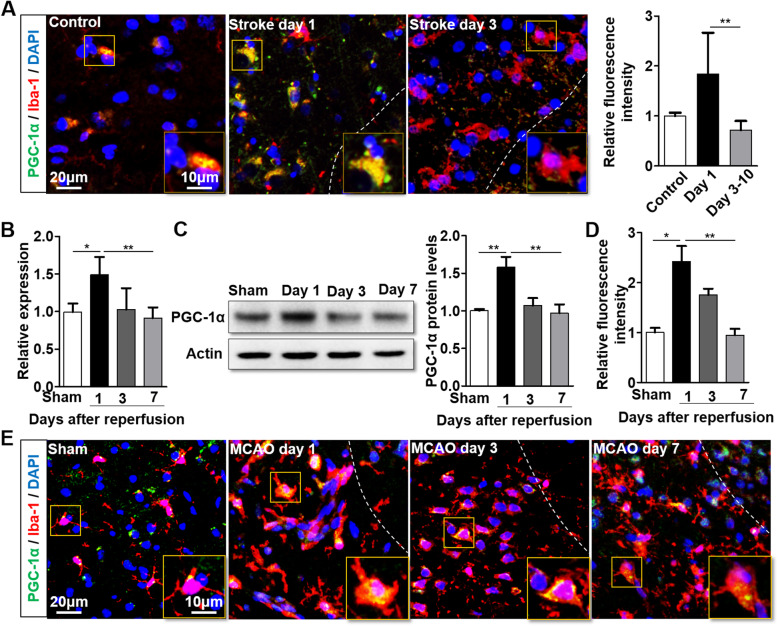
Background: Neuroinflammation and immune responses occurring minutes to hours after stroke are associated with brain injury after acute ischemic stroke (AIS). PPARγ coactivator-1α (PGC-1α), as a master coregulator of gene expression in mitochondrial biogenesis, was found to be transiently upregulated in microglia after AIS. However, the role of microglial PGC-1α in poststroke immune modulation remains unknown.

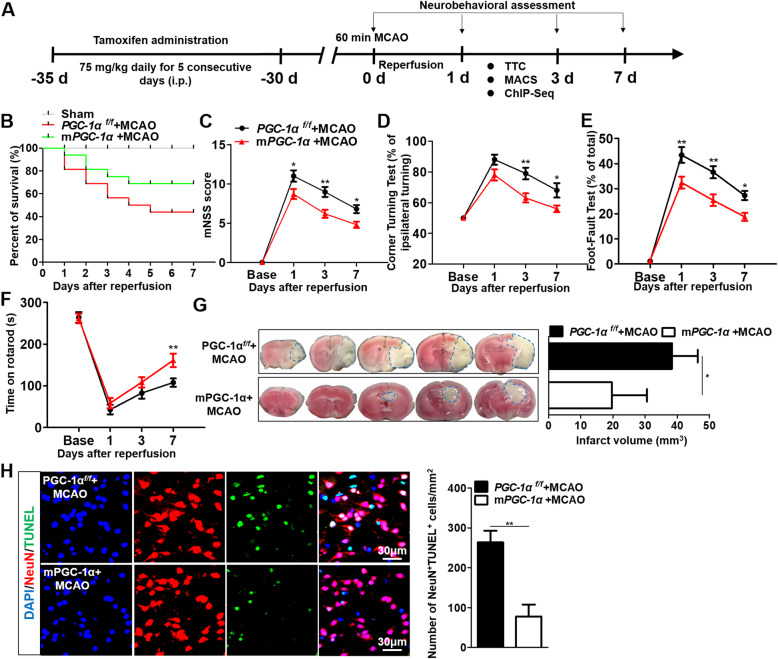
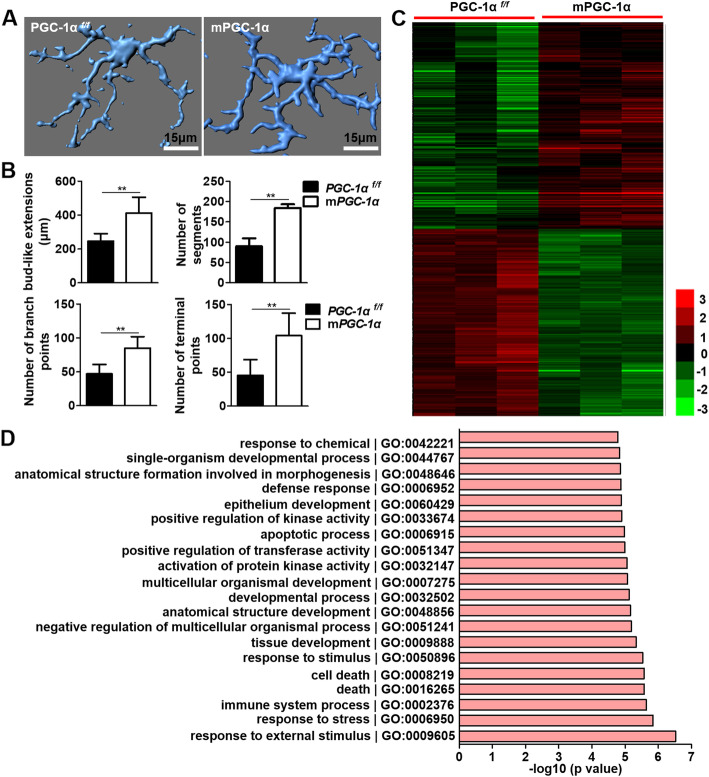
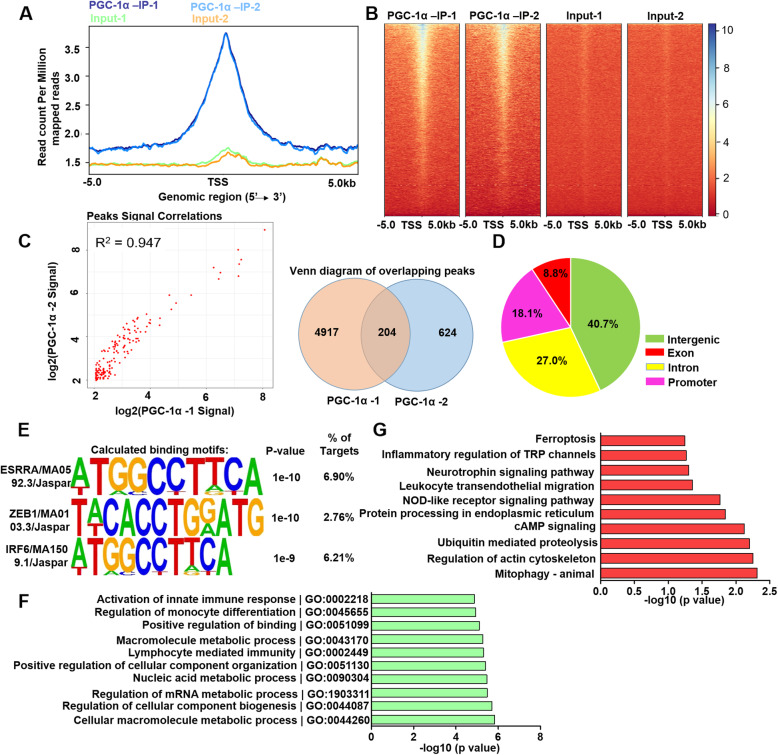
Methods: PGC-1α expression in microglia from human and mouse brain samples following ischemic stroke was first determined. Subsequently, we employed transgenic mice with microglia-specific overexpression of PGC-1α for middle cerebral artery occlusion (MCAO). The morphology and gene expression profile of microglia with PGC-1α overexpression were evaluated. Downstream inflammatory cytokine production and NLRP3 activation were also determined. ChIP-Seq analysis was performed to detect PGC-1α-binding sites in microglia. Autophagic and mitophagic activity was further monitored by immunofluorescence staining. Unc-51-like autophagy activating kinase 1 (ULK1) expression was evaluated under the PGC-1α interaction with ERRα. Finally, pharmacological inhibition and genomic knockdown of ULK1 were performed to estimate the role of ULK1 in mediating mitophagic activity after ischemic stroke.

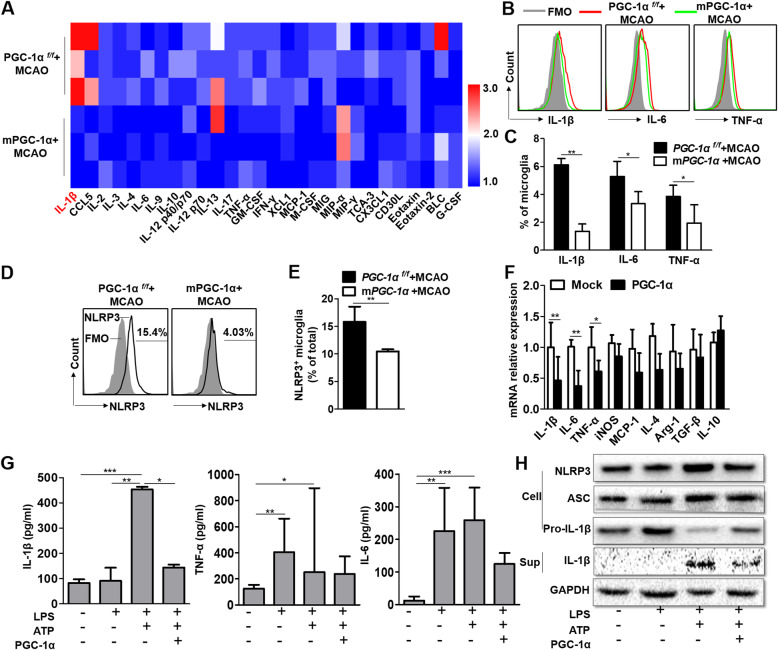
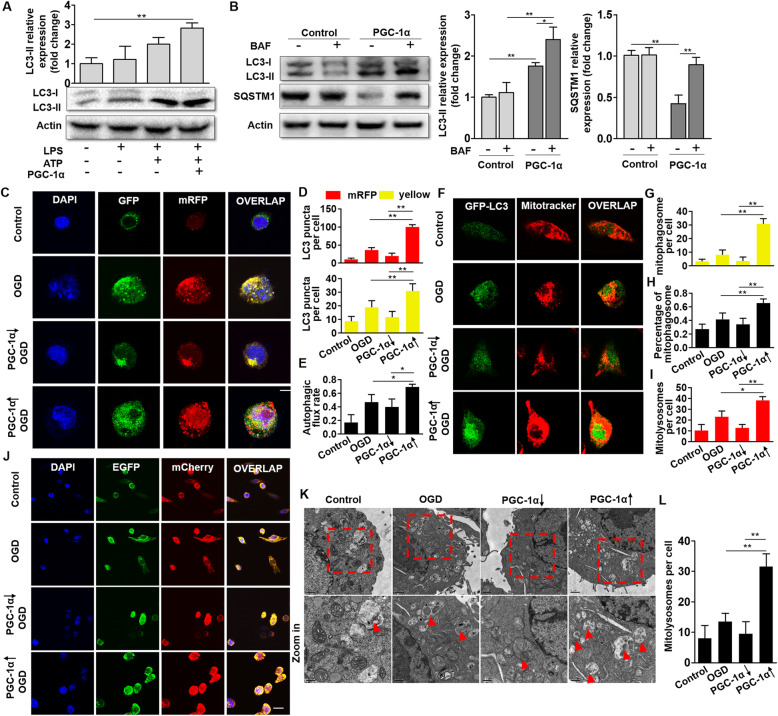
Results: PGC-1α expression was shortly increased after ischemic stroke, not only in human brain samples but also in mouse brain samples. Microglia-specific PGC-1α overexpressing mice exhibited significantly decreased neurologic deficits after ischemic injury, with reduced NLRP3 activation and proinflammatory cytokine production. ChIP-Seq analysis and KEGG pathway analysis revealed that mitophagy was significantly enhanced. PGC-1α significantly promoted autophagic flux and induced autolysosome formation. More specifically, the autophagic clearance of mitochondria was enhanced by PGC-1α regulation, indicating the important role of mitophagy. Pharmacological inhibition or knockdown of ULK1 expression impaired autophagic/mitophagic activity, thus abolishing the neuroprotective effects of PGC-1α.

Conclusions: Mechanistically, in AIS, PGC-1α promotes autophagy and mitophagy through ULK1 and reduces NLRP3 activation. Our findings indicate that microglial PGC-1α may be a promising therapeutic target for AIS.

Keywords: Ischemic stroke; Microglia; Neuroinflammation; PGC-1α.


Conflict of interest statement

The authors declare that they have no competing interests.

Figures

Fig. 1
Fig. 1
PGC-1α expression fluctuates in a time-dependent manner after ischemic stroke a Representative images showing the PGC-1α levels in microglia from ischemic stroke patients (left panel). Quantification of PGC-1α expression by ImageJ software (right panel). n = 4 per group. Determination of PGC-1α mRNA (b) and protein expression (c) in isolated microglia from mice after tMCAO. d, e Representative images and quantification of relative fluorescence intensity showing microglial PGC-1α expression in ischemic stroke mice. a, e The dashed line divides the infarction core and penumbra regions. *p < 0.05, **p < 0.01; b–e n = 6 per group
Fig. 2
Fig. 2
Microglial PGC-1α protects against ischemia-induced brain damage in mice. a The schematic of experimental protocols. b The percent survival of PGC-1αf/f and mPGC-1α mice after tMCAO. n = 16 per group. The mNSS score (c), corner-turning test (d), foot-fault test (e), and time on rotarod (f) were used to evaluate the neurological functions of motor, sensory, and balance between the PGC-1αf/f and mPGC-1α mice. n = 10 per group. g Infarct size was defined by TTC staining (left panel) and quantified using Image-Pro-Plus 6.0 software (right panel). n = 7 per group. h Analysis of neuronal apoptosis in the PGC-1αf/f and mPGC-1α mice using TUNEL staining (left panel). Quantification of TUNEL/NeuN double-positive cells using ImageJ software (right panel). *p < 0.05, **p < 0.01; n = 6 per group
Fig. 3
Fig. 3
PGC-1α enhances microglial ramification and alters gene expression profiles. a Representative images of Imaris-based three-dimensional reconstruction of Iba-1+ microglia from PGC-1αf/f and mPGC-1α mice. b Morphological features, including dendrite length, number of segments, branch points, and terminal points were quantified using Imaris. c A total of 260 upregulated and 232 downregulated genes were identified using microarray analysis of microglia. d GO analysis showed the top 20 enriched biological processes. **p < 0.01; a, b n = 5 per group, c, d n = 3 per group
Fig. 4
Fig. 4
PGC-1α attenuates neuroinflammation by suppressing NLRP3 hyperactivation. a Expression of various cytokines/chemokines in microglia by protein array analysis. b FACS analysis of IL-1β, IL-6, and TNF-α levels in microglia from the two types of mice after tMCAO. c Quantification of IL-1β, IL-6, and TNF-α levels based on FACS analysis. d FACS analysis of NLRP3 expression in microglia from the PGC-1αf/f and mPGC-1α mice at 24 h after tMCAO. e Quantification of NLRP3 expression based on FACS. f The mRNA expression of inflammatory cytokines was detected in BV2 cells after LPS stimulation for 6 h. g Quantification of IL-1β, IL-6, and TNF-α levels by ELISA. h Western blot analysis of NLRP3, ASC, and pro-IL-1β in cellular lysates and IL-1β in supernatant. *p < 0.05, **p < 0.01, ***p < 0.001; a n = 3 per group, b–e n = 6 per group, f–h n = 5–10 per group
Fig. 5
Fig. 5
Identification of genome-wide transcriptional targets of PGC-1α. a Density distribution of PGC-1α ChIP-Seq peaks. b Heat maps of PGC-1α ChIP-Seq and input signals. c The intersections between two samples were calculated. Left: A scatterplot visualizing the relationship between the two samples. Right: A Venn diagram displaying the number of overlapping and nonoverlapping peaks between the two samples. d Genomic distribution of the transcriptional targets of PGC-1α. e De novo motif enrichments identified using HOMER at the overlapping peaks. The top three identified motifs are shown. f GO analysis showed the top 10 enriched biological processes. g KEGG pathway analysis for the genes that had PGC-1α-binding peaks in their promoter regions (− 2 to 2 kb around TSS)
Fig. 6
Fig. 6
PGC-1α promotes autophagic and mitophagic activity in microglia. a Western blot analysis and quantification of the expression of the autophagy-related protein LC3 in LPS-primed BV2 cells after ATP stimulation for 3 h. b Assessment of autophagic flux in the presence or absence of the lysosomal inhibitor BAF (50 nM) and determination of LC3-II and SQSTM1 levels. c Representative images of mRFP-GFP-LC3 staining showing the autophagosome (yellow) and autolysosome (red-only) formation in the BV2 cells, with or without PGC-1α overexpression after OGD treatment. Bar: 10 μm. d Quantification of the number of yellow and red LC3 puncta. e Assessment of the autophagic flux rate. f Representative images of LC3-MitoTracker colocalization showing mitophagic events in the BV2 cells with or without PGC-1α overexpression after OGD treatment. Bar: 10 μm. g Quantification of the number of LC3-MitoTracker colocalized puncta. h Quantification of the percentage of LC3-MitoTracker colocalized puncta. i Quantification of the number of mitolysosomes. j Representative images of the formation of mitolysosomes in the BV2 cells with or without PGC-1α overexpression after OGD treatment. Bar: 20 μm. k Representative TEM images of mitolysosomes (red triangle) in the BV2 cells with or without PGC-1α overexpression after OGD treatment. Bar: 1 μm (upper panels), 0.5 μm (lower panels). l Quantification of the number of mitolysosomes. *p < 0.05, **p < 0.01; n = 6 per group

Similar articles

Cited by

References

    1. Fisher M, Saver JL. Future directions of acute ischaemic stroke therapy. Lancet Neurol. 2015;14(7):758–767. doi: 10.1016/S1474-4422(15)00054-X. - DOI - PubMed
    1. Iadecola C, Anrather J. The immunology of stroke: from mechanisms to translation. Nat Med. 2011;17(7):796–808. doi: 10.1038/nm.2399. - DOI - PMC - PubMed
    1. Fu Y, Liu Q, Anrather J, Shi FD. Immune interventions in stroke. Nat Rev Neurol. 2015;11(9):524–535. doi: 10.1038/nrneurol.2015.144. - DOI - PMC - PubMed
    1. Madry C, Kyrargyri V, Arancibia-Carcamo IL, Jolivet R, Kohsaka S, Bryan RM, et al. Microglial ramification, surveillance, and interleukin-1beta release are regulated by the two-pore domain K(+) channel THIK-1. Neuron. 2018;97(2):299–312.e6. doi: 10.1016/j.neuron.2017.12.002. - DOI - PMC - PubMed
    1. Lou N, Takano T, Pei Y, Xavier AL, Goldman SA, Nedergaard M. Purinergic receptor P2RY12-dependent microglial closure of the injured blood-brain barrier. Proc Natl Acad Sci U S A. 2016;113(4):1074–1079. doi: 10.1073/pnas.1520398113. - DOI - PMC - PubMed

Publication types

MeSH terms

Substances