. 2021 Jul;19(7):1196-1207.
doi: 10.1158/1541-7786.MCR-20-0413. Epub 2021 Mar 26.

Defects in Emerin-Nucleoskeleton Binding Disrupt Nuclear Structure and Promote Breast Cancer Cell Motility and Metastasis

Affiliations

Defects in Emerin-Nucleoskeleton Binding Disrupt Nuclear Structure and Promote Breast Cancer Cell Motility and Metastasis

Alexandra G Liddane et al. Mol Cancer Res. 2021 Jul.

Abstract

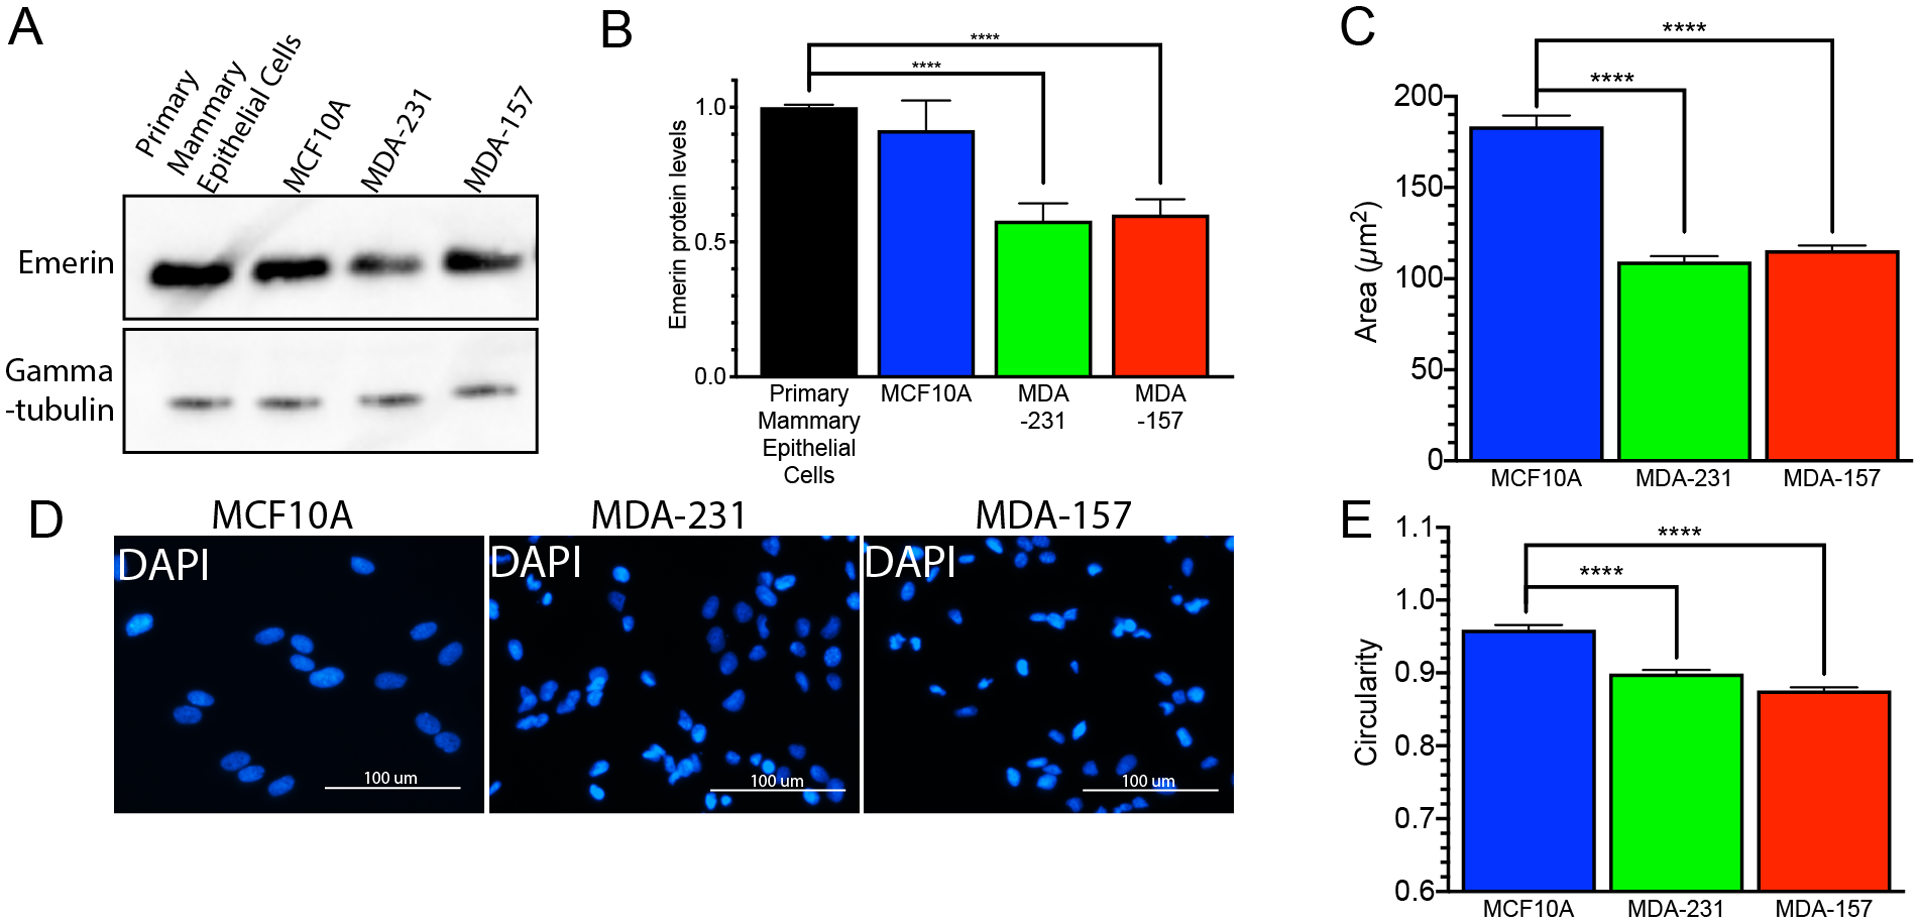
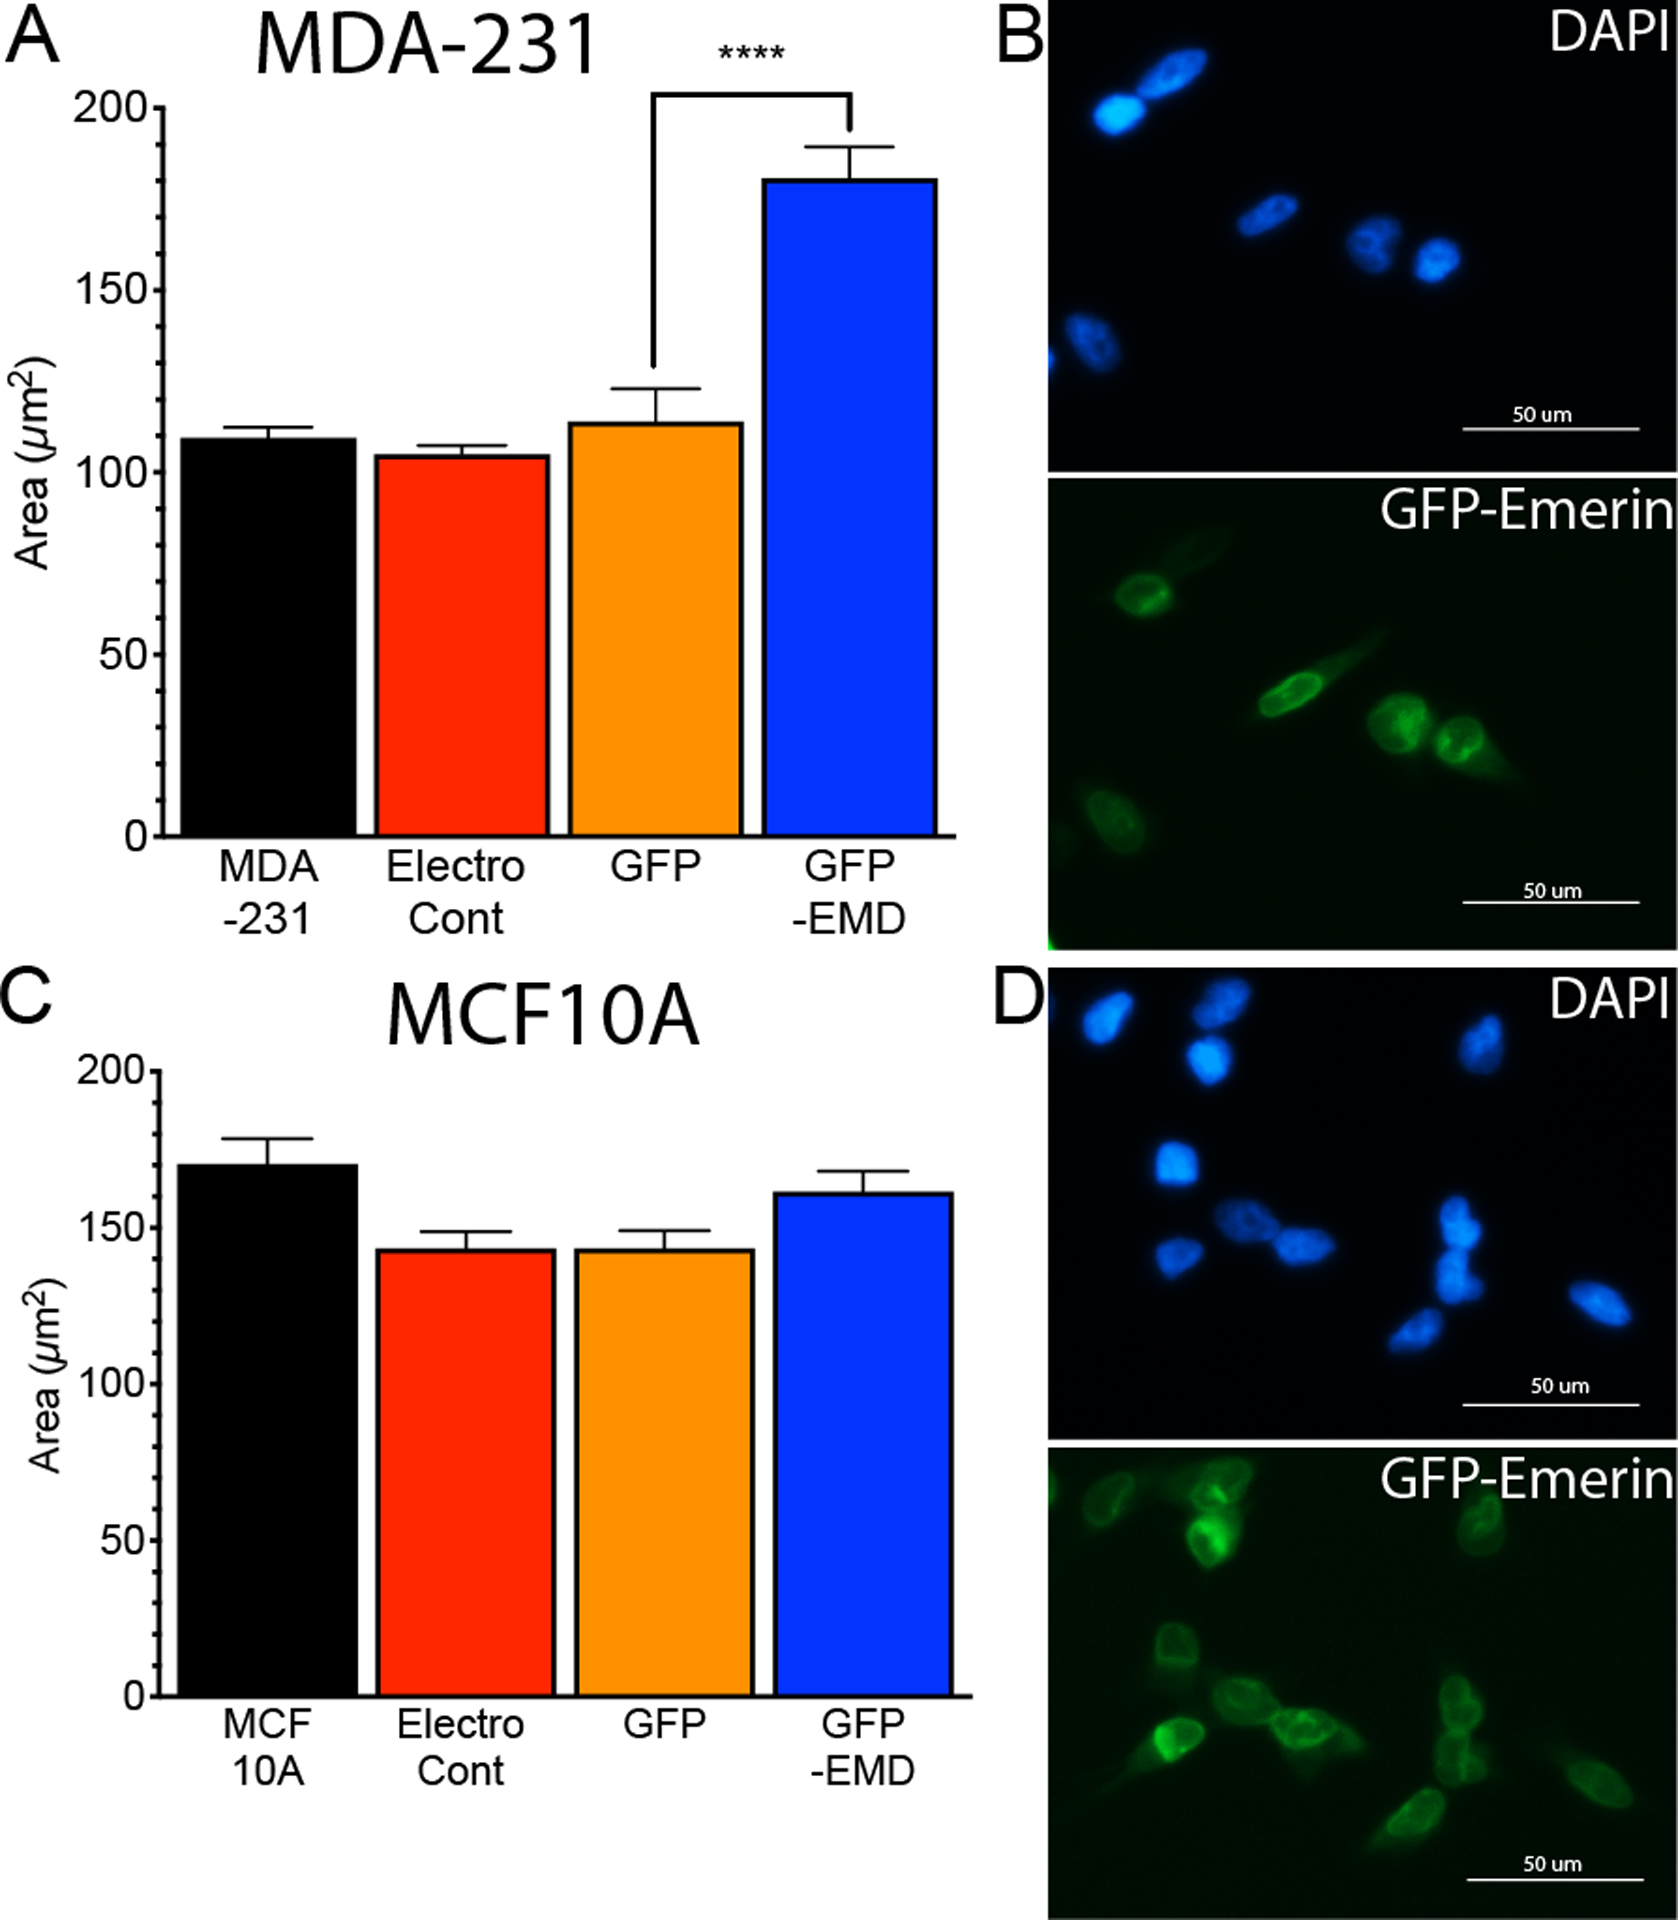
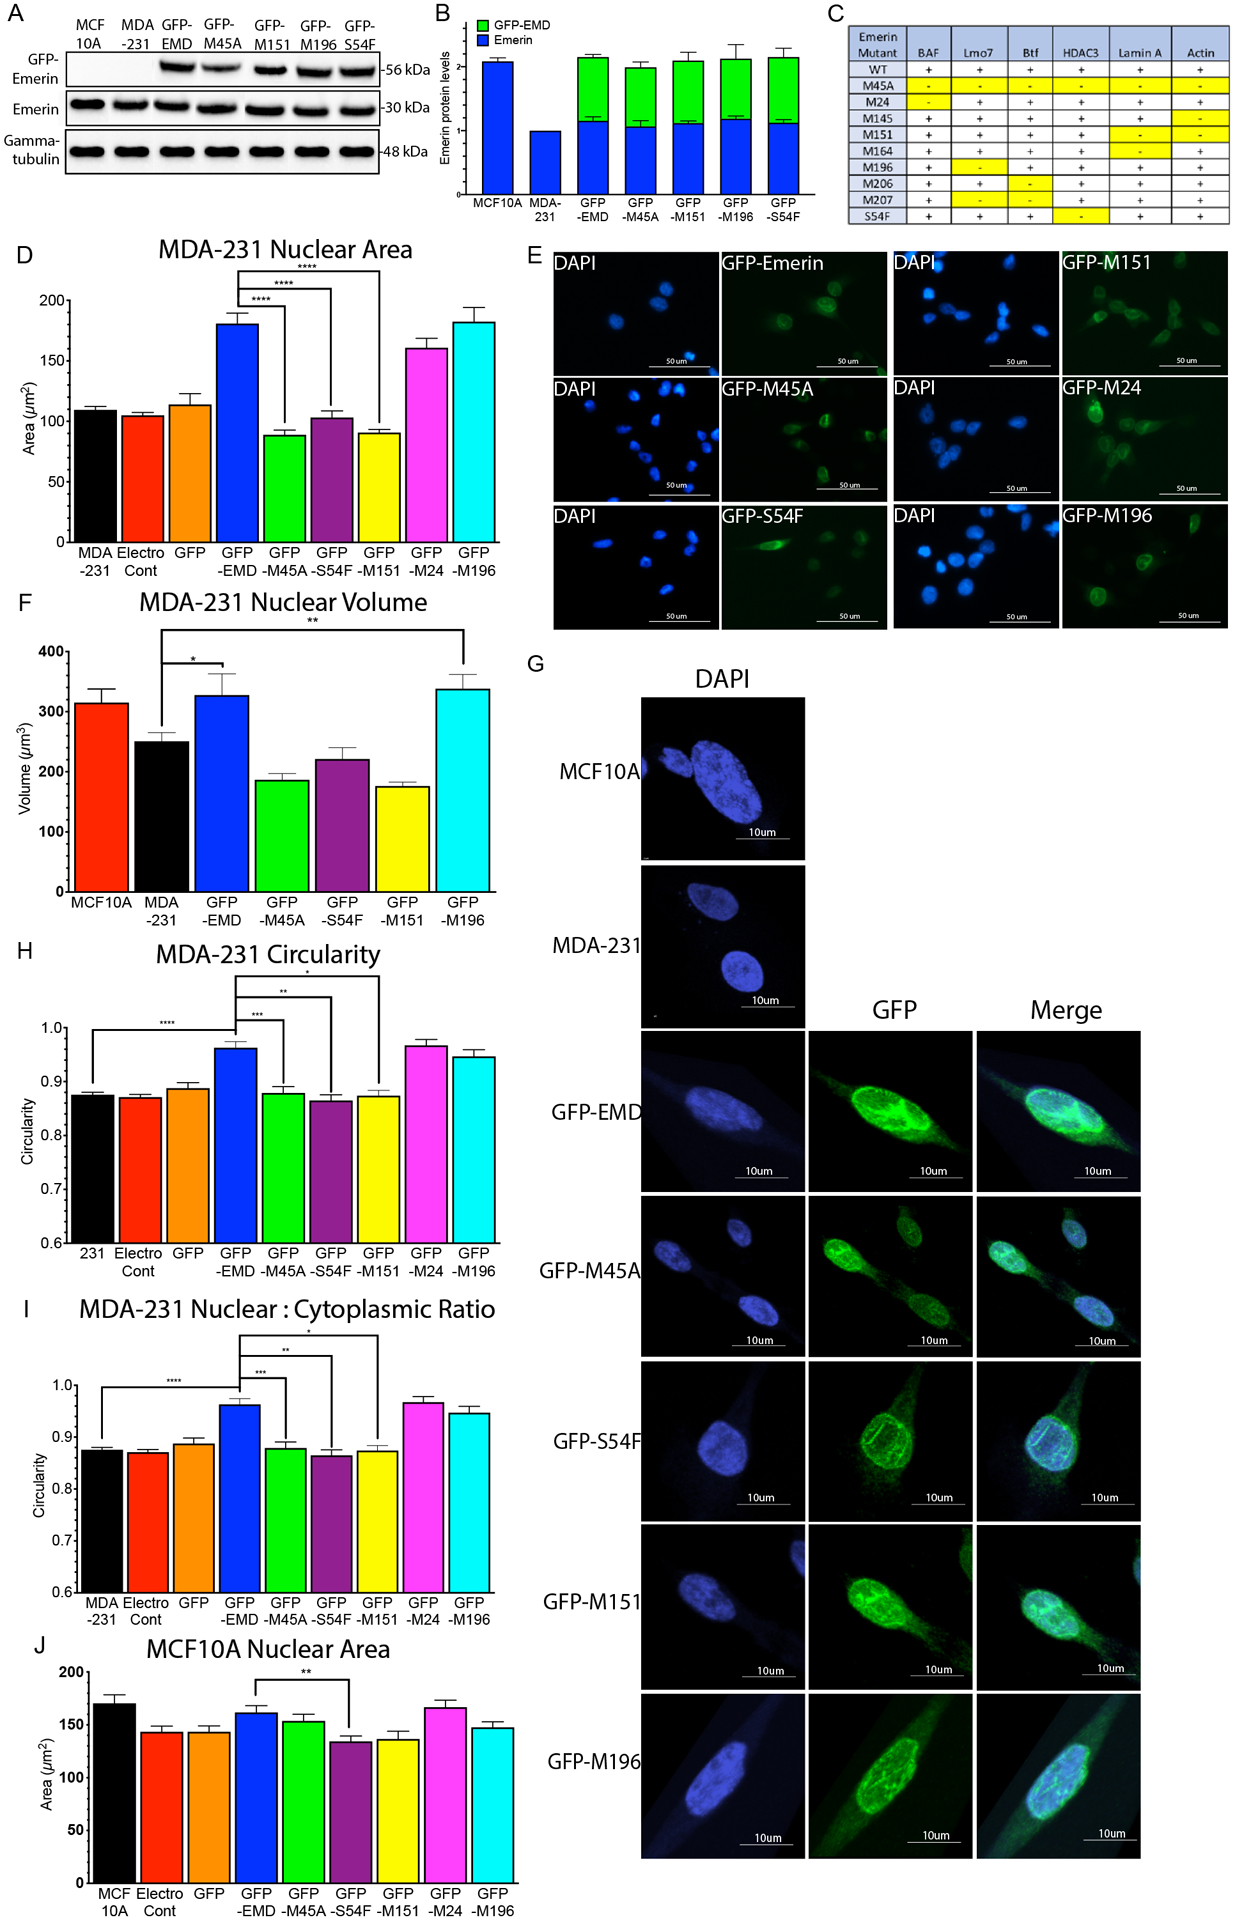
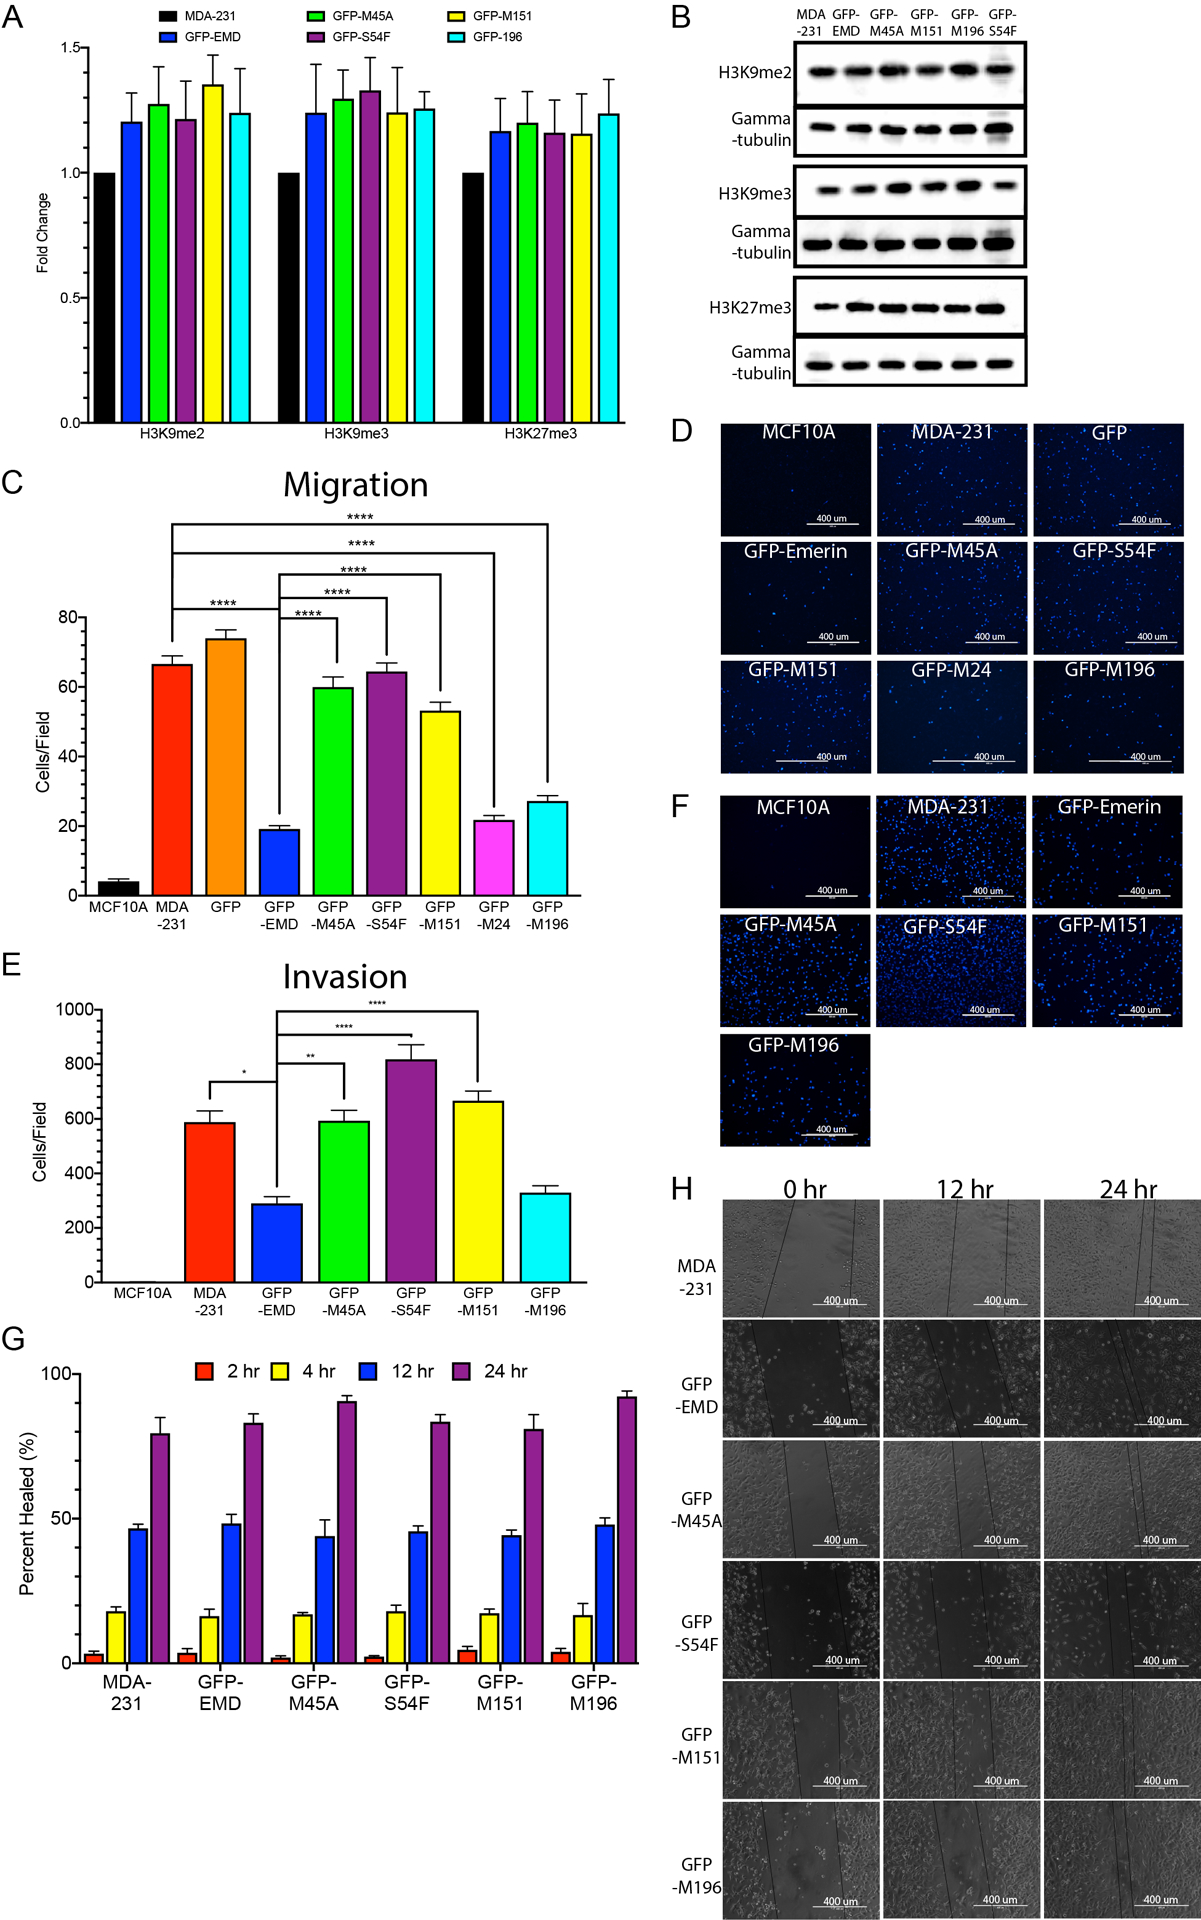
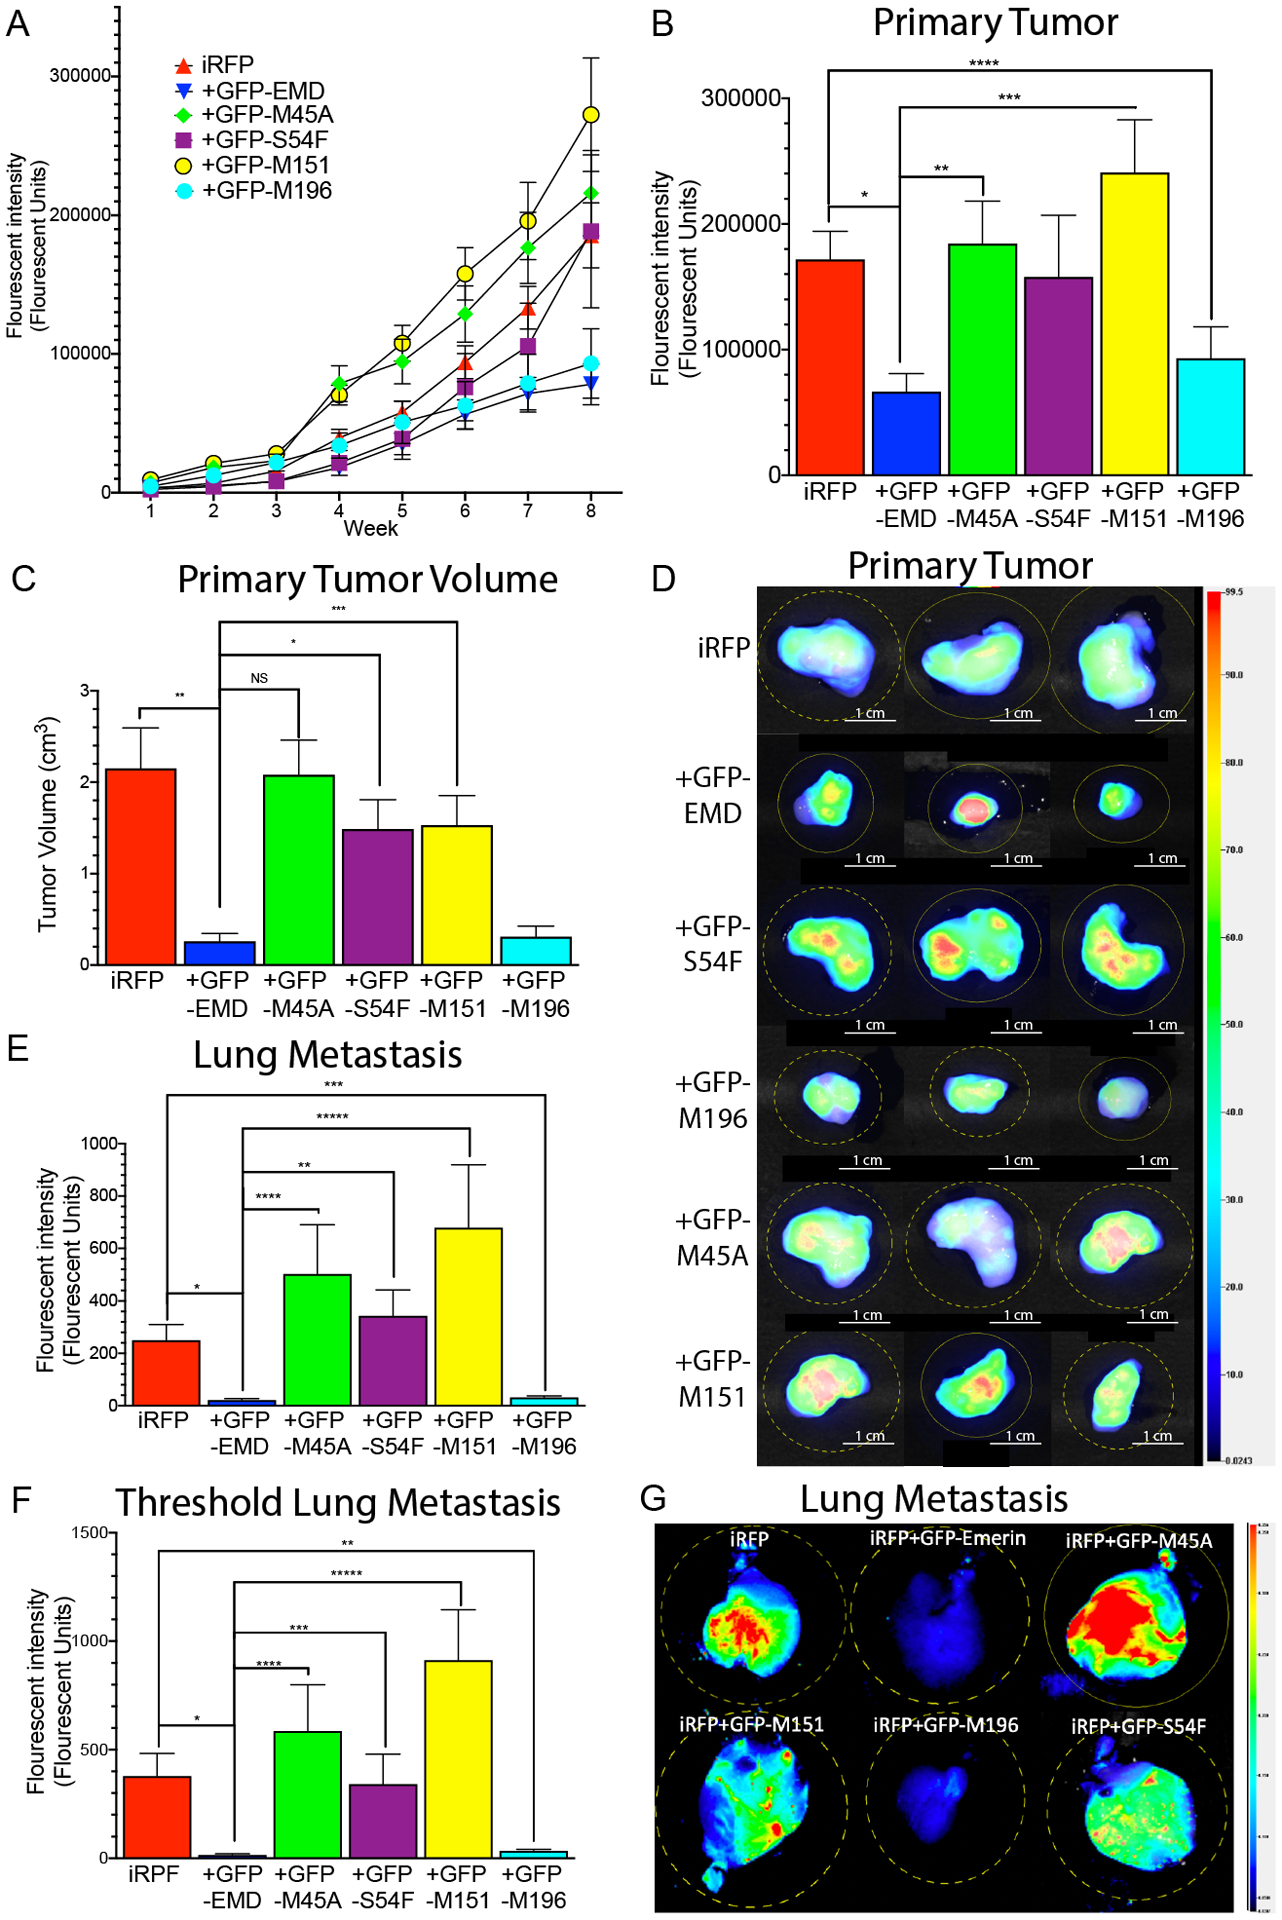
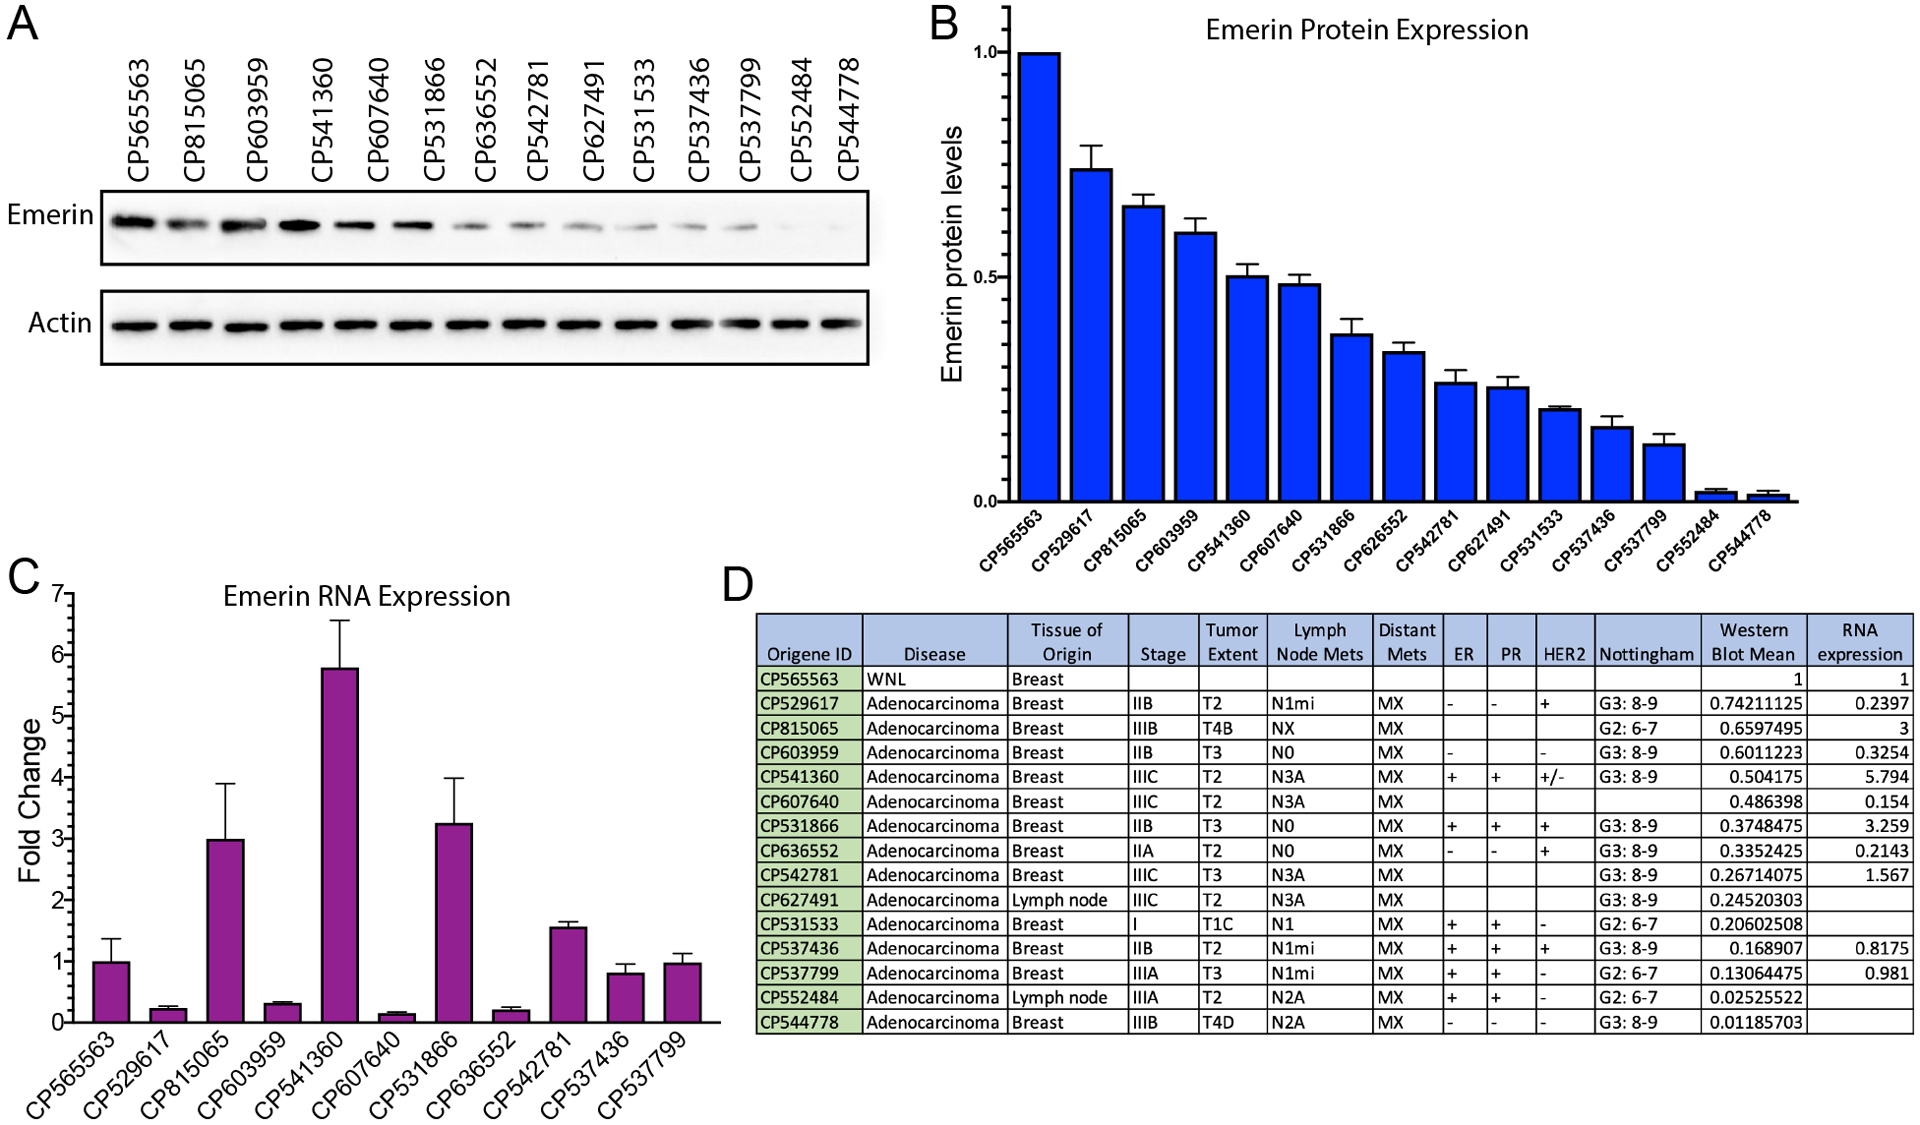
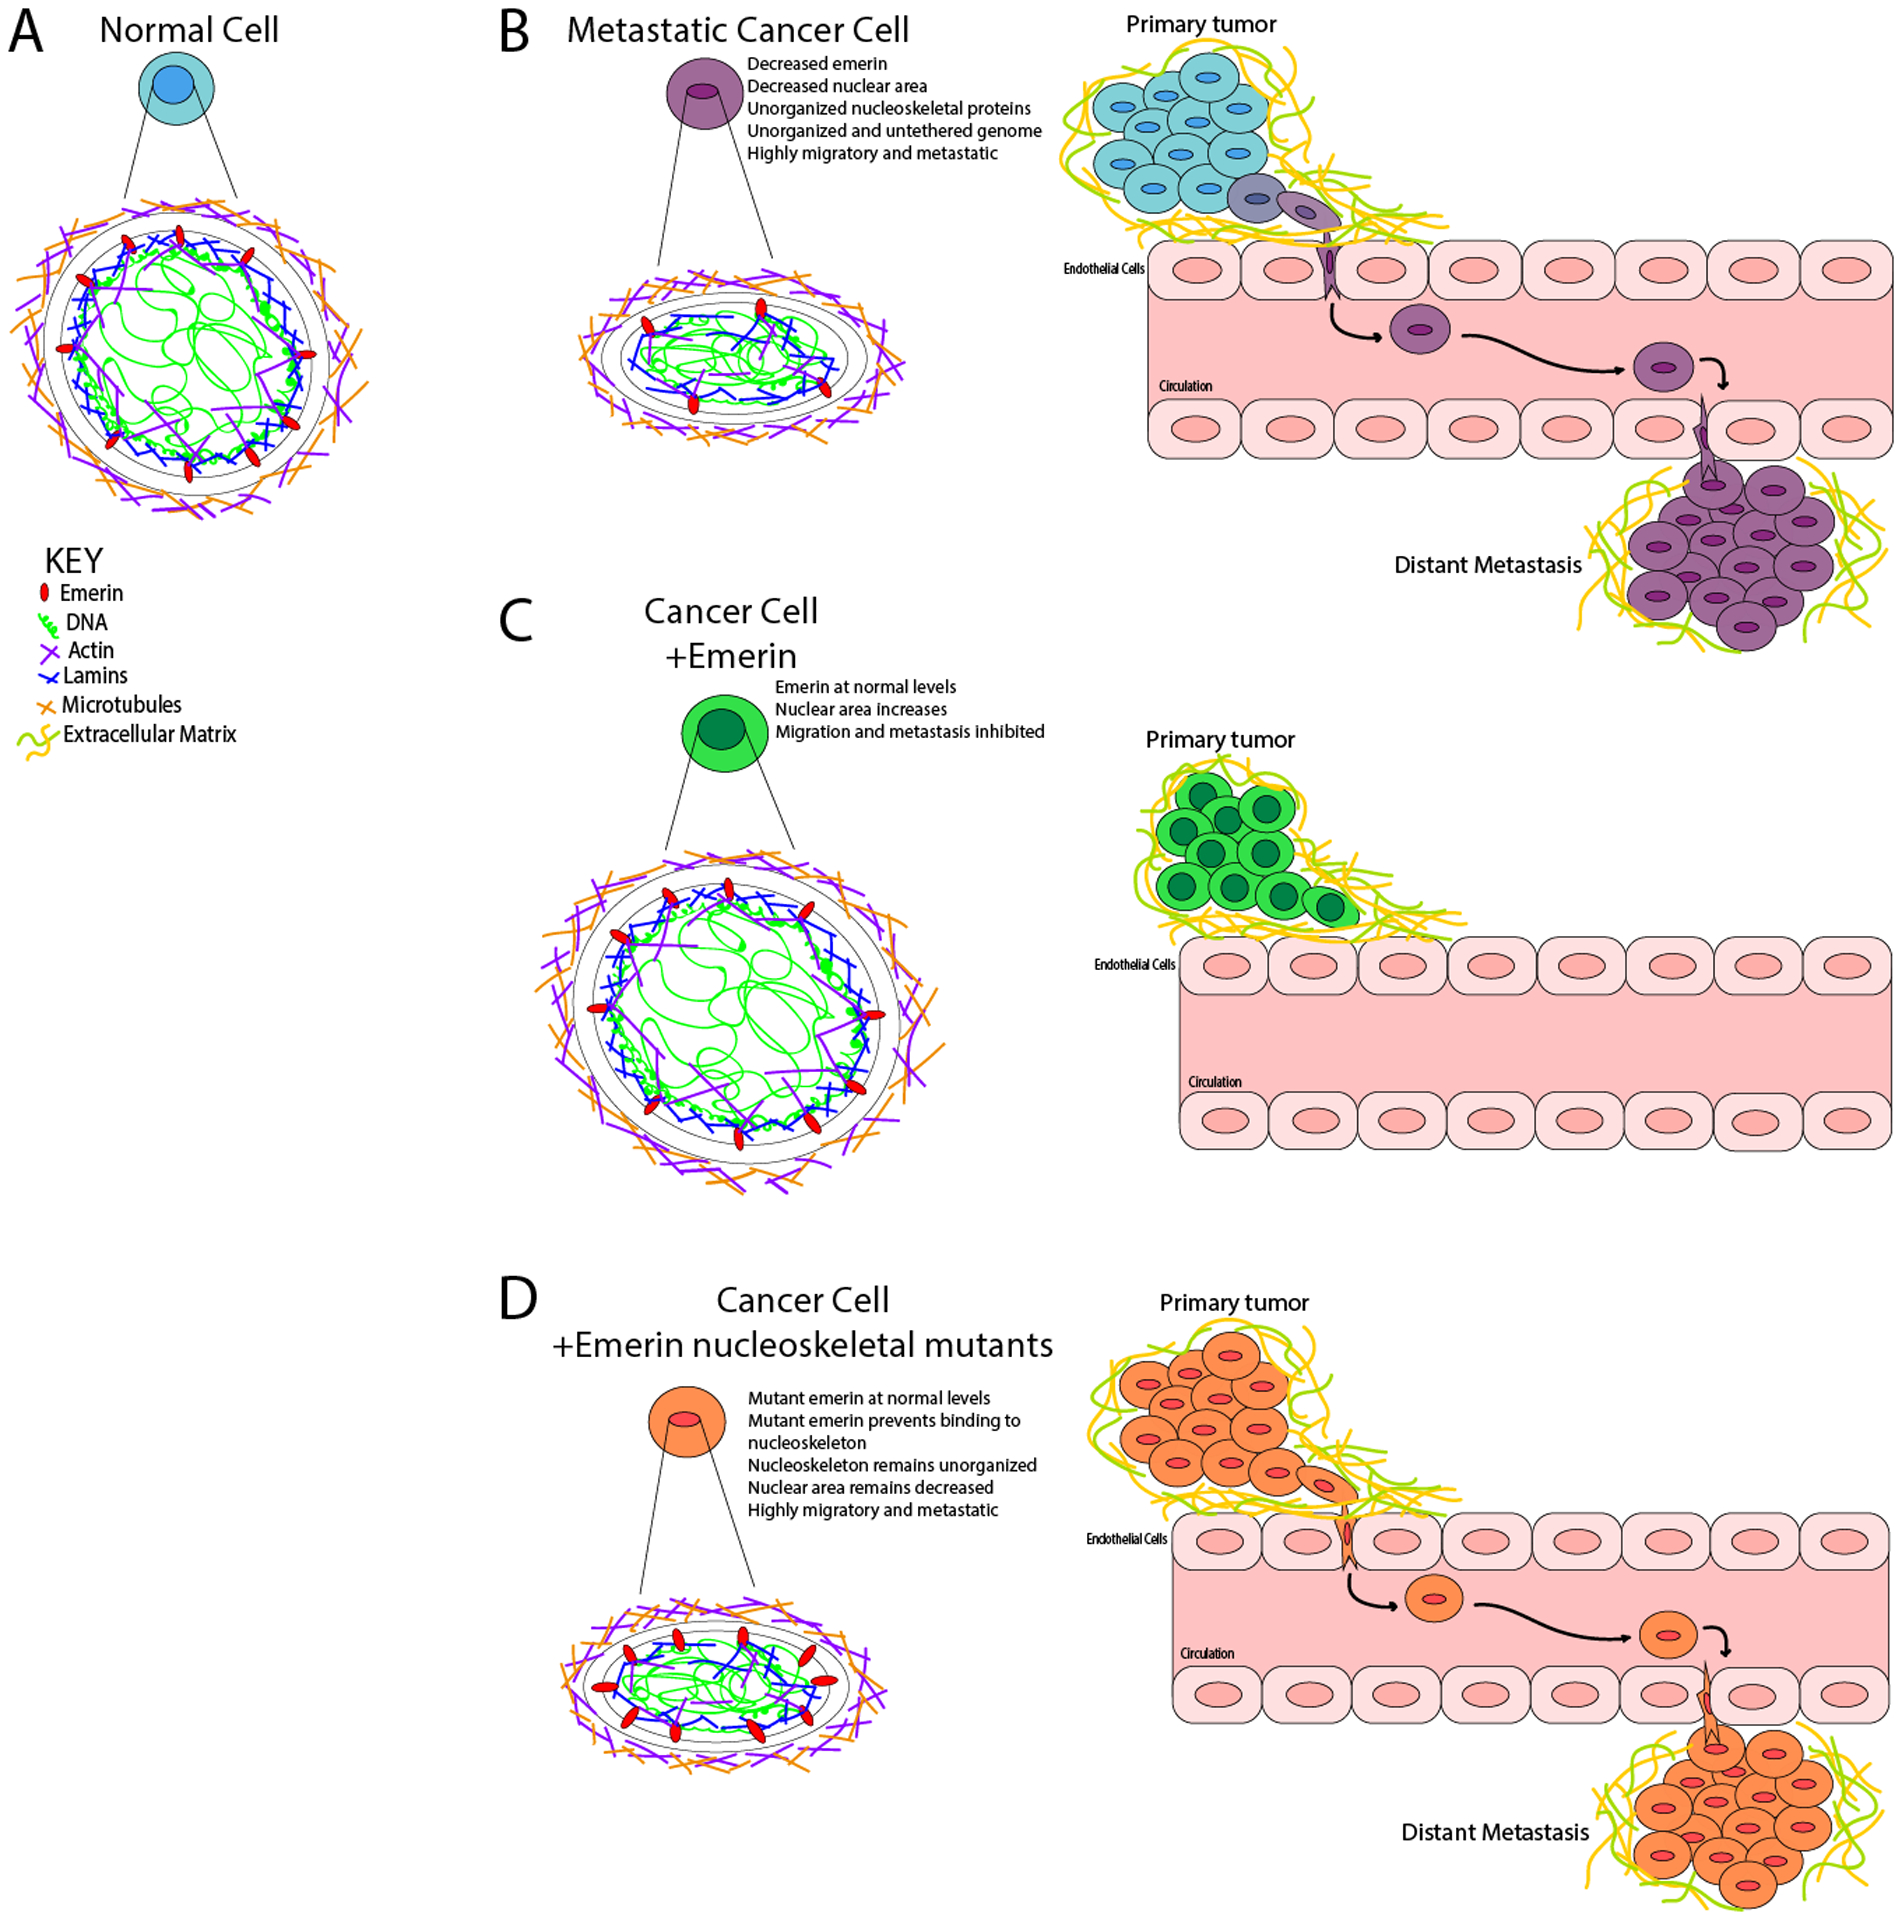
Nuclear envelope proteins play an important role in regulating nuclear size and structure in cancer. Altered expression of nuclear lamins are found in many cancers and its expression is correlated with better clinical outcomes. The nucleus is the largest organelle in the cell with a diameter between 10 and 20 μm. Nuclear size significantly impacts cell migration. Nuclear structural changes are predicted to impact cancer metastasis by regulating cancer cell migration. Here we show emerin regulates nuclear structure in invasive breast cancer cells to impact cancer metastasis. Invasive breast cancer cells had 40% to 50% less emerin than control cells, which resulted in decreased nuclear size. Overexpression of GFP-emerin in invasive breast cancer cells rescued nuclear size and inhibited migration through 3.0 and 8.0 μm pores. Mutational analysis showed emerin binding to nucleoskeletal proteins was important for its regulation of nuclear structure, migration, and invasion. Importantly, emerin expression inhibited lung metastasis by 91% in orthotopic mouse models of breast cancer. Emerin nucleoskeleton-binding mutants failed to inhibit metastasis. These results support a model whereby emerin binding to the nucleoskeleton regulates nuclear structure to impact metastasis. In this model, emerin plays a central role in metastatic transformation, because decreased emerin expression during transformation causes the nuclear structural defects required for increased cell migration, intravasation, and extravasation. IMPLICATIONS: Modulating emerin expression and function represents new targets for therapeutic interventions of metastasis, because increased emerin expression rescued cancer metastasis.


Conflict of interest statement

Conflicts of interests: The authors declare no conflicts of interest.

Figures

Figure 1:
Figure 1:. Invasive breast cancer cells have decreased protein expression and smaller nuclear area.
(A) Western Blot analysis of emerin in primary mammary epithelial cells, MCF10A cells, MDA-231 cells and MDA-157 cells. (B) Western Blot quantification of emerin expression for each cell line. Emerin expression was normalized to tubulin and primary mammary epithelial cells. Error bars represent standard error. (n=3) ****p-value < 0.0001, unpaired t-test. (C) Nuclear area for MCF10A (n=116, blue), MDA-231 (n=237, green) and MDA-157 (n=342, red) cells. Error bars represent standard error. ****p-value < 0.0001, unpaired t-test (D) Representative DAPI (blue) images of MCF10A, MDA-231, and MDA-157 cells. Scale bars: 100 μm. (E) Nuclear circularity for MCF10A (n=75, blue), MDA-231 (n=301, green), and MDA-157 (n=237, red) cells. Error bars represent standard error. ****p-value < 0.0001, unpaired t-test
Figure 2:
Figure 2:. GFP-emerin increases nuclear area in invasive breast cancer cells.
(A) Nuclear area of MDA-231 cells (n=237, black), MDA-231 cells with no plasmid, but electroporated (electroporation control; n=195, red), and MDA-231 cells expressing GFP (n=53, orange) or GFP-emerin (n=157, blue). Error bars represent standard error. ****p-value < 0.0001, unpaired t-test (B) Representative DAPI (blue) and GFP-emerin (green) images of MDA-231 cells. Scale bar: 50 μm. (C) Nuclear area of MCF10A cells (n=65, black), MCF10A cells with no plasmid, but electroporated (electroporation control; n=45, red), and MCF10A cells expressing GFP (n=90, orange) or GFP-emerin (n=76, blue). Error bars represent standard error. All comparisons had p-values > 0.05. (D) Representative DAPI (blue) and GFP-emerin (green) images of MCF10A cells. Scale bar: 50 μm.
Figure 3:
Figure 3:. GFP-emerin mutants that disrupt binding to nucleoskeletal partners fail to rescue nuclear area.
(A) Western blot of MCF10A cells, MDA-231 cells and MDA-231 cells stably expressing GFP-emerin or each GFP-emerin mutant. (B) Endogenous emerin, GFP-emerin and total emerin protein expression was normalized to gamma-tubulin and wildtype emerin in MDA-231 cells. Error bars represent standard deviation. (C) Panel showing known emerin-binding proteins and their disruption by the indicated emerin mutant protein. +, indicates emerin mutant binds to specific binding partner; -, indicates emerin mutant disrupts binding to the protein [58]. Disruptions are highlighted in yellow for clarity. (D) Nuclear area of MDA-231 cells (n=237, black), MDA-231 cells with no plasmid, but electroporated (electroporation control; n=195, black), and MDA-231 cells expressing GFP (n=53, orange), GFP-emerin (n=157, blue), GFP-M45A (n=142, green), GFP-S54F (n=145, purple), GFP-M151 (n=155, yellow), GFP-M24 (n=158, pink) or GFP-M196 (n=149, cyan). Error bars represent standard error. ****p-value < 0.0001, one-way ANOVA. (E) Representative DAPI (blue) and GFP (green) images for GFP-emerin and each GFP-emerin mutant analyzed in D. Scale bars: 50 μm. (F) Nuclear volume of MCF10A cells (n=25, red), MDA-231 cells (n=29, black), and MDA-231 cells expressing GFP-emerin (n=32, blue), GFP-M45A (n=22, green), GFP-S54F (n=28, purple), GFP-M151 (n=26, yellow), and GFP-M196 (n=19, cyan). Error bars represent standard error. **p-value = 0.0030, *p-value = 0.041, one-way ANOVA. (G) Representative DAPI (blue), GFP (green), and merged images for MCF10A cells, MDA-231 cells and MDA-231 cells expressing GFP-emerin or each GFP-emerin mutant analyzed in F. Scale bars: 10 μm. (H) Nuclear circularity of MDA-231 cells (n=55, black) and MDA-231 cells expressing GFP-emerin (n=52, blue), GFP-M45A (n=53), green), GFP-S54F (n=50, purple), GFP-M151 (n=49, yellow), GFP-M24 (n=44, pink), or GFP-M196 (n=59, cyan). Error bars represent standard error. *p-value = 0.0035, **p-value = 0.0005, ***p-value = 0.0225, ****p-value < 0.0001, one-way ANOVA (I) Ratio of nuclear to cytoplasmic area in MDA-231 cells (n=61, black) and MDA-231 cells expressing GFP-emerin (n=63, blue), GFP-M45A (n=45, green), GFP-S54F (n=65, purple), GFP-M151 (n=55, yellow) or GFP-M196 (n=54, cyan). Error bars represent standard error. *p-value = 0.051, **p-value = 0.035, ****p-value < 0.0001, one-way ANOVA. (J) Nuclear area of MCF10A cells (n=65, black), MCF10A cells with no plasmid, but electroporated (electroporation control; n=45, red), and MCF10A cells expressing GFP (n=90, orange), GFP-emerin (n=76, blue), GFP-M45A (n=90, green), GFP-S54F (n=91, purple), GFP-M151 (n=72, yellow), GFP-M24 (n=72, pink) or GFP-M196 (n=72, cyan). Error bars represent standard error. **p-value = 0.0101, one-way ANOVA.
Figure 4:
Figure 4:. GFP-emerin expression decreases cell migration in invasive breast cancer cells.
(A) Western blot quantification of H3K9me2, H3K9me3, and H3K27me3 expression in MDA-231 cells, and MDA-231 cells expressing GFP-emerin, GFP-M45A, GFP-S54F, GFP-M151, and GFP-M196. Expression was normalized to gamma-tubulin and MDA-231 cells. Error bars represent standard error. All comparisons had p-value > 0.05. (B) Representative Western blot of MDA-231 cells and MDA-231 cells expressing GFP-emerin, GFP-M45A, GFP-S54F, GFP-M151, and GFP-M196. (C) The number of cells migrating through 3.0 μm transwell pores is shown for MCF10A cells, MDA-231 cells, and MDA-231 cells expressing GFP, GFP-emerin, GFP-M45A, GFP-S54F, GFP-M151, GFP-M24 or GFP-M196. Error bars represent standard deviation. ****p-value < 0.0001, one-way ANOVA (D) Representative DAPI (blue) images for each of the cell lines analyzed in C. Scale bars: 400 μm. (E) The number of cells invading through 8.0 μm transwell pores with a Matrigel® coating was measured for MCF10A cells, MDA-231 cells, and MDA-231 cells expressing GFP-emerin, GFP-M45A, GFP-S54F, GFP-M151, or GFP-M196. Error bars represent standard deviation. *p-value = 0.0009, **p-value = 0.0005, ****p-value < 0.0001, one-way ANOVA (F) Representative DAPI (blue) images used for E. Scale Bars: 400 μm. (G) Scratch-wound healing assay. MCF10A cells, MDA-231 cells, and MDA-231 cells expressing GFP-emerin, GFP-M45A, GFP-S54F, GFP-M151, or GFP-M196 were plated, scratched with a pipette tip, and migration of cells into the wound area was monitored for 2, 4, 12 and 24 hours. Percent healed (%) refers to the ability of cells to migrate into the wound area. Error bars represent standard deviation. (H) Representative phase images for each cell line analyzed in G. Scale bars: 400 μm.
Figure 5:
Figure 5:. GFP-emerin expression decreased primary tumor growth and blocked lung metastasis.
(A) Fluorescence intensity of the primary tumor was measured weekly for eight weeks. (B) Primary tumor size after excision at week eight. n=38 for iRFP713, n=30 for GFP-emerin, n=28 for each GFP-emerin mutant. Error bars represent standard error. *p-value = 0.0004, **p-value = 0.0050, ***p-value = 0.0006, ****p-value= 0.0266, one-way ANOVA. C) Volume of excised tumors at eight weeks post-injection with MDA-231 cells expressing iRFP713 (n=38), and GFP-emerin (n=30), GFP-S54F (n=28), GFP-M196 (n=28), GFP-M45A (n=28), or GFP-M151 (n=28) cells. Error bars represent standard error. *p-value = 0.0005, **p-value = 0.0015, ***p-value = 0.0239, one-way ANOVA (D) Representative fluorescent images of excised primary tumors at eight weeks post-injection. Heat-map shows iRFP713 fluorescence intensity. Scale bars: 1 cm (E) Fluorescence intensity of lung metastasis at eight weeks post-injection. Data was normalized to control lungs with no metastasis. n=38 for iRFP713 alone, n=30 for GFP-emerin, n=28 for each GFP-emerin mutant. Error bars represent standard error. *p-value = 0.0027, **p-value = 0.0040, ***p-value = 0.0034, ****p-value = 0.0156, *****p-value = 0.0107, one-way ANOVA. (F) Lung metastasis fluorescence intensity from mice whose primary tumors were greater than 50,000 FU is shown. Data was normalized to control lungs with no metastasis. n=28 for iRFP713, n=12 for GFP-emerin, n=20 for GFP-S54F, n=16 for GFP-M196, n=24 for GFP-M45A, n=28 for GFP-M151. Error bars represent standard error. *p-value = 0.0023, **p-value = 0.0035, ***p-value = 0.0331, ****p-value = 0.0136, *****p-value = 0.0006, one-way ANOVA. (G) Representative fluorescent images of excised lungs at eight weeks post-injection. Heat-map shows iRFP713 fluorescent intensity.
Figure 6:
Figure 6:. Patients with invasive breast cancer have decreased emerin expression.
(A) Western blot analysis of protein lysates from a patient without breast cancer (control; CP565563) or from breast cancer patients. (B) Quantitation of protein lysates. Bands were normalized to actin and a patient without breast cancer (n=3). Error bars represent standard deviation. (C) qPCR analysis of matched RNA samples from one normal control patient sample and ten breast cancer patients. Samples were normalized to GAPDH and control patient sample without breast cancer. Error bars represent standard deviation. (D) Summary panel of patient tumor information.
Figure 7:
Figure 7:. Model for emerin regulation of breast cancer metastasis.
(A) Normal, non-cancerous nuclei are uniformly shaped with an organized nuclear lamina. The forces exerted on the nucleus from the cytoskeleton is countered by the forces within the nucleus, resulting in no deformations. The chromatin is compacted properly with heterochromatin tethered to the periphery and euchromatin centrally localized. (B) In a metastatic cancer cell, there is disruption of nuclear lamina proteins and significantly less emerin. This results in a disorganized nuclear lamina structure. The forces exerted on the nucleus from the cytoskeleton cannot be countered by the nucleoskeleton, resulting in a smaller, deformed nucleus that can easily migrate and metastasize. (C) When emerin is added to an invasive breast cancer cell, the nucleus can now properly organize the nucleoskeleton, which causes the nucleus to increase in size and shape. These changes block intravasation from occurring. (D) When emerin mutants that fail to bind the nucleoskeleton are added to invasive breast cancer cells, the nuclei are unable to reorganize the nuclear lamina properly. This fails to alter the nuclear morphology or size, and thus these cells can still intravasate and metastasize.

Similar articles

Cited by

References

    1. Wirtz D, Konstantopoulos K, and Searson PC, The physics of cancer: the role of physical interactions and mechanical forces in metastasis. Nat Rev Cancer, 2011. 11(7): p. 512–22. - PMC - PubMed
    1. Leoni G, et al., Wound repair: role of immune-epithelial interactions. Mucosal Immunol, 2015. 8(5): p. 959–68. - PMC - PubMed
    1. Chaffer CL and Weinberg RA, A perspective on cancer cell metastasis. Science, 2011. 331(6024): p. 1559–64. - PubMed
    1. Lammerding J, et al., Lamins A and C but not lamin B1 regulate nuclear mechanics. J Biol Chem, 2006. 281(35): p. 25768–80. - PubMed
    1. Chow KH, Factor RE, and Ullman KS, The nuclear envelope environment and its cancer connections. Nat Rev Cancer, 2012. 12(3): p. 196–209. - PMC - PubMed

Publication types

MeSH terms