. 2021 Mar 26;6(57):eabf0558.
doi: 10.1126/sciimmunol.abf0558.

A tumor-specific mechanism of Treg enrichment mediated by the integrin αvβ8

Affiliations

A tumor-specific mechanism of Treg enrichment mediated by the integrin αvβ8

Robert I Seed et al. Sci Immunol. .

Abstract

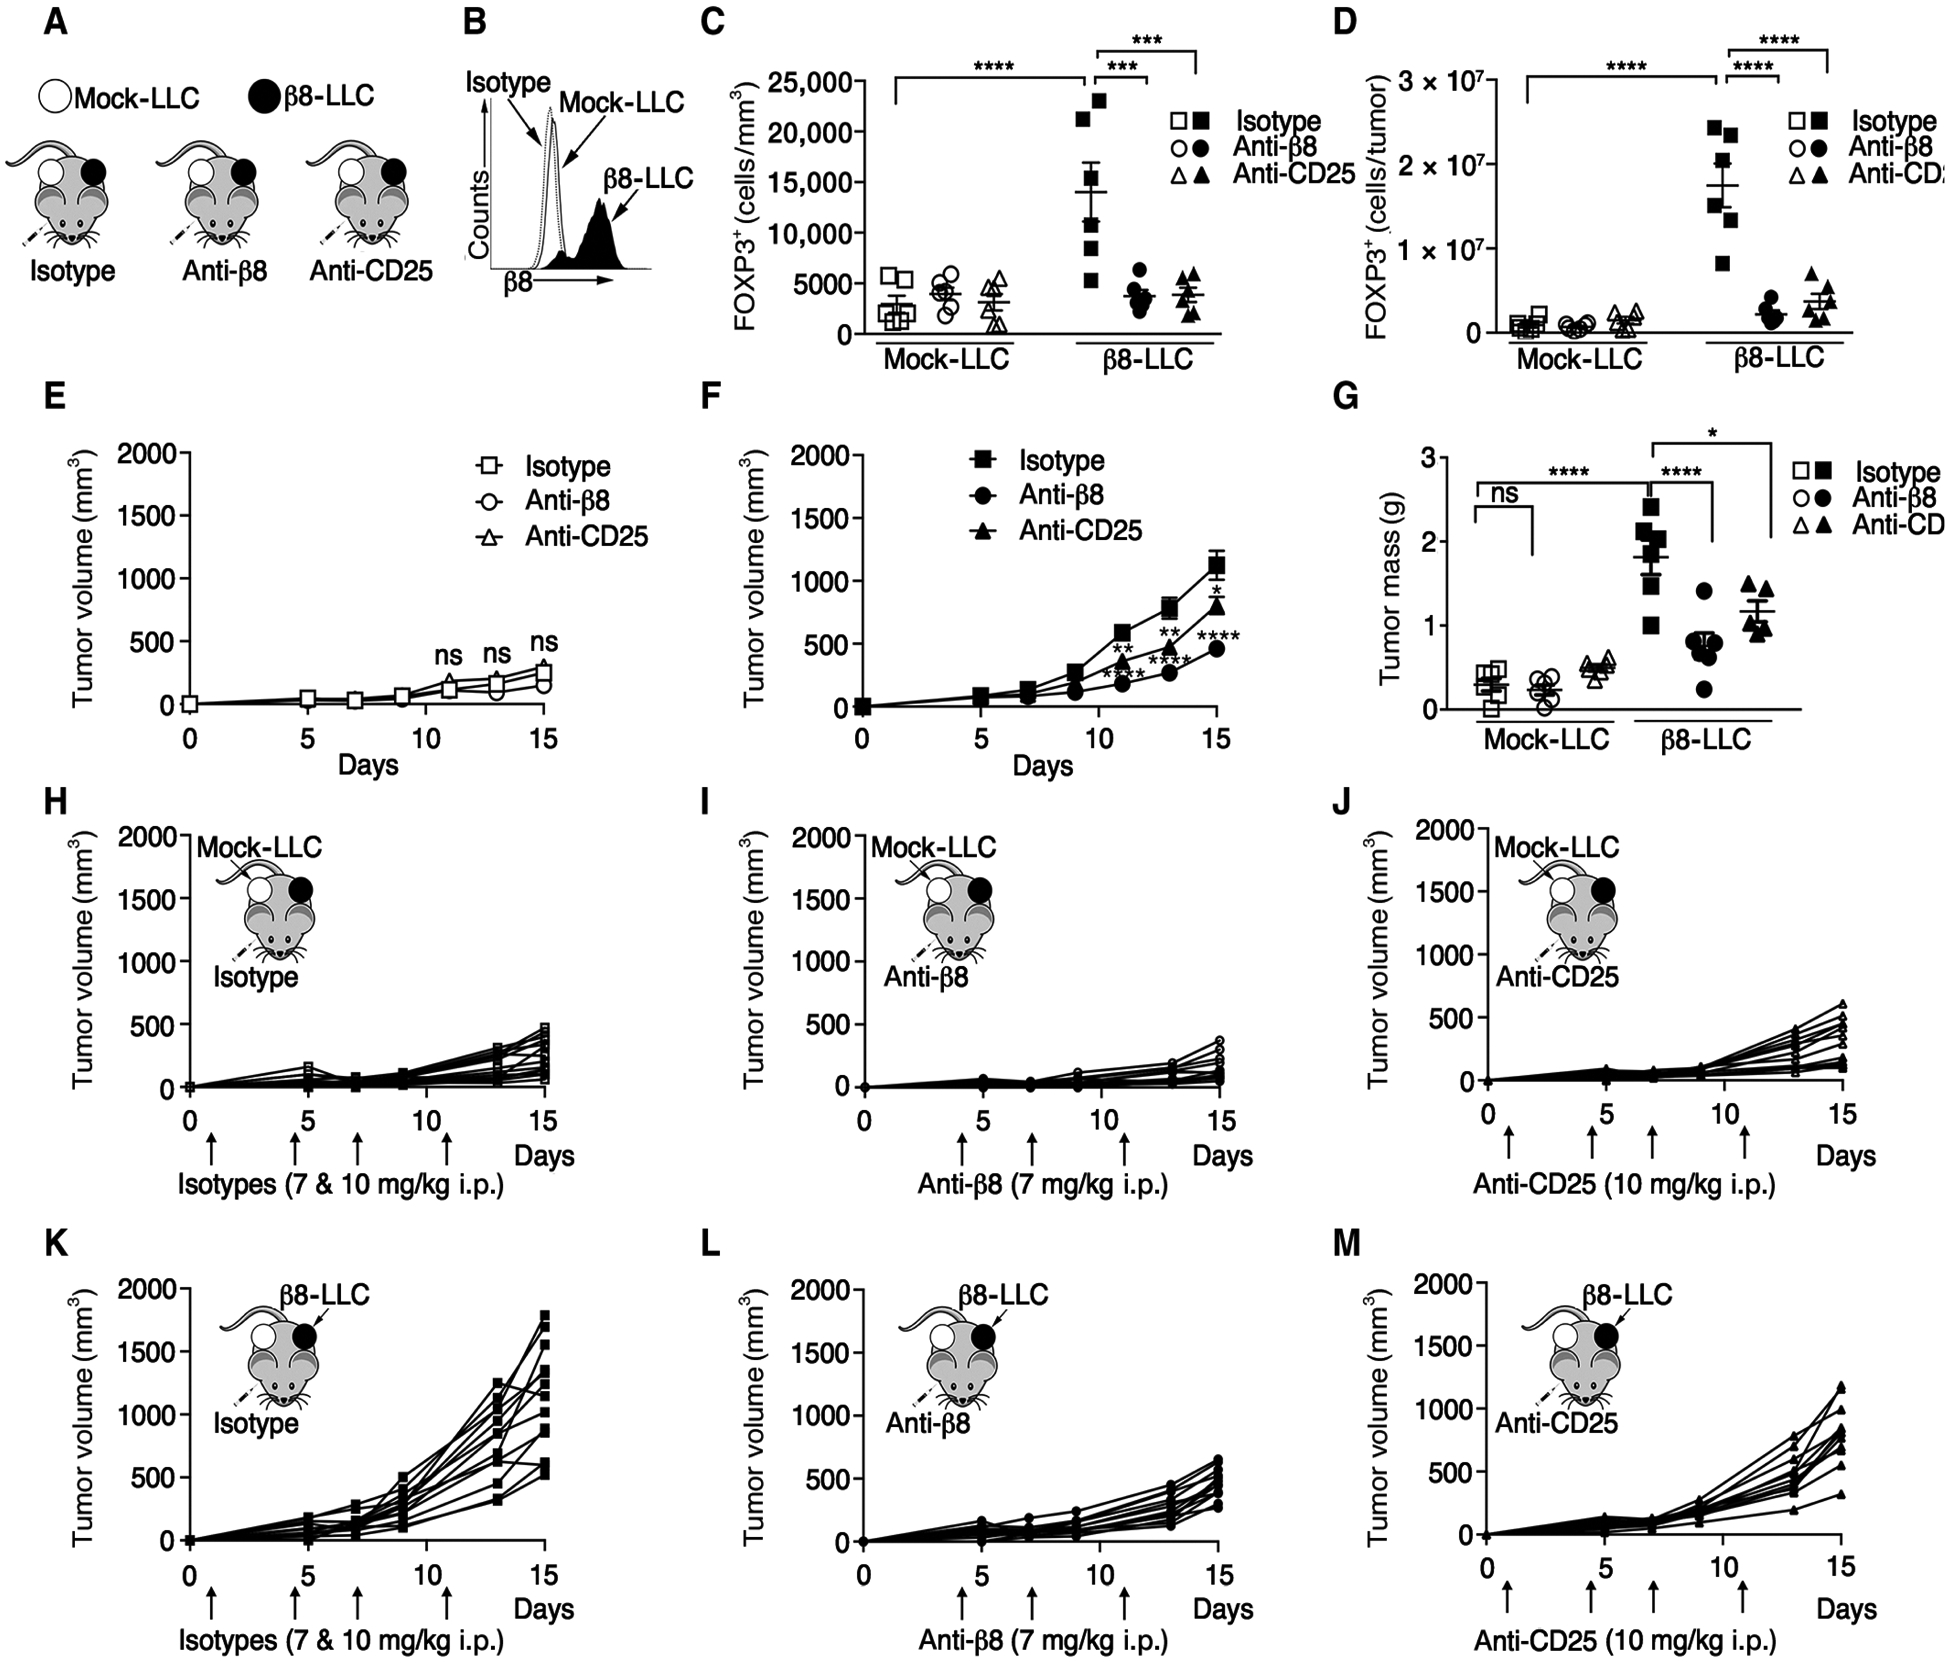
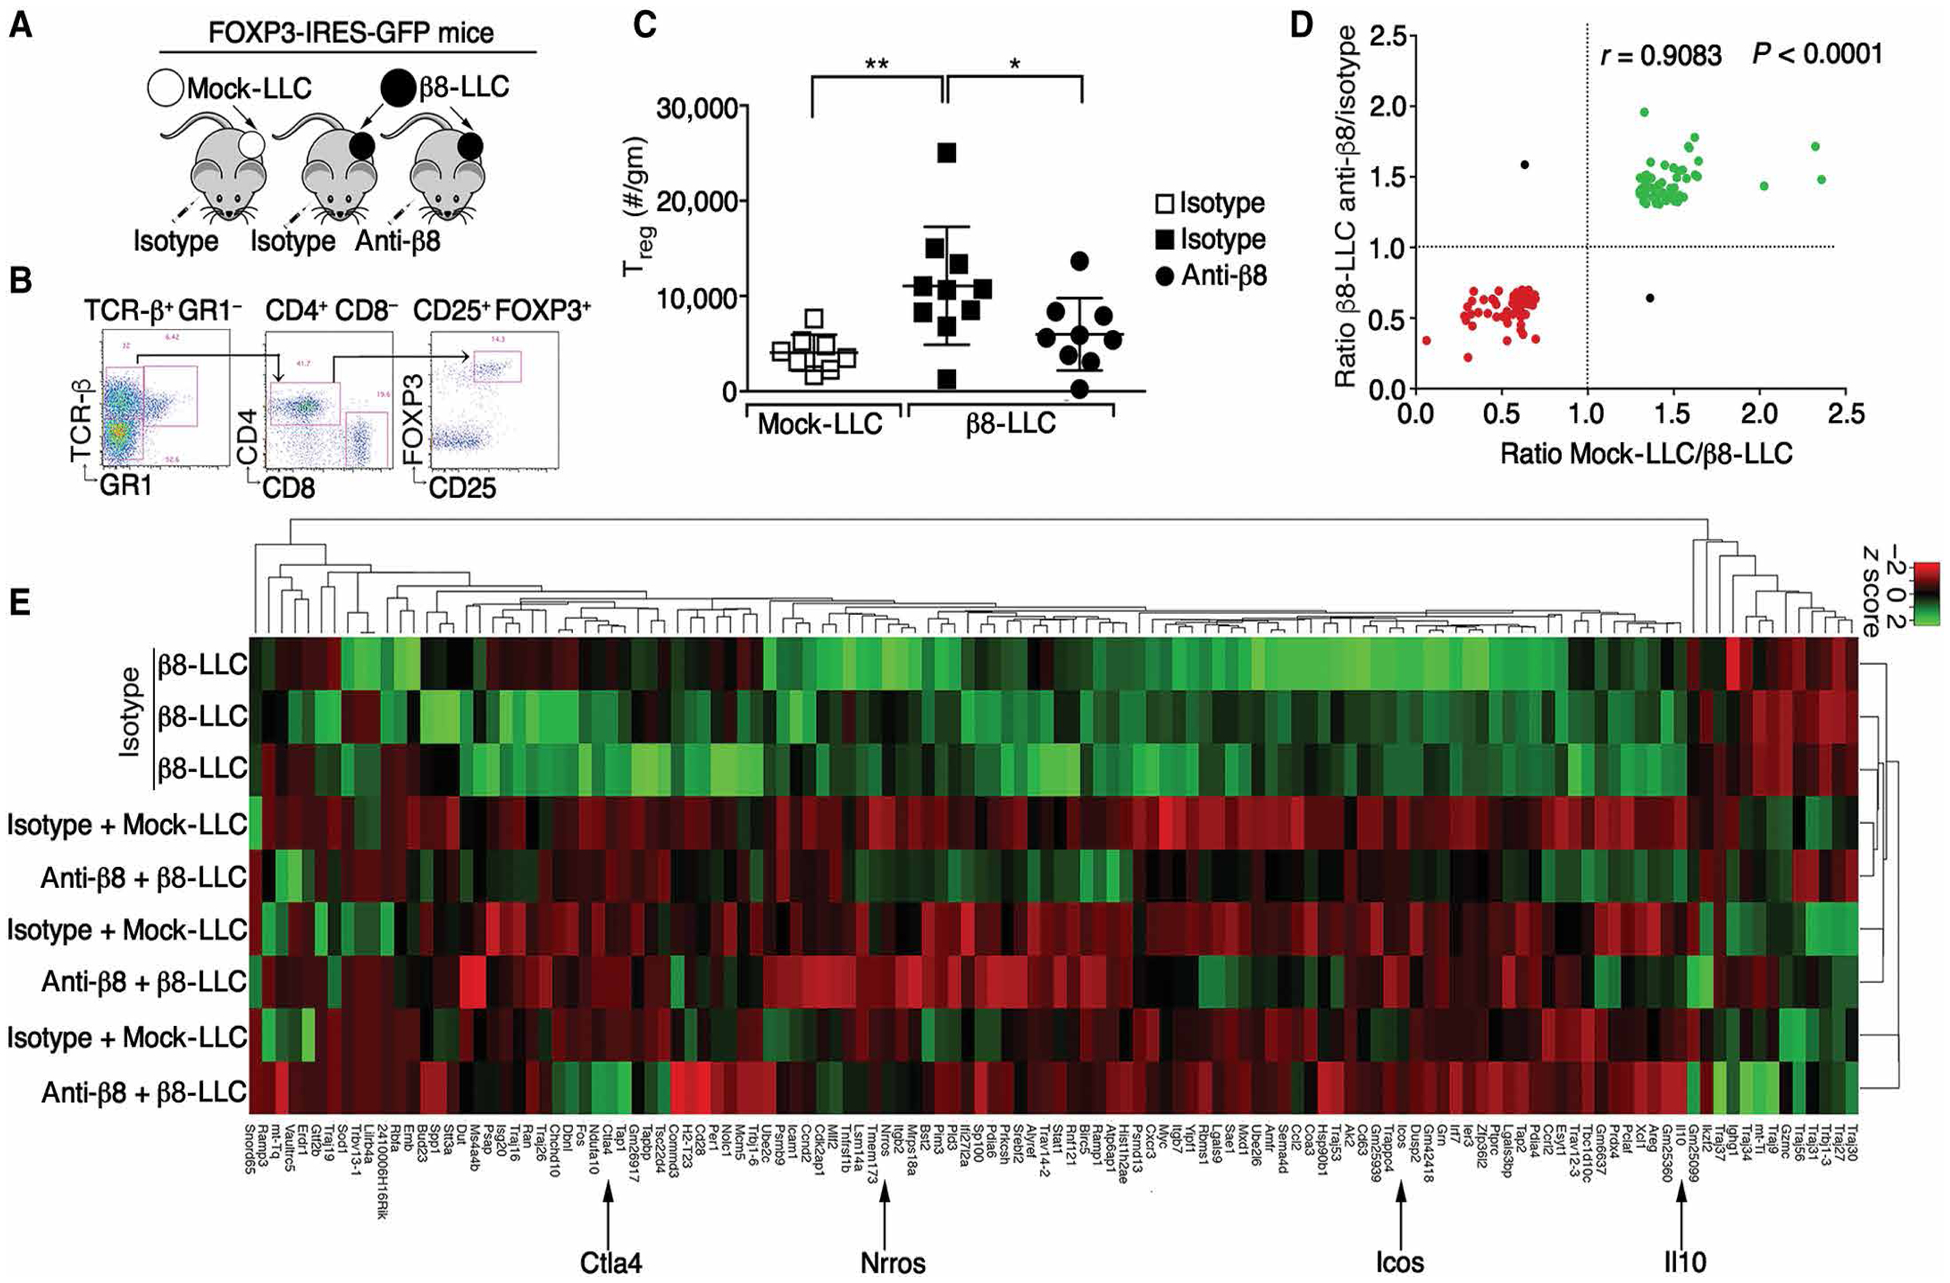
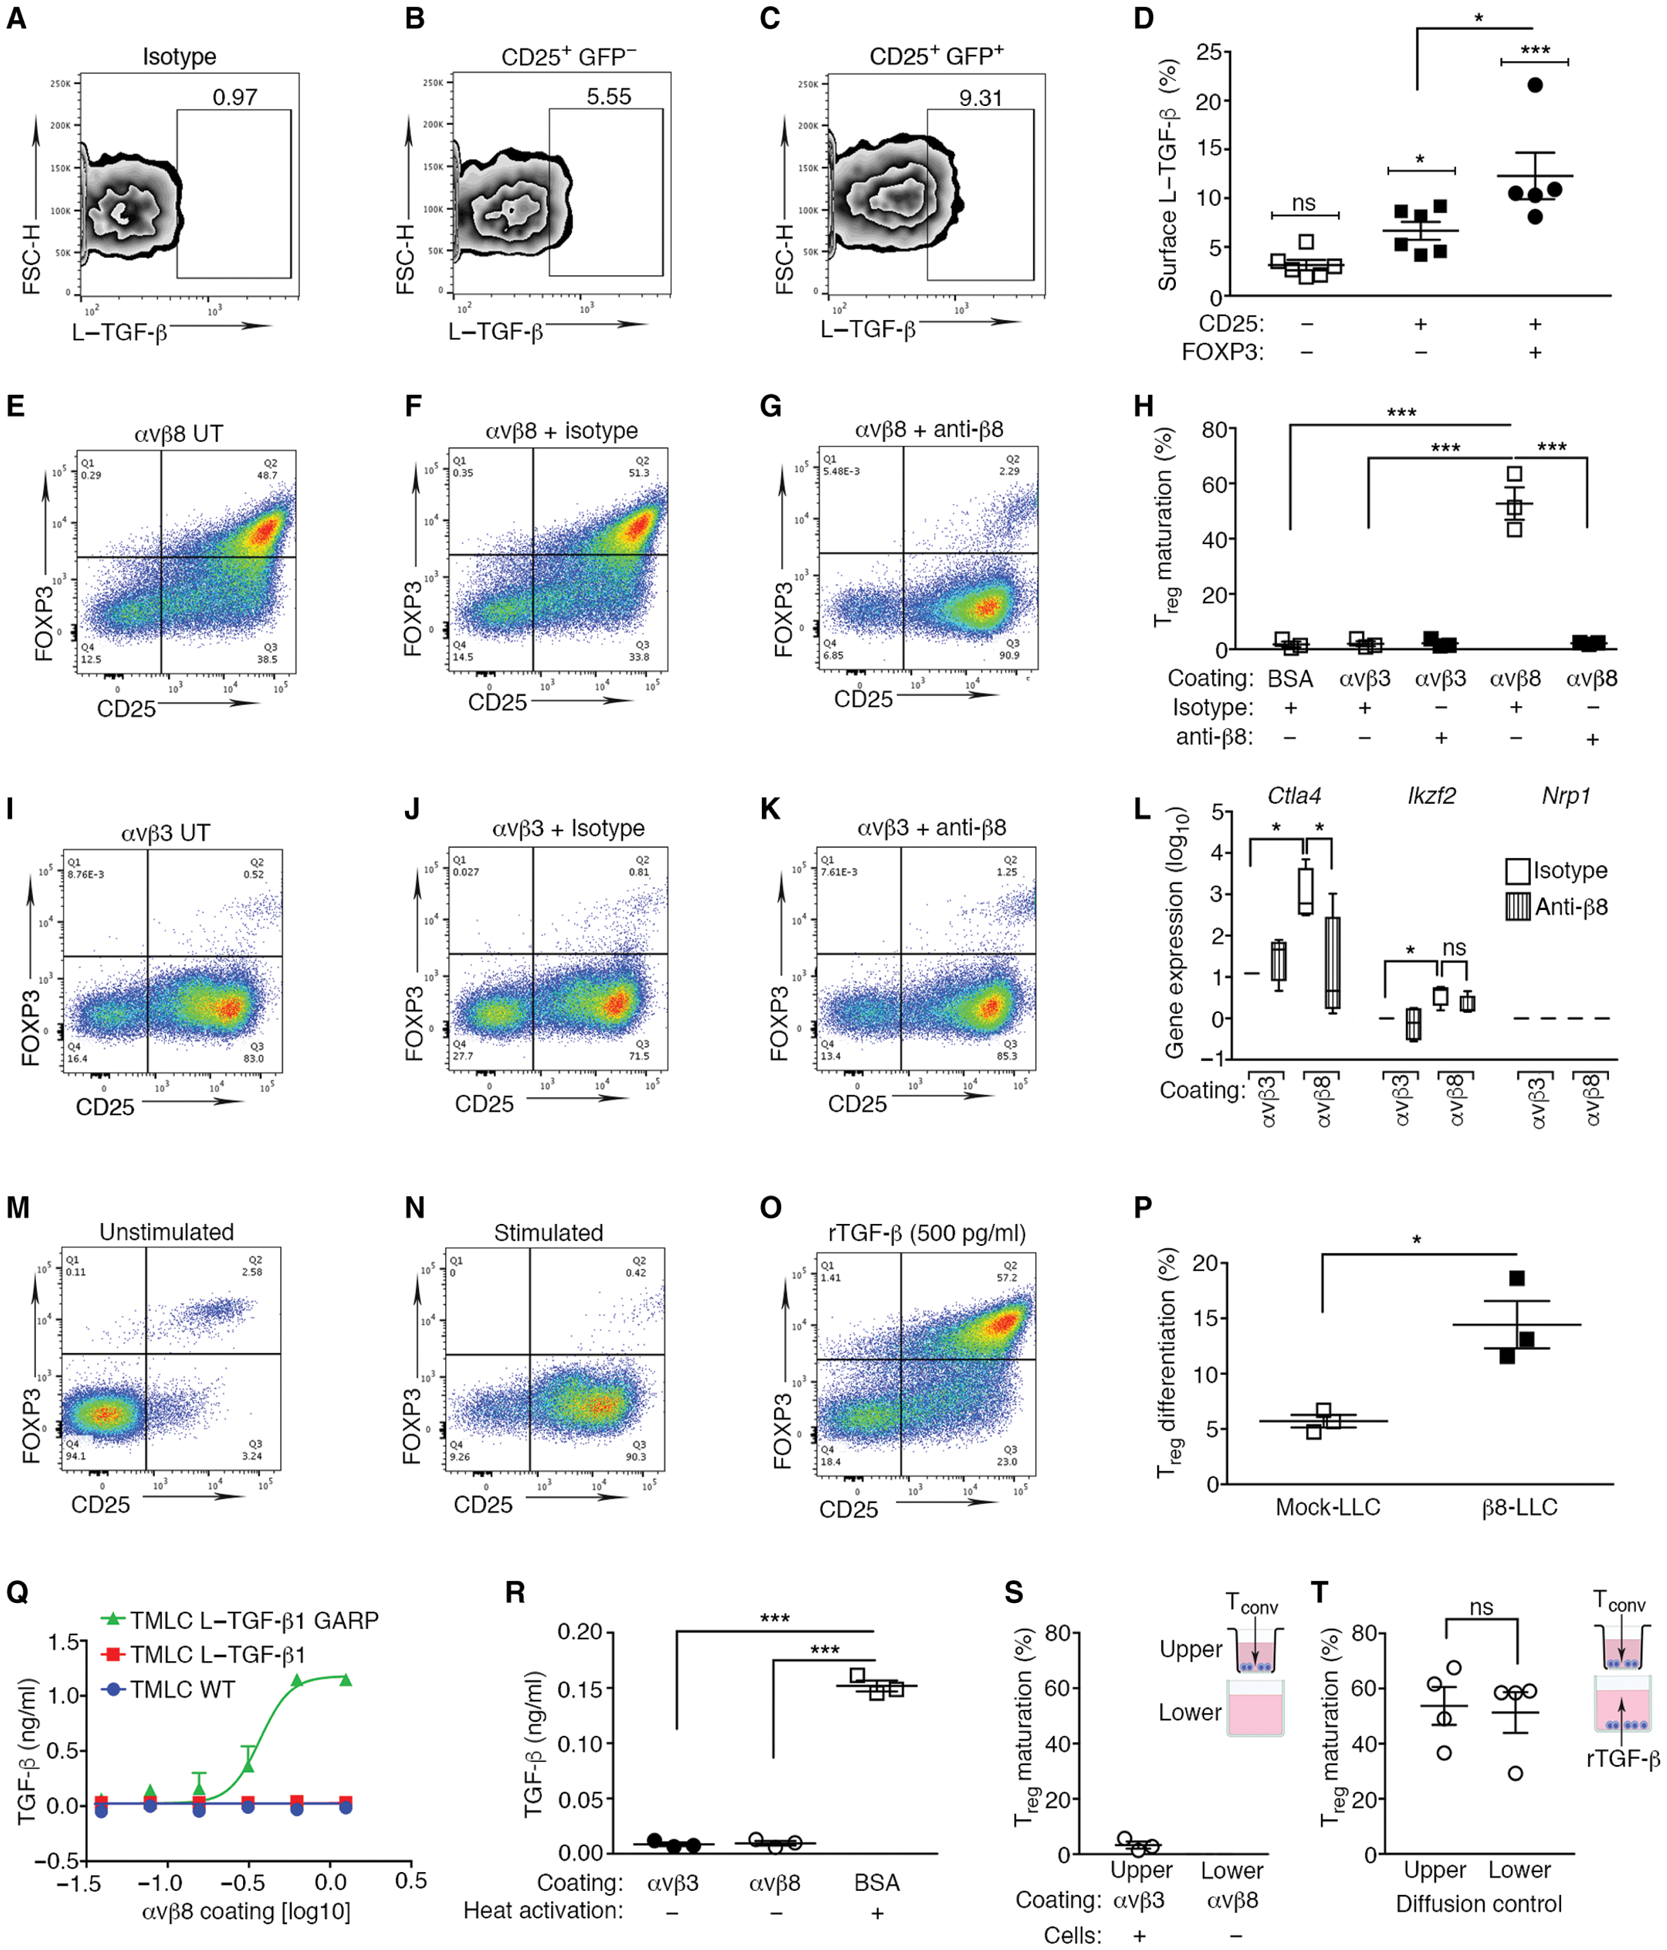
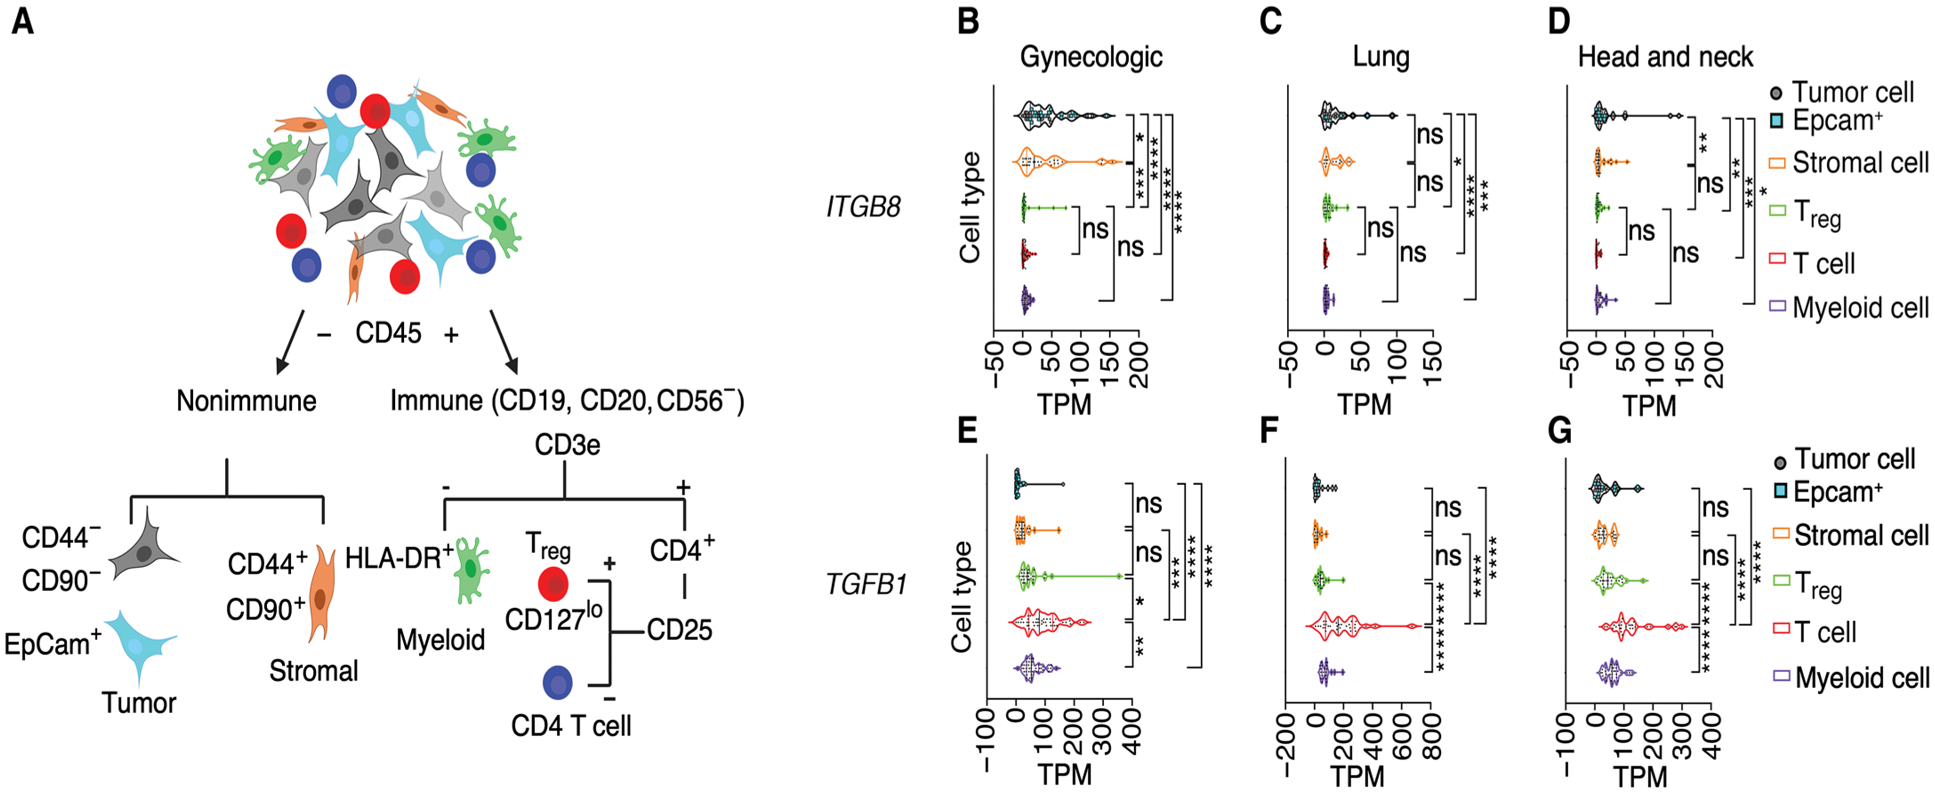
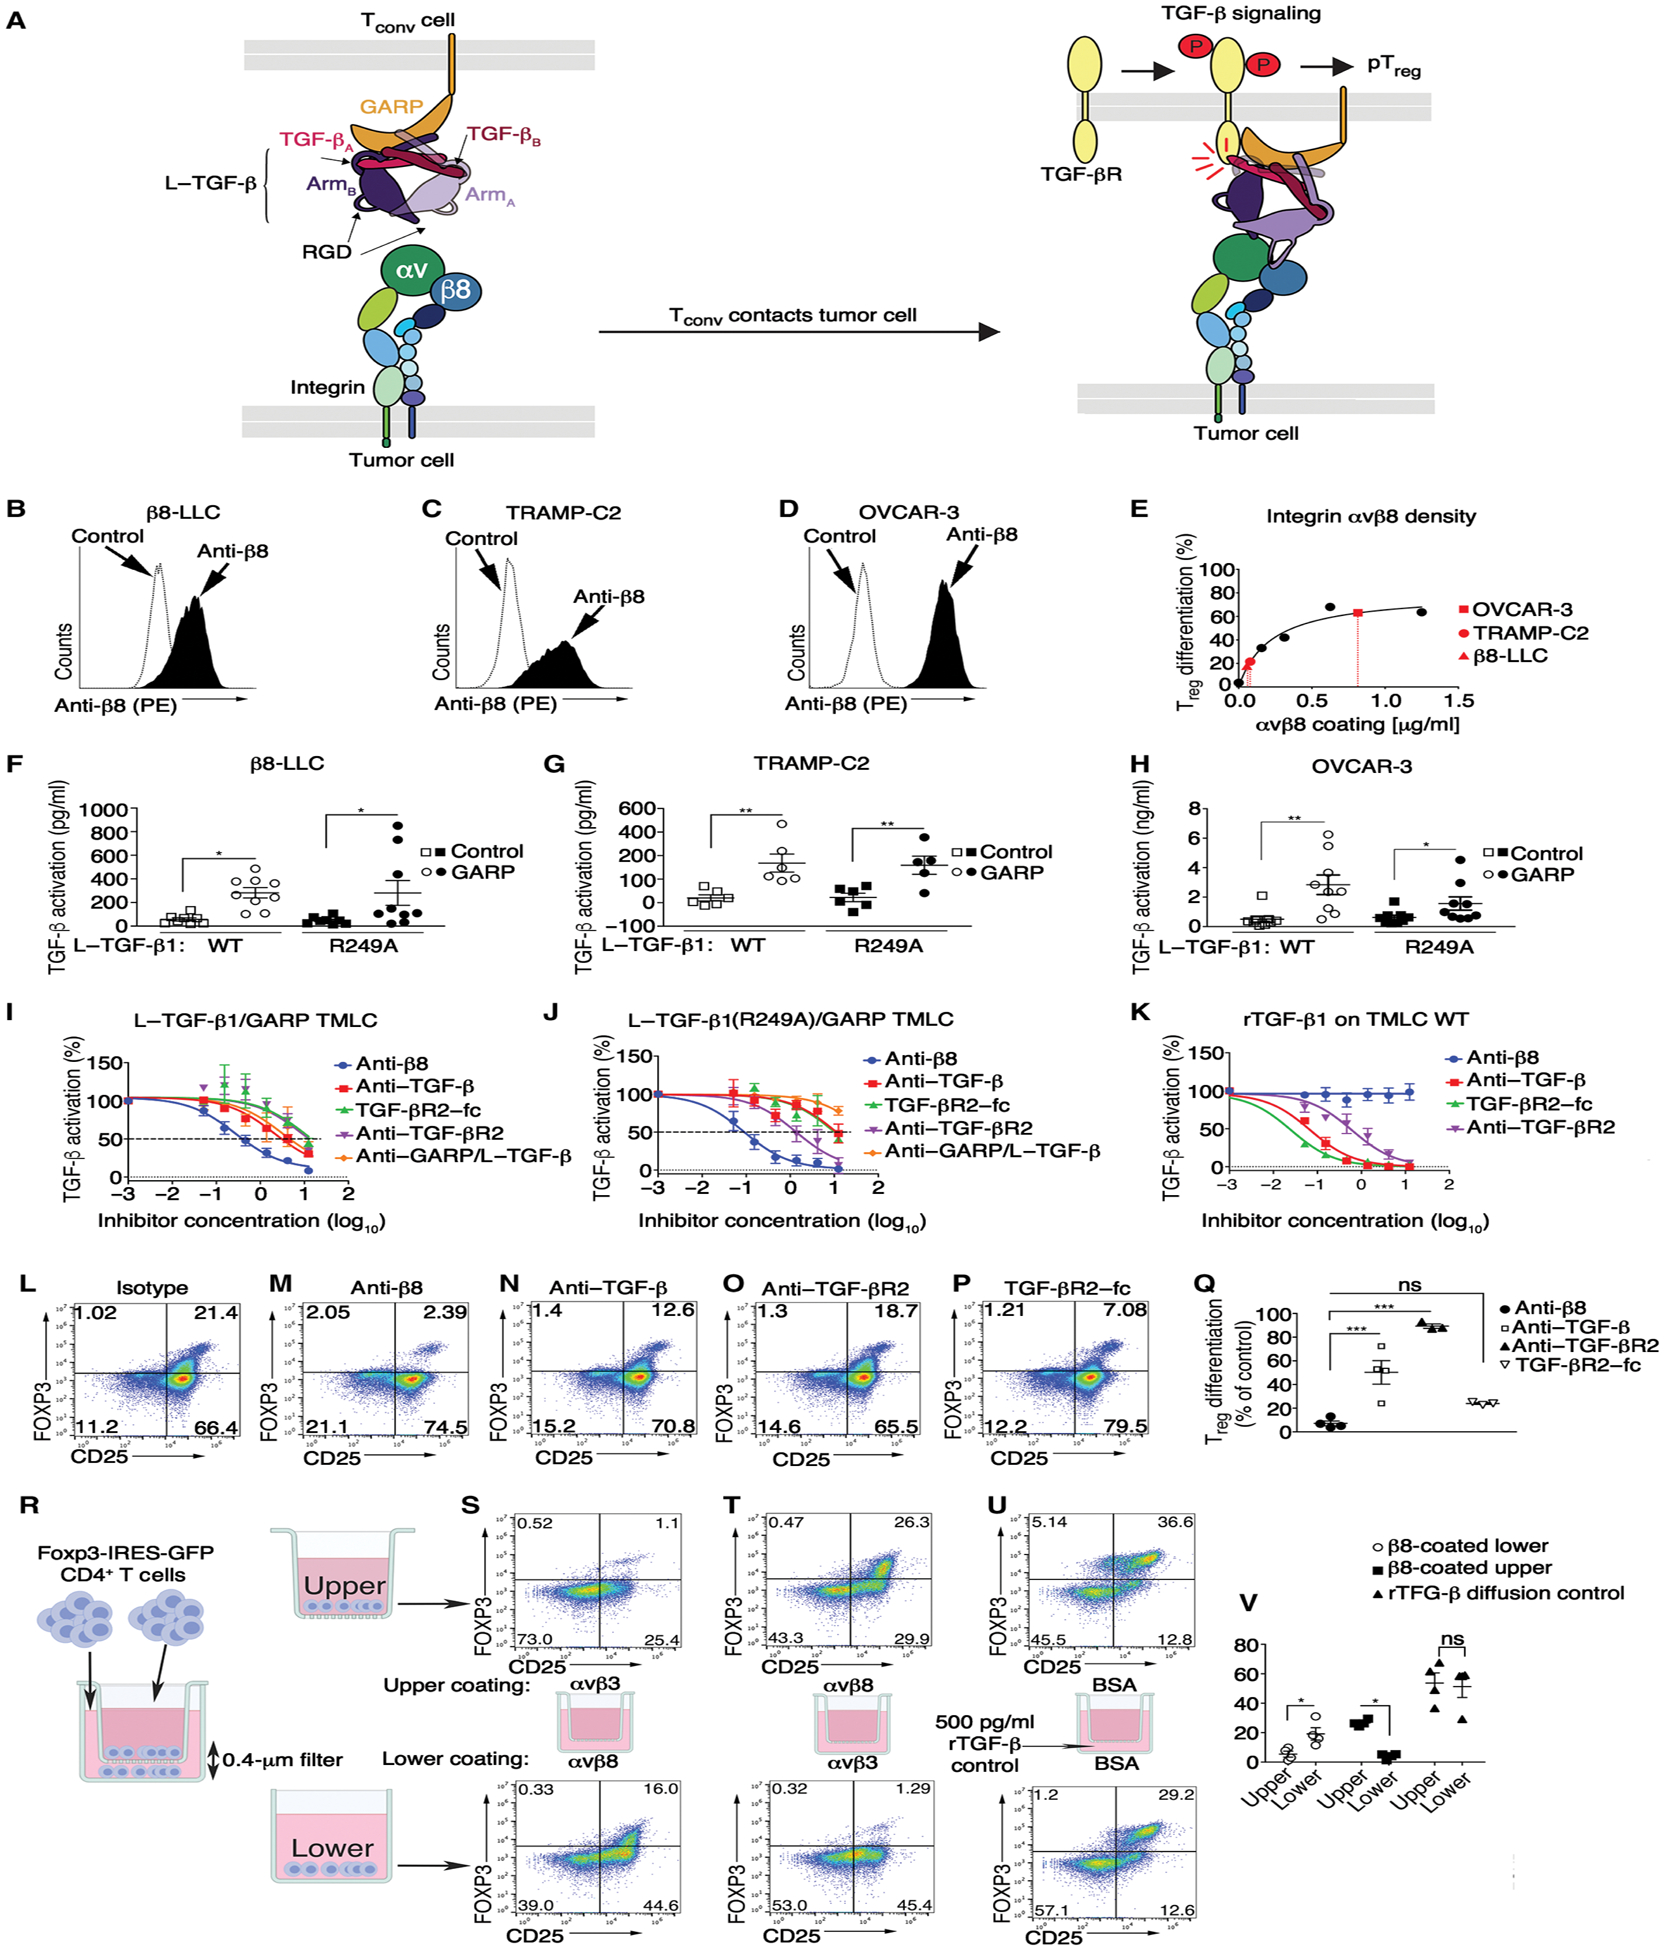
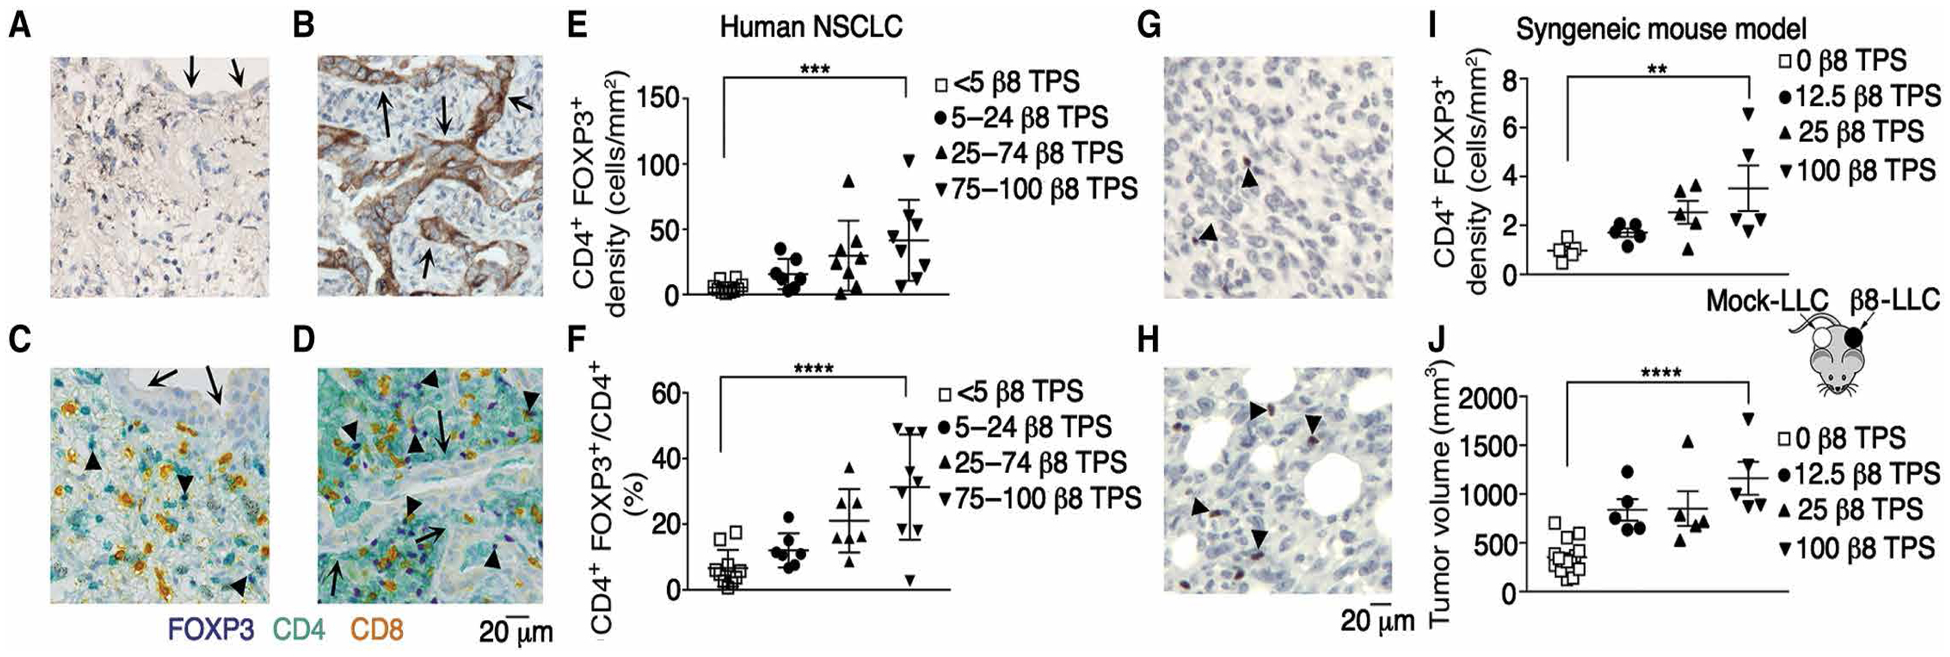
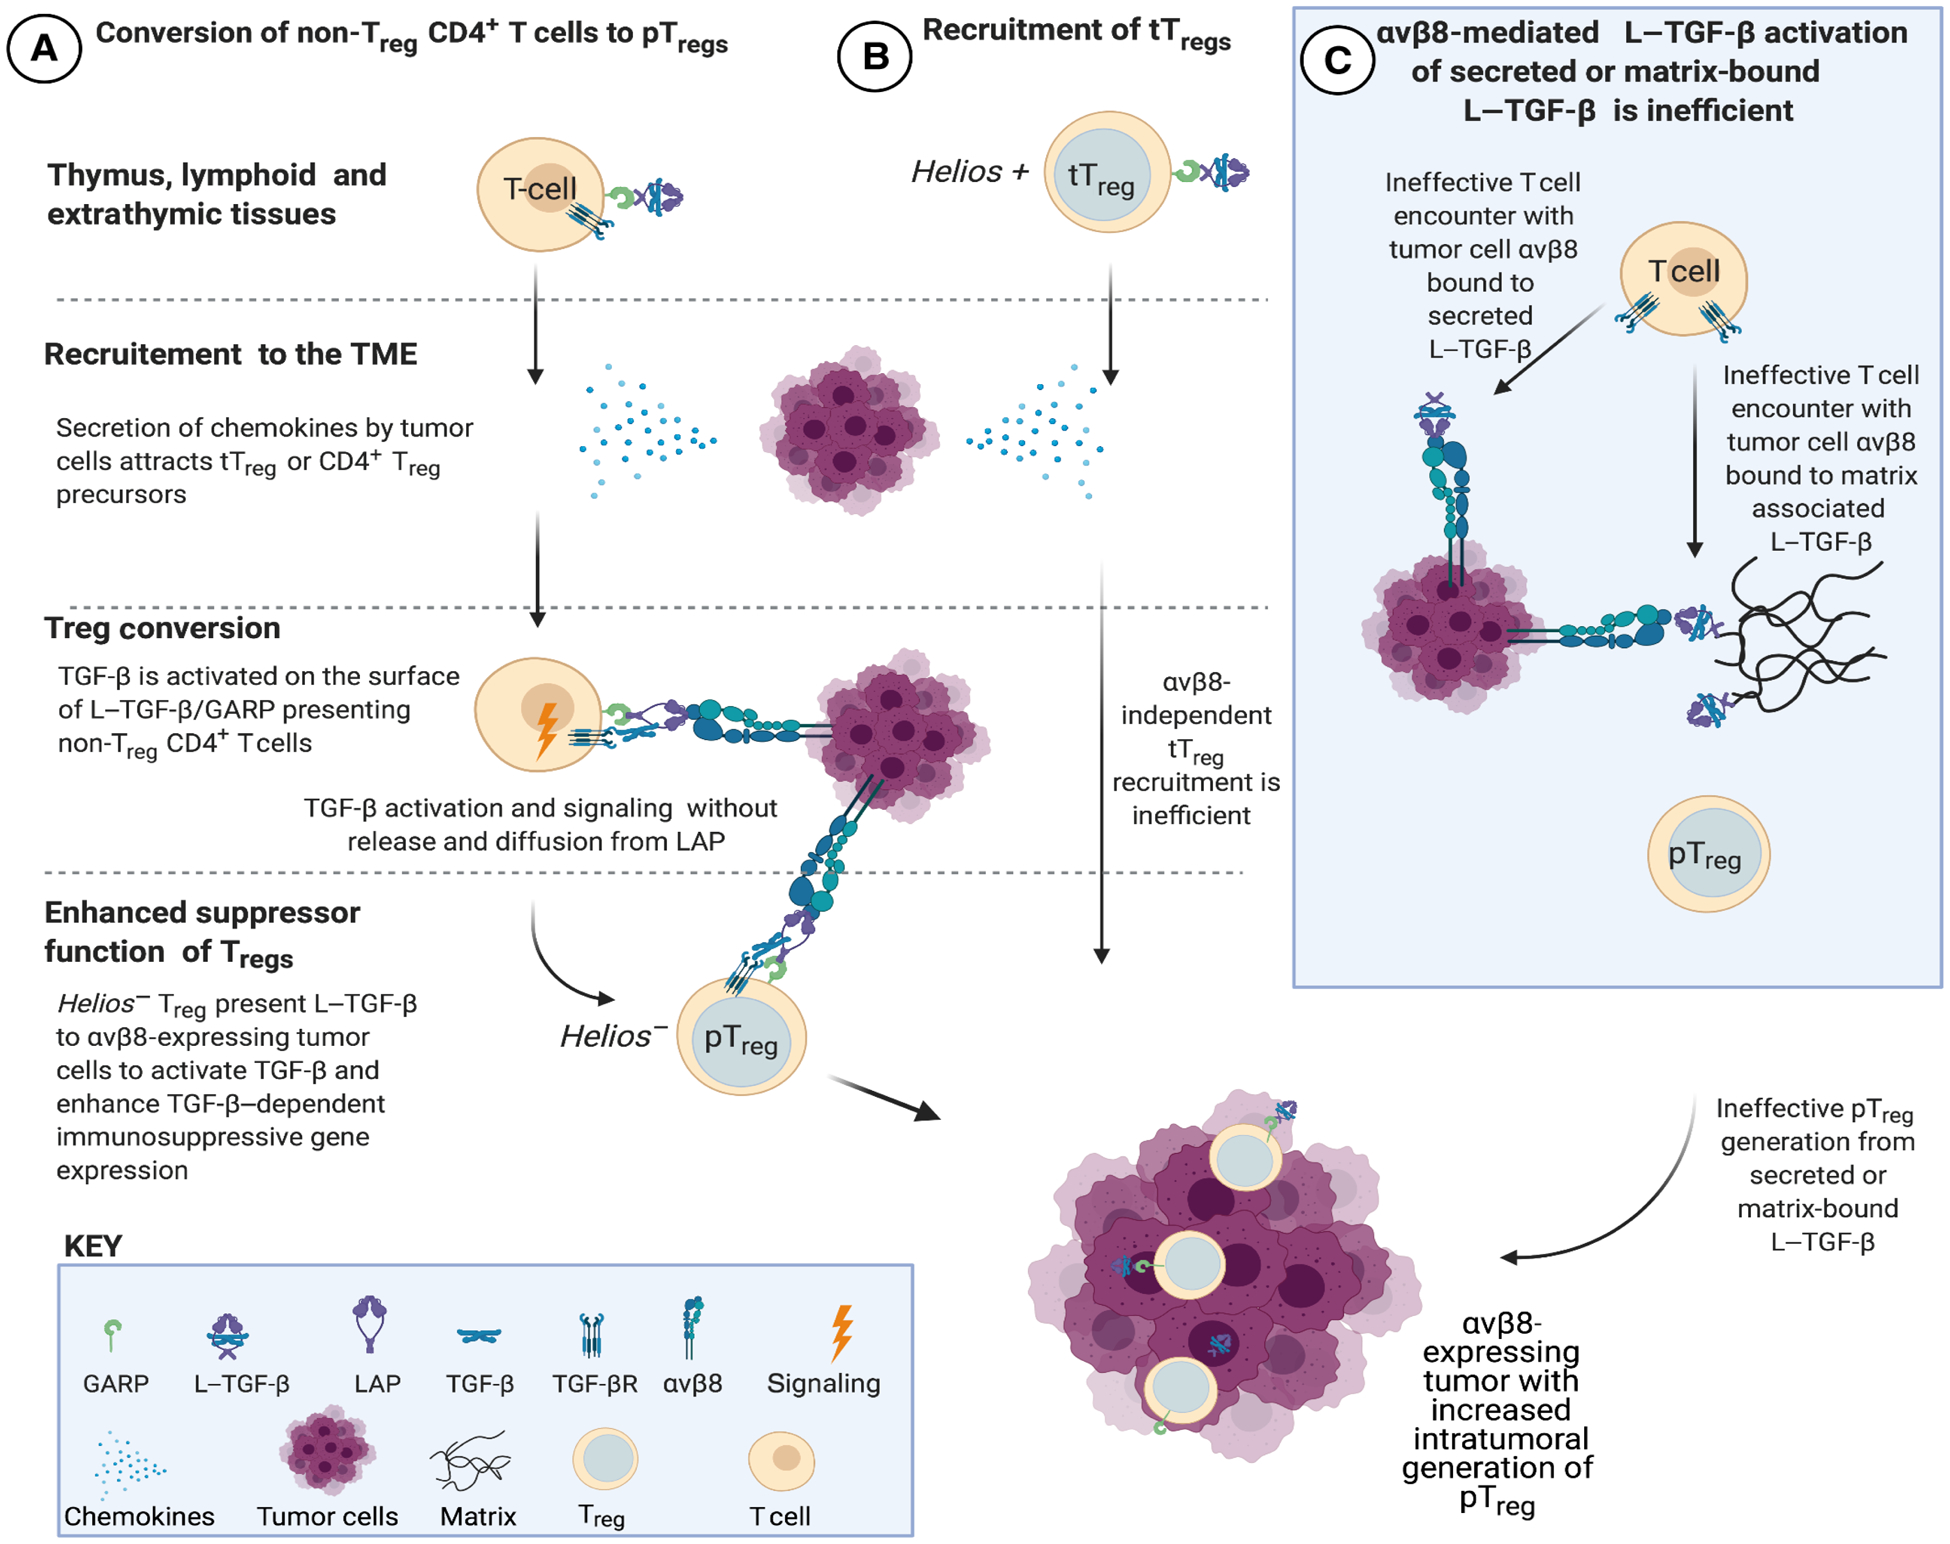
Regulatory T cells (Tregs) that promote tumor immune evasion are enriched in certain tumors and correlate with poor prognosis. However, mechanisms for Treg enrichment remain incompletely understood. We described a mechanism for Treg enrichment in mouse and human tumors mediated by the αvβ8 integrin. Tumor cell αvβ8 bound to latent transforming growth factor-β (L-TGF-β) presented on the surface of T cells, resulting in TGF-β activation and immunosuppressive Treg differentiation in vitro. In vivo, tumor cell αvβ8 expression correlated with Treg enrichment, immunosuppressive Treg gene expression, and increased tumor growth, which was reduced in mice by αvβ8 inhibition or Treg depletion. Structural modeling and cell-based studies suggested a highly geometrically constrained complex forming between αvβ8-expressing tumor cells and L-TGF-β-expressing T cells, facilitating TGF-β activation, independent of release and diffusion, and providing limited access to TGF-β inhibitors. These findings suggest a highly localized tumor-specific mechanism for Treg enrichment.


Figures

Fig. 1.
Fig. 1.. Treg depletion specifically inhibited β8-LLC but not mock-LLC tumor outgrowth.
(A) Cartoon of tumor model. (B) Representative surface staining: anti-β8 (C6D4) or isotype control of mock-LLC or β8-LLC cells. (C to M) Mock-LLC and β8-LLC tumors were established on opposing flanks of C57BL/6 mice. (C to G, I, and L) Mice were treated [7 mg/kg, intraperitoneally (i.p.)] with anti-β8 (C6D4) after tumor establishment. (J and M) Tregs were depleted with anti-CD25 (clone PC-61.5.3) starting 1 day after tumor cell injection. (H and K) Isotype controls. (C and D) Intratumoral Treg numbers (outliers removed) confirmed by immunohistochemistry of FOXP3 of mock (open) or β8-LLC (filled) tumors shown by FOXP3+ cells/tumor surface area I or FOXP3+ cells/tumor (D). Average LLC tumor volumes for mock-LLC (E) and β8-LLC (F), with day 15 tumor weights (G). Corresponding spider plots for mock-LLC (H to J) treated with isotype (H), anti-β8, C6D4 (I), anti-CD25 (J), or β8-LLC treated with isotype (K), anti-β8, C6D4 (L), or anti-CD25 (M). Arrows indicate antibody injection days. (H to M) Cartoons show tumor type (arrow) in accompanying plots. One-way ANOVA was used for multiple comparisons followed by Tukey’s post-test. Student’s unpaired t test was used for comparing two datasets. Shown is SE, *P < 0.05, **P < 0.01, ***P < 0.001, and ****P < 0.0001. ns, not significant.
Fig. 2.
Fig. 2.. Tumor cell expression of αvβ8 drove a distinct immunosuppressive Tregtranscriptome.
(A) Cartoon of model. (B) Gating strategy for FOXP3+CD25+ cells, enumerated in (C) as FOXP3+CD25+ cells/g (outliers removed) of mock (open boxes) or β8-LLC tumors treated with isotype (filled boxes) or anti-β8 (C6D4, filled circles). (D) Bulk RNAseq of sorted pools (9 to 10 mice per group in three pools) of CD4+GFP+ cells. Differential expression plot of 118 most highly expressed genes [>50 average fragments per kilobase million (FKPM)] increased (green) or decreased (red) in expression by at least 30% in Treg groups treated with anti-β8 compared with isotype control or mock-LLC compared with β8-LLC, with Pearson R and two tailed P value. (E) Hierarchal clustering and heatmap of 118 most highly and variably expressed genes shown in (D). Note that Tregs from β8-LLC isotype–treated tumors are distinct (top three rows) from mock or β8-LLC Treg treated with anti-β8 (C6D4). Arrows indicate key genes. For multiple comparisons, one-way ANOVA was used followed by Tukey’s post-test. *P < 0.05 and **P < 0.01.
Fig. 3.
Fig. 3.. Contact of L–TGF-β–presenting non-Treg CD4+ T cells with αvβ8 drove iTreg differentiation.
(A to C) CD4+ mouse splenocytes express L–TGF-β1 on the cell surface. (A) Isotype-matched negative control for (B) CD4+CD25+ FOXP3 T cells and (C) CD4+CD25+ FOXP3+ Treg stained with anti-LAP. (D) L–TGF-β1 surface staining (outlier removed) in CD4+CD25FOXP3, CD4+CD25+FOXP3, and CD4+CD25+ FOXP3+ T cell subsets (brackets above each column indicate comparisons relative to isotype control). (E to G) CD4+ mouse splenocytes undergo iTreg differentiation when cultured on immobilized αvβ8, but not on (I to K) integrin αvβ3, or on (M and N) BSA. (E to K and N) CD4+ splenocytes from FOXP3-IRES-GFP mice were activated [anti-CD3 and interleukin (IL-2)] or (M) not stimulated. (O) As positive control, stimulated CD4+ T cells were treated with supraphysiologic levels of rTGF-β1 (500 pg/ml) (65). Representative experiment (n = 3) depicts CD4+ gated T cells stained with anti-CD25 (x axis) with FOXP3 expression determined by green fluorescent protein (GFP; y axis).Treg (CD4+CD25+ GFP+, upper right quadrant). Gating strategy is shown in fig. S3 (A to D). (E and I) Individual wells were untreated (UT), treated with isotype (F and J), or anti-β8 and C6D4 (1 μg/ml) (G and K). (H) Lower column (n = 3) coating substrate indicated as BSA, αvβ3, or αvβ8. (L) Ctla4, Ikzf2, or Nrp1 expression determined by qPCR demonstrates αvβ8-dependent Treg differentiation under identical culture conditions as in (F, G, J, and K). Results (log10) normalized to αvβ3 controls. Treatment with isotype (open) or C6D4 (vertically striped) are indicated. (P) Activated T cells cocultured with mock or β8-LLC cells significantly increased Treg differentiation compared with coculture with mock-LLC controls. (Q) TGF-β activation over range of αvβ8 coating concentrations reported by WT TMLC (blue), L–TGF-β1–transfected TMLC (red), or L–TGF-β1/GARP–transfected TMLC cells (green). (R) L–TGF-β within conditioned media of Tconv cultured under stimulatory conditions for 48 hours identical to conditions in (N). Reporter cells plated on control substrate αvβ3 or αvβ8 with secreted L–TGF-β. Heat (80°C) activation of conditioned media showed total amount of L–TGF-β present. (S) Transwell assay determined the importance of cell contact in αvβ8-mediated Treg differentiation. αvβ8 was coated on the lower chambers. CD4+ T cells were plated only into the upper chambers under stimulating conditions (IL-2 and anti-CD3). The upper chamber Transwell surface contains 0.4-μm pores, allowing diffusion of soluble mediators from the lower chamber, but not cells. (T) Active rTGF-β added to the medium in the lower chamber demonstrates that TGF-β freely diffuses from the lower to the upper chamber to induce CD25+FOXP3+ Treg differentiation. *P < 0.05 and ***P < 0.001 by one-way ANOVA for multiple comparisons followed by Sidak’s post-test or unpaired Student’s t test to compare two populations.
Fig. 4.
Fig. 4.. ITGB8 was highly expressed in tumor cells, and TGFB1 was highly expressed in immune cells.
(A) Schematic of sorting strategy to purify tumor, stromal, myeloid, CD4+ T cell, and CD4+CD25+CD127lo Treg populations from disaggregated human tumors. (B to G). Bulk RNAseq performed on sorted cell populations from cohorts of human gynecologic (n = 53), non–small cell lung carcinoma (n = 41), or head and neck cancer specimens (n = 38) represented as transcript per million (TPM) (normalized read counts to gene length and scaling 1 × 10⁶). Violin plots of normalized TPM of (B to D) ITGB8 and (E to G) TGFB1 of CD44CD90 tumor cells (gray circles), some of which stain with anti-epithelial cell adhesion molecule (EpCam) (blue filled squares), CD44+CD90+ stromal cells (filled circles), CD4+CD25+ Treg (green) or CD4+ T cells (red), or major histocompatibility complex class II (MHCII+) (human leukocyte antigen DR isotype, HLA-DR+) myeloid cells (purple). All data points were included in the analysis without outlier exclusion and were analyzed for significance by one-way ANOVA for multiple comparisons followed by Dunnett’s post-test; means ± SD. ns, P > 0.05; *P < 0.05, **P < 0.01, ***P < 0.001, and ****P < 0.0001.
Fig. 5.
Fig. 5.. Formation of a localized tumor/T cell αvβ8/L–TGF-β signaling complex.
(A) Cartoon of structure-based model of αvβ8-mediated TGF-β activation and signaling based on structures of αvβ8/L–TGF-β (29, 43), L–TGF-β/GARP (51), and TGF-βR2/TGF-β1 (66). Integrin αv and β8 subunits, latency associated peptide (LAP) of dimeric L–TGF-β (subunit A + B), dimeric TGF-β (subunit A + B), TGF-βR2, and GARP color-coded matching annotations. Integrin and GARP/TGF-βR2 trans-membrane domains span tumor or Treg lipid bilayers, respectively. (B) αvβ8 surface expression in β8-LLC, (C) TRAMP-C2, and (D) OVCAR-3 stained with C6D4 (1 μg/ml) compared with iso-type. (E) Treg differentiation over a range of αvβ8 coating concentrations. Superimposed in red are β8-LLC (red triangle), TRAMP-C2 (red circle), and OVCAR-3 (red square) according to calculated αvβ8 cell surface receptor density. (F to H) WT human L–TGF-β1 or mutant incapable of producing diffusible TGF-β1 [L–TGF-β1(R249A)] expressed alone (square symbols) or coexpressed with human GARP (circles) in TGF-β reporter cells (TMLC) and cocultured with (F) β8-LLC, (G) TRAMP-C2, or (H) OVCAR-3. Outliers (Rout) were removed from (F and G). Shown is TGF-β activation (means ± SEM) determined using rTGF-β standard curve of each TMLC line (n ≥ 6). (I to K) Inhibition curves of anti-β8 (C6D4, blue line) compared with anti–pan–TGF-β (1D11, red line), TGF-βR2–Fc receptor trap (green line), anti-human GARP/L–TGF-β (MHG-8, purple line), or anti-human/mouse TGF-βR2 (clone 8322, orange line) generated using (I) WT human L–TGF-β1/human GARP TMLC, (J) human L–TGF-β1(R249A)/human GARP TMLC or control, and (K) WT TMLC cells with 500 pg of rTGF-β1. Shown is percent inhibition relative to no antibody control. Inhibitor concentrations are shown in μg/ml (log10). (L to P) iTreg differentiation of activated CD4+ T cells from foxp3-IRES-GFP splenocytes on immobilized αvβ8 in the presence of (L) isotype, (M) anti-β8 (C6D4), (N) anti–TGF-β1 (1D11), (O) anti–TGF-βR2 (clone 8322), (P) or TGF-βR2–Fc. (Q) Results enumerated in scatterplots (n ≥ 3). (R) Schematic of Transwell assay showing that diffusible TGF-β has no role in αvβ8-mediated iTreg differentiation. CD4+ T cells plated into upper and lower chambers under stimulating conditions. (S) αvβ8 coated on lower, αvβ3 control on upper, or (T) vice versa. (U) Active rTGF-β added to lower chamber media demonstrating diffusion of rTGF-β into the upper chamber inducing conversion of non-Treg CD4+ T cells (Tconv) to CD25+FOXP3+ Treg. (V) Scatterplots (n = 4) show gated CD4+ T cells stained with anti-CD25 (x axis) with FOXP3 expression determined by GFP (y axis). *P < 0.05, **P < 0.01, and ***P < 0.001 by one-way ANOVA for multiple comparisons followed by Sidak’s post-test.
Fig. 6.
Fig. 6.. Proportion of β8-expressing tumor cells correlated with CD4+ FOXP3+ T cell number in human and murine lung cancer.
Representative images of immunohistochemical staining of human (n = 32) (A to D) or murine (n = 30) tumors (G and H). Immunohistochemical localization of integrin β8 in an independent cohort of human NSCLC with a β8 TPS of (A) <10% compared with (B) a high >50% TPS. Arrows in (B) indicate positively staining tumor cells. (C and D) Multiplex immunohistochemical staining of the same samples shown in (A and B) with anti-CD4 (teal), anti-CD8 (yellow), and anti-FOXP3 (purple). Arrows indicate tumor cells, and arrowheads indicate CD4+FOXP3+ cells. Scale bar, 20 μm. (E) CD4+FOXP3+ density according to TPS cutoffs <5%, 5 to 24%, 25 to 74%, and 75 to 100%. (F) Ratio of CD4+FOXP3+ to all CD4+ cells grouped according to the same cutoffs as in (E) (n = 36). (G and H) Immunohistochemical localization of FOXP3+ cells in (G) mock-LLC compared with (H) β8-LLC tumors. Arrowheads point to examples of stained nuclei. Scale bar, 20 μm. (I) Treg density depends on proportion of β8-expressing tumor cells. β8-LLC cells were mixed with mock-LLC cells in proportions of 1:0 (filled inverted triangles), 1:4 (filled upright triangles), and 1:8 (filled circles) and injected on the left flanks of mice. Mock-LLC (open squares) was injected on the right flank (see cartoon schematic). Shown are Treg (I) surface density (in mm2) and (J) tumor volume (in mm3) in mock-LLC tumors compared with tumors with various ratios of β8-LLC to mock-LLC. For multiple comparisons, one-way ANOVA and P test for trend were used. **P < 0.01, ***P < 0.001, and ****P < 0.0001.
Fig. 7.
Fig. 7.. Proposed mechanisms of Treg enrichment and differentiation in αvβ8-expressing tumors.
(A) Non-Treg CD4+ T cells expressing L–TGF-β/GARP infiltrate tumors in response to chemokines in the TME (21). TGF-β cannot interact with TGF-βR unless it undergoes activation. L–TGF-β/GARP–expressing non-Treg CD4+ T cells undergo Treg conversion to Helios pTreg after binding to integrin αvβ8 expressed by tumor cells. The mechanism of TGF-β activation does not require the release and diffusion of TGF-β, ensuring that only T cells in contact with αvβ8-expressing tumor cells are converted to pTreg (29). (B) Thymically derived Helios+ Treg (tTreg) can potentially be recruited to the TME, but this is not evident in αvβ8-expressing tumors. (C) When L–TGF-β is soluble or matrix bound, TGF-βRs are not positioned on the same surface as L–TGF-β. Thus, if active TGF-β is not released from L–TGF-β when exposed to αvβ8 bearing tumor cells, then TGF-βR–expressing T cells need to find, orient, and overcome steric hindrance to bind to TGF-β exposed within the L–TGF-β complex. This activation process is less efficient than when L–TGF-β and TGF-βRs are on the same surface (29). Therefore, soluble or matrix-bound L–TGF-β is less likely to significantly contribute to αvβ8-mediated pTreg conversion in the TME. Created in BioRender.

Similar articles

Cited by

References

    1. Fridman WH, Pagès F, Sautès-Fridman C, Galon J, The immune contexture in human tumours: Impact on clinical outcome. Nat. Rev. Cancer 12, 298–306 (2012). - PubMed
    1. Curiel TJ, Coukos G, Zou L, Alvarez X, Cheng P, Mottram P, Evdemon-Hogan M, Conejo-Garcia JR, Zhang L, Burow M, Zhu Y, Wei S, Kryczek I, Daniel B, Gordon A, Myers L, Lackner A, Disis ML, Knutson KL, Chen L, Zou W, Specific recruitment of regulatory T cells in ovarian carcinoma fosters immune privilege and predicts reduced survival. Nat. Med 10, 942–949 (2004). - PubMed
    1. Curiel TJ, Tregs and rethinking cancer immunotherapy. J. Clin. Invest 117, 1167–1174 (2007). - PMC - PubMed
    1. Shimizu J, Yamazaki S, Sakaguchi S, Induction of tumor immunity by removing CD25+CD4+ T cells: A common basis between tumor immunity and autoimmunity. J. Immunol 163, 5211–5218 (1999). - PubMed
    1. Onizuka S, Tawara I, Shimizu J, Sakaguchi S, Fujita T, Nakayama E, Tumor rejection by in vivo administration of anti-CD25 (interleukin-2 receptor α) monoclonal antibody. Cancer Res. 59, 3128–3133 (1999). - PubMed

Publication types

MeSH terms