. 2021 Mar 30;118(13):e2015855118.
doi: 10.1073/pnas.2015855118.

Primate innate immune responses to bacterial and viral pathogens reveals an evolutionary trade-off between strength and specificity

Affiliations

Primate innate immune responses to bacterial and viral pathogens reveals an evolutionary trade-off between strength and specificity

Mohamed B F Hawash et al. Proc Natl Acad Sci U S A. .

Abstract

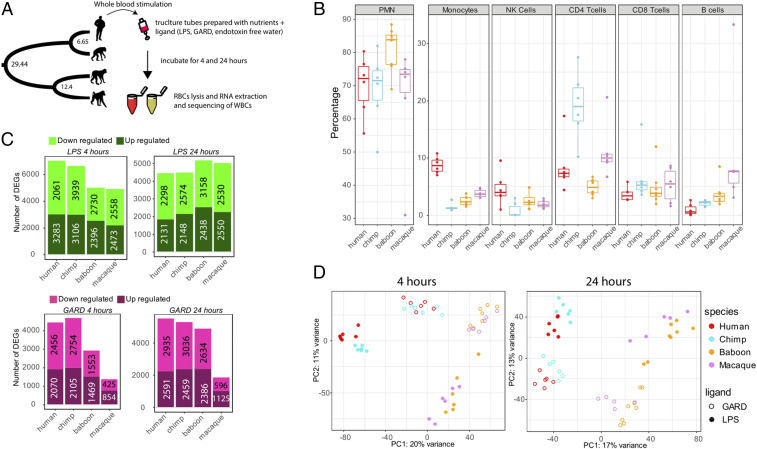
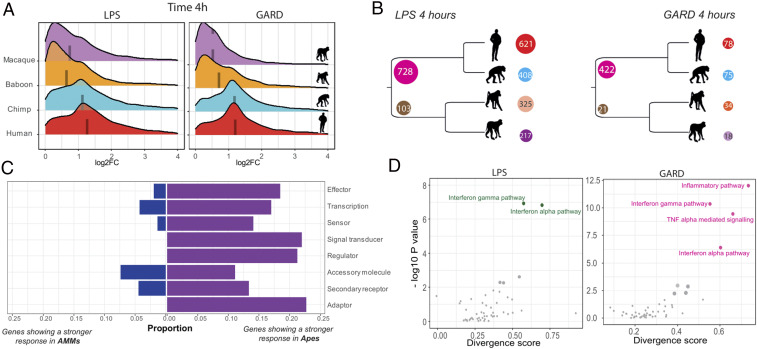
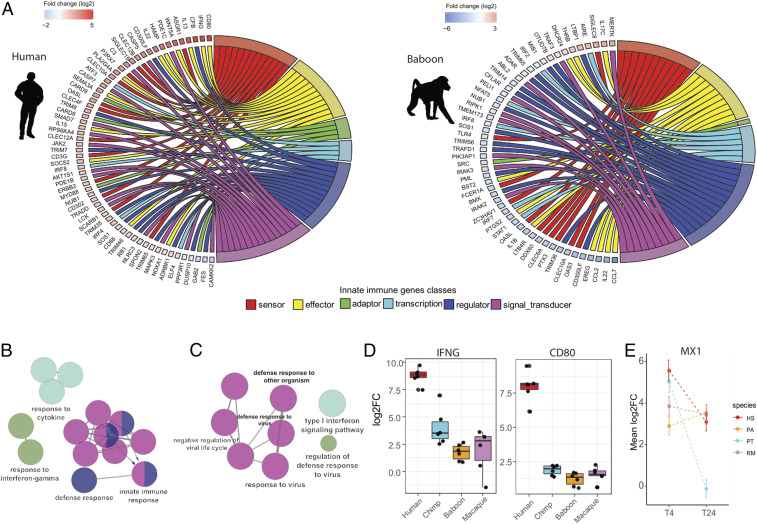
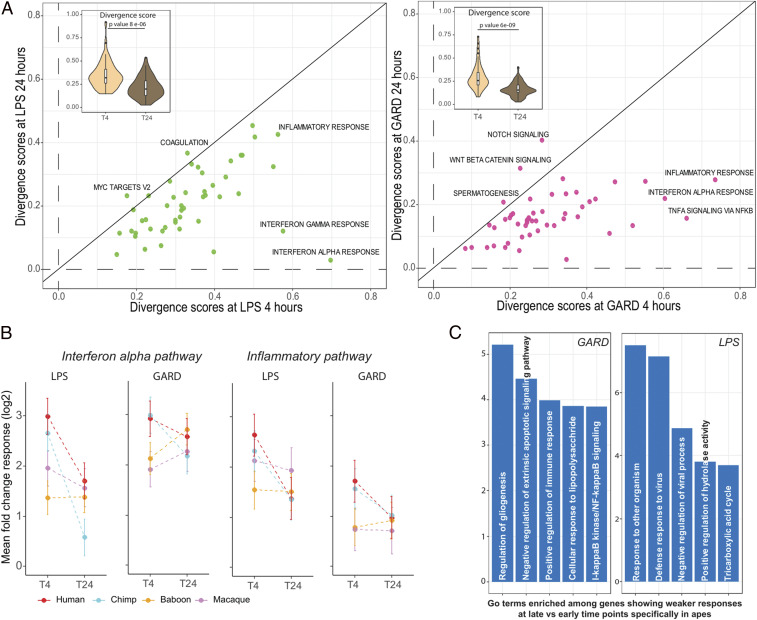
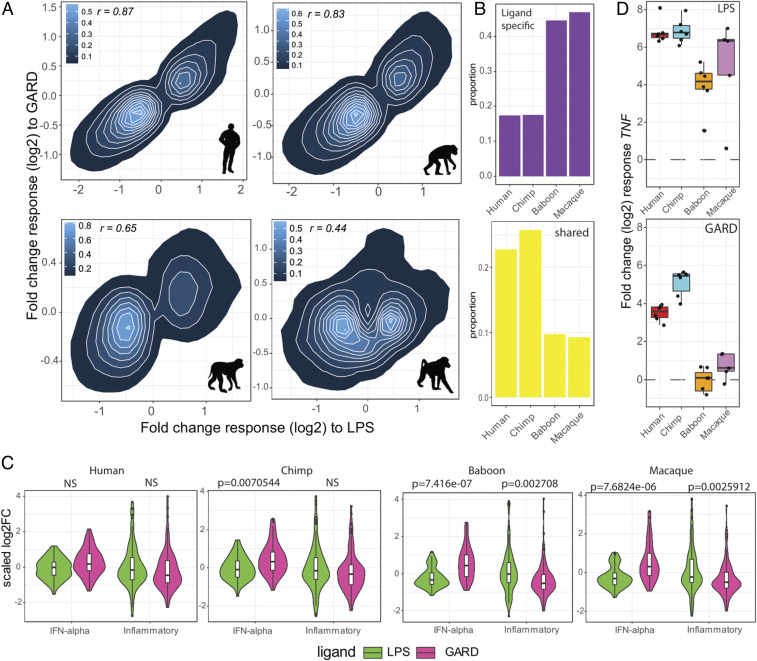
Despite their close genetic relatedness, apes and African and Asian monkeys (AAMs) differ in their susceptibility to severe bacterial and viral infections that are important causes of human disease. Such differences between humans and other primates are thought to be a result, at least in part, of interspecies differences in immune response to infection. However, because of the lack of comparative functional data across species, it remains unclear in what ways the immune systems of humans and other primates differ. Here, we report the whole-genome transcriptomic responses of ape species (human and chimpanzee) and AAMs (rhesus macaque and baboon) to bacterial and viral stimulation. We find stark differences in the responsiveness of these groups, with apes mounting a markedly stronger early transcriptional response to both viral and bacterial stimulation, altering the transcription of ∼40% more genes than AAMs. Additionally, we find that genes involved in the regulation of inflammatory and interferon responses show the most divergent early transcriptional responses across primates and that this divergence is attenuated over time. Finally, we find that relative to AAMs, apes engage a much less specific immune response to different classes of pathogens during the early hours of infection, up-regulating genes typical of anti-viral and anti-bacterial responses regardless of the nature of the stimulus. Overall, these findings suggest apes exhibit increased sensitivity to bacterial and viral immune stimulation, activating a broader array of defense molecules that may be beneficial for early pathogen killing at the potential cost of increased energy expenditure and tissue damage.

Keywords: early immune responses to infection; gram-negative bacteria; immunodeficiency viruses; pathogen-associated molecular patterns; primate evolution.


Conflict of interest statement

The authors declare no competing interest.

Figures

Fig. 1.
Fig. 1.
Characterizing innate immune response upon viral and bacterial stimulation of primate white blood cells. (A) Schematic representation of the study design. Whole-blood samples from humans, common chimpanzees, rhesus macaques, and olive baboons were stimulated with bacterial or viral stimuli via venous draw directly into a media culture tube containing either LPS, single-stranded RNA viral mimetic GARD, or endotoxin-free water, as a negative control (Control). At 4 and 24 h poststimulation, white blood cells were isolated, and RNA was extracted for RNA-seq. (B) Cell proportions of six populations of leukocytes for all species. Species are indicated on x-axis, and proportions of this population from total leukocytes are on y-axis. PMNs, polymorphonuclear cells; NK, Natural killer cells. (C) Number of differentially expressed genes (DEGs; FDR < 0.05) in response to LPS (Top) and GARD (Bottom) in each of the species at 4 and 24 h poststimulation. The exact number of up- and down-regulated genes in each condition in each species are indicated on the bar charts. (D) Principal component (PC) analysis performed on the log2 fold-change responses observed at 4 h post-LPS and GARD stimulation. PC1 primarily separates apes (human and chimpanzee) from AAM (macaque and baboon), and PC2 captures differences in immune response to bacterial or viral stimulation.
Fig. 2.
Fig. 2.
Stronger early innate immune response in apes than monkeys. (A) For each combination of stimulus and time point, we show the distribution of the log2 fold changes (x-axis) among genes that respond to that treatment in at least one of the species. The median log2 fold-change responses in each species is represented by a dashed line. (B) Number of DRGs that are clade- or species-specific differently regulated genes at 4 h post-LPS (Left) and GARD (Right) stimulation. For c-DRG, we report the number of genes that show a stronger response in a specific clade at the beginning of the ancestral branch of the tree. For example, in response to LPS, we identified 831 c-DRGs from which 728 show a stronger response in apes and 103 in AAMs. For species-specific responsive genes, numbers are given in front of each species. The color codes for each species are red for human, cyan for chimp, orange for baboon, and violet for macaque. (C) Bar plots represent the proportions of different classes of innate immunity genes that are classified as c-DRGs with a higher response in apes (dark violet) or in AAMs (dark blue). (D) Scatter plot displaying total divergence scores of hallmark pathways for LPS (green) and GARD (pink) at 4 h stimulations. For a given pathway, the total divergence is given by divergence score (DS) on the x-axis and −log10 P values for each DS is on the y-axis. The pathways names, DS values, and corresponding P values are shown in Dataset S6. We highlight the pathways showing the most significant divergence scores for both the response to LPS and GARD.
Fig. 3.
Fig. 3.
Species-specific immune response reflects unique immune regulation mechanisms and lineage-specific divergence. (A) Circos plots showing different classes of innate immune genes (clustered using different color codes) classified as species-specific responsive at 4 h post-LPS stimulation in humans (Left) and baboons (Right). The log2FC key represent the average difference between species response versus all other species in which the positive (red color) and negative (blue) values indicate the magnitude of the stronger and weaker absolute response in this species versus all others, respectively. (B) GO enrichment analysis for genes showing a weaker response to LPS at 4 h in baboons as compared to all other species. (C) GO enrichment analysis for genes showing a weaker response to LPS at 24 h in chimpanzees as compared to all other species. For B and C only, top GO terms are presented. The full list of significant GO terms can be found in Dataset S10. (D) Boxplot represents the log2FC of IFN-γ and CD80 genes which, at 4 h post-LPS stimulation, were found to have a significantly stronger response in human than in other primates. (E) Estimates of the mean fold-changes response for MX1 (± SE) at the two time points across the four primate species studied.
Fig. 4.
Fig. 4.
Divergence of immune response is reduced at later time point. (A) Scatter plots of divergence scores of hallmark pathways at early (x-axis) and later time points (y-axis) for LPS (green) and GARD (maroon) stimulations. The inset boxplots contrast the distribution of divergence scores among all pathways between the two time points. P values were obtained using Mann–Whitney U test. (B) Estimates of the mean response at the two time points for each species (± SE) across genes bellowing to the interferon alpha and inflammatory response hallmark pathways. (C) GO enrichment analysis for genes that showed significant decrease in response in apes only (FDR < 0.05 in apes and FDR > 0.05 in monkeys) for LPS and GARD. Top significant GO terms are given as indicated by −log10 P value on the x-axis.
Fig. 5.
Fig. 5.
Apes engage a less-specific innate immune response than AAMs. (A) Correlation plots of the magnitude of the fold-change responses between LPS (x-axis) and GARD-stimulated cells (y-axis). For each of the species, we only include genes that were differentially expressed (FDR < 0.05) in response to at least one of the stimuli (N = 7,862, 7,874, 6,585, and 5,430 genes for human, chimp, baboon, and macaque, respectively). High correlation was found in apes (∼0.85), while modest correlation was found in baboon (0.44) and moderate in macaque (0.65). (B) Proportion of ligand-specific (i.e., genes that respond uniquely to either bacterial or viral stimuli) and shared genes (i.e., genes equally activated by both immune stimuli) across species. (C) Violin plots comparing (scaled) log2 fold-change responses to 4 h of LPS and GARD stimulation between genes belonging the hallmark pathways “Interferon (IFN) alpha” and “inflammatory response.” The P values shown have been Bonferroni corrected for the number of tests performed. NS, nonsignificant (i.e., P > 0.05). (D) Boxplots of the log2 fold-change response (y-axis) of TNF in response to LPS and GARD stimulations across primates.

Comment in

References

    1. Redl H., Bahrami S., Schlag G., Traber D. L., Clinical detection of LPS and animal models of endotoxemia. Immunobiology 187, 330–345 (1993). - PubMed
    1. Munford R. S., Sensing gram-negative bacterial lipopolysaccharides: A human disease determinant? Infect. Immun. 76, 454–465 (2008). - PMC - PubMed
    1. Chahroudi A., Bosinger S. E., Vanderford T. H., Paiardini M., Silvestri G., Natural SIV hosts: Showing AIDS the door. Science 335, 1188–1193 (2012). - PMC - PubMed
    1. Sandmann L., Ploss A., Barriers of hepatitis C virus interspecies transmission. Virology 435, 70–80 (2013). - PMC - PubMed
    1. Vaure C., Liu Y., A comparative review of toll-like receptor 4 expression and functionality in different animal species. Front. Immunol. 5, 316 (2014). - PMC - PubMed

Publication types

MeSH terms