

Short-term forecasts of expected deaths
- PMID: 33771934
- PMCID: PMC8053952
- DOI: 10.1073/pnas.2025324118
Short-term forecasts of expected deaths
Abstract
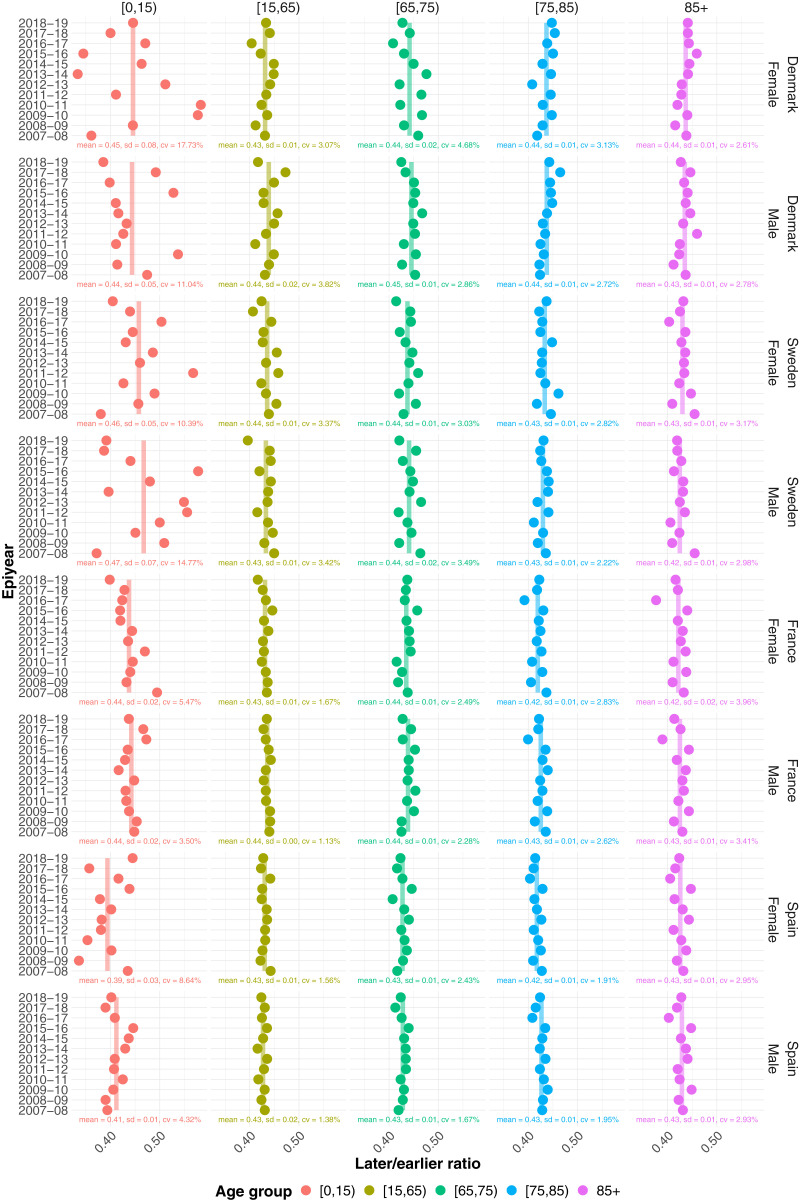
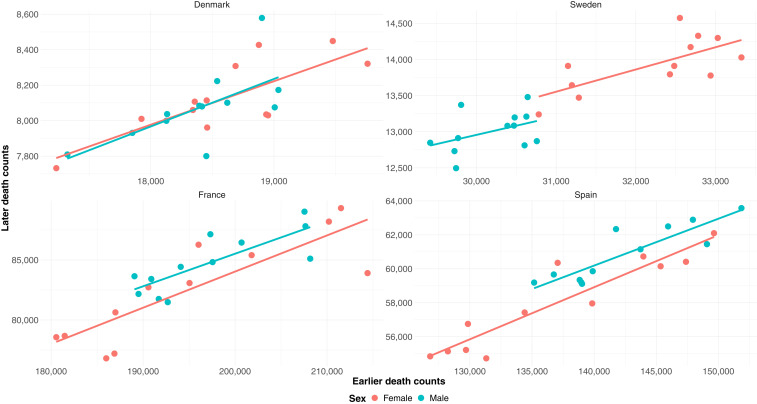
We introduce a method for making short-term mortality forecasts of a few months, illustrating it by estimating how many deaths might have happened if some major shock had not occurred. We apply the method to assess excess mortality from March to June 2020 in Denmark and Sweden as a result of the first wave of the coronavirus pandemic; associated policy interventions; and behavioral, healthcare, social, and economic changes. We chose to compare Denmark and Sweden because reliable data were available and because the two countries are similar but chose different responses to COVID-19: Denmark imposed a rather severe lockdown; Sweden did not. We make forecasts by age and sex to predict expected deaths if COVID-19 had not struck. Subtracting these forecasts from observed deaths gives the excess death count. Excess deaths were lower in Denmark than Sweden during the first wave of the pandemic. The later/earlier ratio we propose for shortcasting is easy to understand, requires less data than more elaborate approaches, and may be useful in many countries in making both predictions about the future and the past to study the impact on mortality of coronavirus and other epidemics. In the application to Denmark and Sweden, prediction intervals are narrower and bias is less than when forecasts are based on averages of the last 5 y, as is often done. More generally, later/earlier ratios may prove useful in short-term forecasting of illnesses and births as well as economic and other activity that varies seasonally or periodically.
Keywords: Denmark and Sweden; coronavirus pandemic; excess deaths; mortality forecasting; short-term forecasting.
Copyright © 2021 the Author(s). Published by PNAS.
Conflict of interest statement
The authors declare no competing interest.
Figures
References
-
- Chatfield C., The Analysis of Time Series (Chapman & Hall/CRC, ed. 6, 2004).
-
- Dickey D. A., Fuller W. A., Distribution of the estimators for autoregressive time series with a unit root. J. Am. Stat. Assoc. 74, 427–431 (1979).
-
- Kwiatkowski D., Phillips P. C., Schmidt P., Shin Y., Testing the null hypothesis of stationarity against the alternative of a unit root: How sure are we that economic time series have a unit root? J. Econom. 54, 159–178 (1992).
-
- Beaumont C., Short-term forecasting: An introduction to the box-jenkins approach. J. Oper. Res. Soc. 34, 1017–1018 (1983).
-
- Booth H., Tickle L., Mortality modelling and forecasting: A review of methods. Ann. Actuarial Sci. 3, 3–43 (2008).
Publication types
MeSH terms
LinkOut - more resources
Full Text Sources
Other Literature Sources
Medical
Miscellaneous
