. 2021 Mar 26;12(1):1904.
doi: 10.1038/s41467-021-22214-z.

Hospital load and increased COVID-19 related mortality in Israel

Affiliations

Hospital load and increased COVID-19 related mortality in Israel

Hagai Rossman et al. Nat Commun. .

Abstract

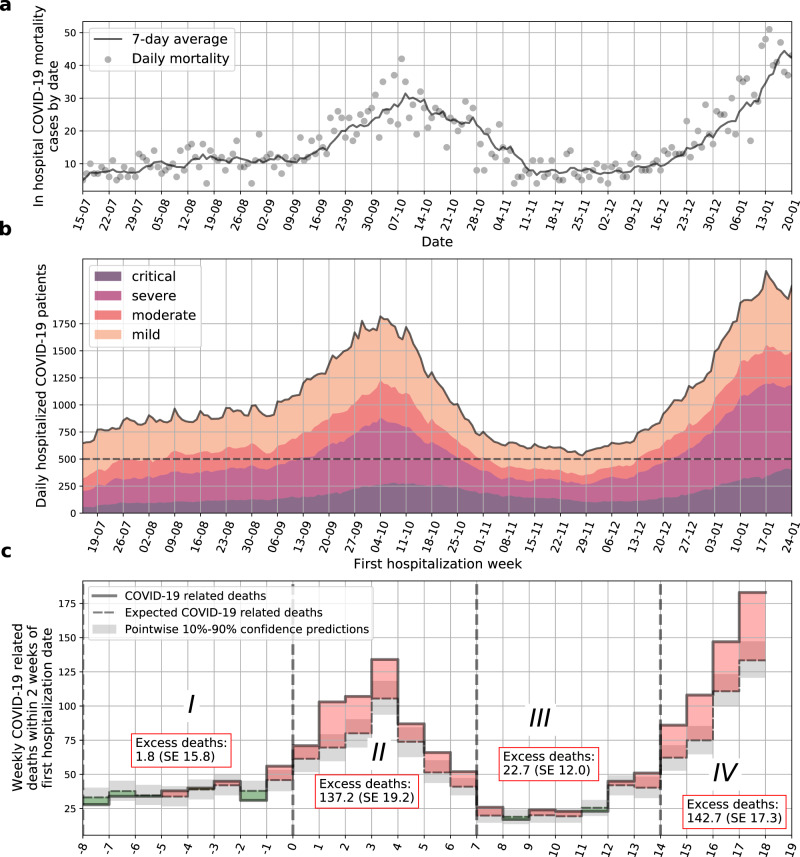
The spread of Coronavirus disease 19 (COVID-19) has led to many healthcare systems being overwhelmed by the rapid emergence of new cases. Here, we study the ramifications of hospital load due to COVID-19 morbidity on in-hospital mortality of patients with COVID-19 by analyzing records of all 22,636 COVID-19 patients hospitalized in Israel from mid-July 2020 to mid-January 2021. We show that even under moderately heavy patient load (>500 countrywide hospitalized severely-ill patients; the Israeli Ministry of Health defined 800 severely-ill patients as the maximum capacity allowing adequate treatment), in-hospital mortality rate of patients with COVID-19 significantly increased compared to periods of lower patient load (250-500 severely-ill patients): 14-day mortality rates were 22.1% (Standard Error 3.1%) higher (mid-September to mid-October) and 27.2% (Standard Error 3.3%) higher (mid-December to mid-January). We further show this higher mortality rate cannot be attributed to changes in the patient population during periods of heavier load.


Conflict of interest statement

The authors declare no competing interests.

Figures

Fig. 1
Fig. 1. Hospital load and increased COVID-19 related mortality.
a In hospital COVID-19 related mortality cases by date. Daily mortality is marked by gray circles, and a 7-day average is plotted as a solid line. b Number of COVID-19-related hospitalizations by day in all hospitals in Israel. Colors depict different clinical states. A threshold of 500 severe and critical patients per day is presented by a dashed horizontal line. Dashed vertical lines separate weeks which are over/under this threshold. c COVID-19 related deaths for sets of patients that were first hospitalized in different weeks. Observed deaths for each week are marked by a solid line. Expected deaths as predicted from the model are marked in dashed black line. Monte-Carlo-based pointwise 10–90% confidence predictions are marked in gray. Weeks in which excess deaths were observed (positive difference between true and expected curves) are filled in red; and weeks in which deaths were overestimated (negative difference between true and expected curves) are filled in green. X-axis is marked by the week number. SE standard error.
Fig. 2
Fig. 2. Cumulative expected and observed COVID-19 in-hospital deaths by week of first hospitalization.
Each sub-figure presents curves for the set of patients first hospitalized in a given week. Black curves are expected deaths with orange bands representing Monte-Carlo-based pointwise 10–90% confidence predictions. Blue and green curves are actual deaths for weekly sets of patients. Blue curves are drawn for patients which the model was trained on (weeks −8 to −1), and green curves are drawn for patients which the model was not trained on (weeks 0–18).
Fig. 3
Fig. 3. Multistate model.
Patients disease course transitions between 5 possible clinical states: mild or moderate, severe, critical, discharged, and deceased. Each transition was modeled using a set of Cox regression models, adjusting for right censoring, recurrent events, competing events, left truncation, and time-dependent covariates.

References

    1. WHO. WHO Coronavirus Disease (COVID-19) Dashboard | WHO Coronavirus Disease (COVID-19) Dashboardhttps://covid19.who.int/ (2021).
    1. Odone A, Delmonte D, Scognamiglio T, Signorelli C. COVID-19 deaths in Lombardy, Italy: data in context. Lancet Public Health. 2020;5:e310. doi: 10.1016/S2468-2667(20)30099-2. - DOI - PMC - PubMed
    1. Peters AW, Chawla KS, Turnbull ZA. Transforming ORs into ICUs. N. Engl. J. Med. 2020;382:e52. doi: 10.1056/NEJMc2010853. - DOI - PMC - PubMed
    1. Miller D, et al. Full genome viral sequences inform patterns of SARS-CoV-2 spread into and within Israel. Nat. Commun. 2020;11:5518. doi: 10.1038/s41467-020-19248-0. - DOI - PMC - PubMed
    1. The Times of Israel. Israel has highest rate in world of new coronavirus infections per capita – TVhttps://www.timesofisrael.com/israel-has-highest-rate-in-world-of-new-co... (2020).

Publication types