. 2021 Mar 26;12(1):1920.
doi: 10.1038/s41467-021-22101-7.

The oncogene AAMDC links PI3K-AKT-mTOR signaling with metabolic reprograming in estrogen receptor-positive breast cancer

Affiliations

The oncogene AAMDC links PI3K-AKT-mTOR signaling with metabolic reprograming in estrogen receptor-positive breast cancer

Emily Golden et al. Nat Commun. .

Abstract

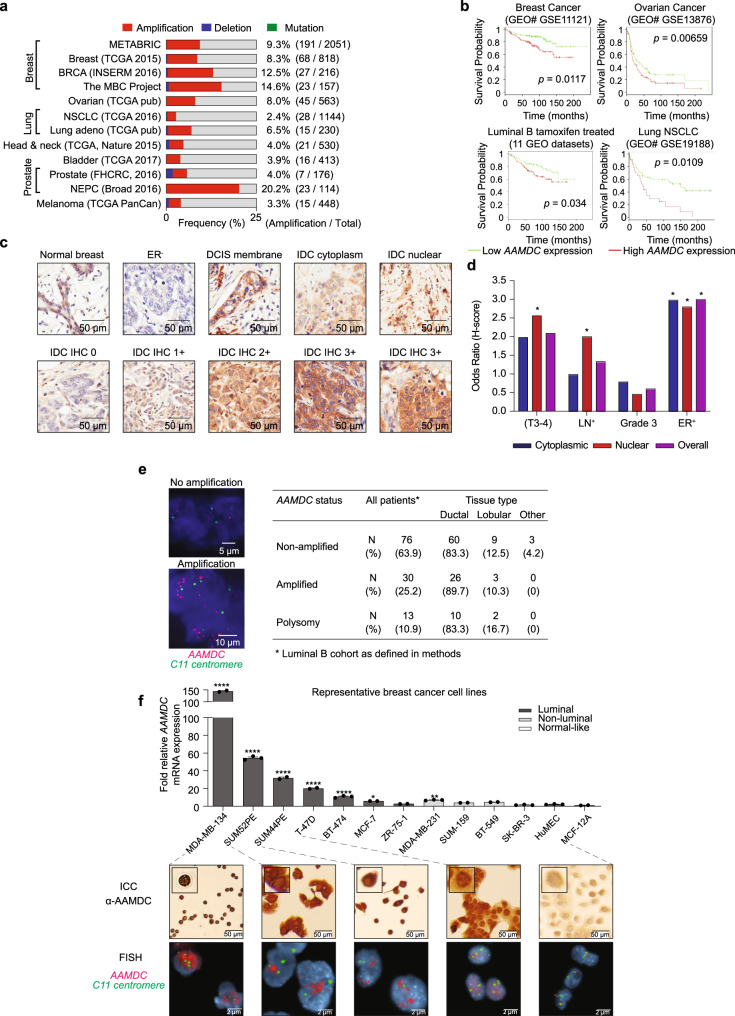
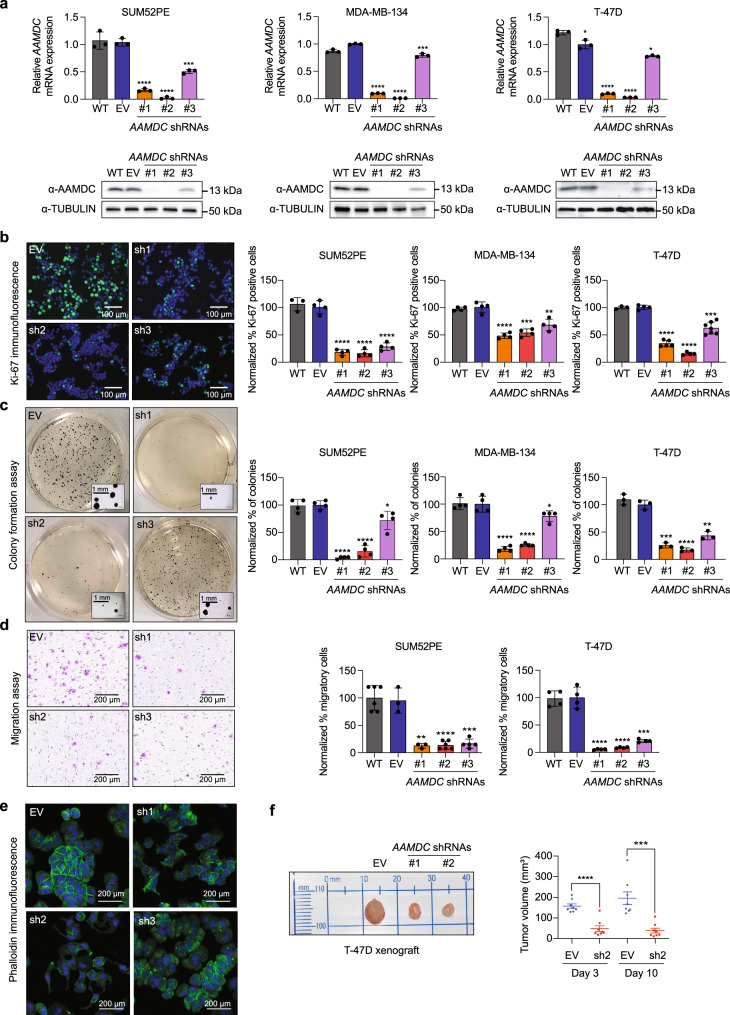
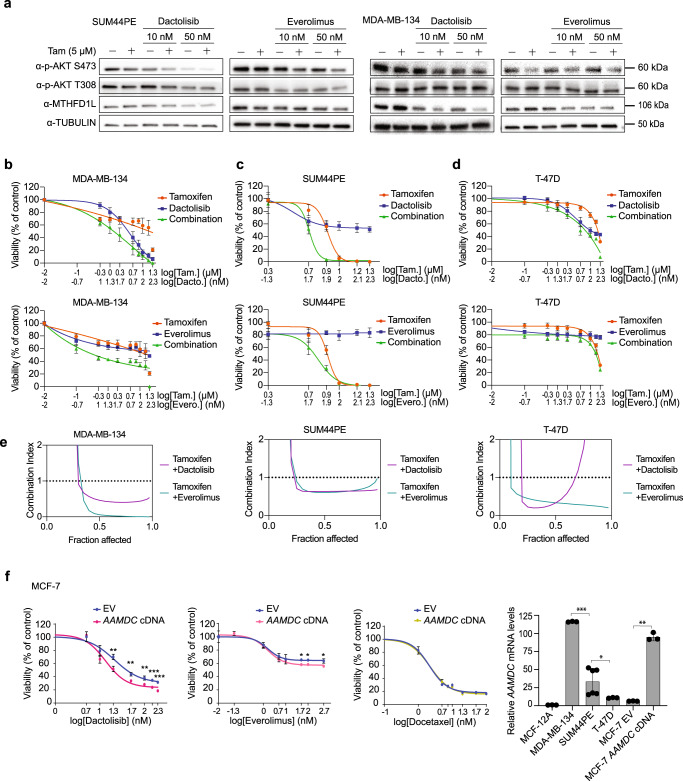
Adipogenesis associated Mth938 domain containing (AAMDC) represents an uncharacterized oncogene amplified in aggressive estrogen receptor-positive breast cancers. We uncover that AAMDC regulates the expression of several metabolic enzymes involved in the one-carbon folate and methionine cycles, and lipid metabolism. We show that AAMDC controls PI3K-AKT-mTOR signaling, regulating the translation of ATF4 and MYC and modulating the transcriptional activity of AAMDC-dependent promoters. High AAMDC expression is associated with sensitization to dactolisib and everolimus, and these PI3K-mTOR inhibitors exhibit synergistic interactions with anti-estrogens in IntClust2 models. Ectopic AAMDC expression is sufficient to activate AKT signaling, resulting in estrogen-independent tumor growth. Thus, AAMDC-overexpressing tumors may be sensitive to PI3K-mTORC1 blockers in combination with anti-estrogens. Lastly, we provide evidence that AAMDC can interact with the RabGTPase-activating protein RabGAP1L, and that AAMDC, RabGAP1L, and Rab7a colocalize in endolysosomes. The discovery of the RabGAP1L-AAMDC assembly platform provides insights for the design of selective blockers to target malignancies having the AAMDC amplification.


Conflict of interest statement

A.R. acts in an advisory capacity to Pfizer (who make an mTOR inhibitor and a CDK 4/6 inhibitor), Novartis (who make a CDK 4/6 inhibitor) as well as AstraZeneca and Roche. J.C. is an employee of oNKo-Innate Pty Ltd. K.P. received funding from Promega, BMG Labtech, and Dimerix as ARC Linkage Grant participating organizations. These participating organizations played no role in any aspect of the conception or design of the research, collection, analysis, and interpretation of the results, or writing and editing of the paper. K.P. is the chief scientific advisor of Dimerix, of which he maintains a shareholding. All other authors declare no competing interests.

Figures

Fig. 1
Fig. 1. AAMDC overexpression and amplification are associated with a subgroup of ER+ breast cancer with poor prognosis.
a Analysis of somatic alterations of AAMDC using cancer genomic data sets and tools available from cBioPortal (see “Methods”). The frequency of amplification is shown as a percentage and the sample numbers are shown in brackets. METABRIC Molecular Taxonomy of Breast Cancer International Consortium, TCGA The Cancer Genome Atlas, BRCA Breast Cancer, INSERM Institut national de la santé et de la recherche médicale, MBC Metastatic Breast Cancer, NSCLC non-small-cell lung carcinoma, FHCRC Fred Hutchinson Cancer Research Center, NEPC National Environment Protection Council, PanCan Pan-Cancer. b Kaplan–Meier survival plots for patients with tumors expressing high (red) or low (green) levels of AAMDC mRNA. The lower left plots correspond to luminal B tumors treated with tamoxifen (see “Methods”). The p value shown for each plot is determined by the log-rank test. GEO Gene Expression Omnibus, GSE genomic spatial event, NSCLC non-small-cell lung carcinoma. c Localization of the AAMDC protein in tumors from a breast tissue microarray (TMA) assessed by immunohistochemistry (IHC). Representative IHC sections of normal breast tissue, estrogen receptor-negative (ER) tumor tissue, ductal carcinoma in situ (DCIS), and invasive ductal carcinoma (IDC) are shown. 0, 1+, 2+, 3+ indicate the staining intensity score. d Associations between AAMDC expression (IHC) and lymph node metastasis (LN+) as well as tumor grade, tumor size (T3-4), and ER positivity (ER+) by AAMDC localization from the same TMA. Statistical significance is indicated by Chi-square analysis with a one-tailed p-value relative to ER tissue. For T3-4: *p = 0.03; for LN+: *p = 0.03; for ER+, from left to right: *p = 0.003, *p = 0.005, *p = 0.005. n = 60 biologically independent samples. Full details of the TMA are provided in Supplementary Table 1. e Frequency of AAMDC amplification/polysomy in a cohort of 119 luminal B breast cancer specimens. Representative fluorescence in situ hybridization (FISH) images are indicated, with specific probes for AAMDC (red) and Centromere enumeration 11 probe for chromosome 11 (C11, green). The full clinical and pathological features of these tumors are shown in Supplementary Data 1. f Real-time expression analyses (qRT-PCR) of AAMDC in luminal, non-luminal, and normal-like breast cells. Significance levels are determined relative to MCF-12A by Ordinary one-way ANOVA with Dunnett multiple comparison test. Data are presented as mean values ± SEM (*p = 0.0217, **p = 0.0018, ****p < 0.0001). n = 3 biologically independent RNA extractions. Representative images of immunocytochemistry (ICC) and FISH of selected luminal cell lines are presented. HuMECs non-transformed human mammary epithelial cells.
Fig. 2
Fig. 2. AAMDC knockdown in luminal breast cancer cells inhibits tumorigenic and migratory capacity.
a Detection of AAMDC expression in luminal breast cancer cells with the AAMDC amplification (SUM52PE and MDA-MB-134) or the chromosome 11 polysomy (T-47D). Cells were transduced with either the AAMDC shRNAs #1–#3 or with empty vector (EV) and processed by qRT-PCR (top) and immunoblotting (bottom). Wild-type (WT) indicates untransduced cells. Data are normalized to the EV control and presented as mean values ± SD. p-values are determined by two-tailed unpaired t-test (SUM52PE: ***p = 0.0003, ****p < 0.0001; MDA-MB-134: ***p = 0.0004, ****p < 0.0001; T-47D: *p = 0.0142 and *p = 0.0107 for EV and shRNA #3 respectively, ****p < 0.0001). n = 3 biologically independent experiments. Source data are provided as a Source Data file. b Cell proliferation assessed by α-Ki-67 immunostaining (green), superimposed on nuclear Hoechst 33258 staining (blue). Data are normalized to the EV and presented as mean values ± SD. p-values are determined by two-tailed unpaired t-test (SUM52PE: ****p < 0.0001; MDA-MB-134: **p = 0.0044, ***p = 0.0002, ****p < 0.0001; T-47D: ***p = 0.0001, ****p < 0.0001). n = 3 biologically independent experiments. c Inhibition of anchorage-independent cell growth by depletion of AAMDC expression assessed by soft agar colony formation assay 28 days after transduction. Data are normalized to the EV and presented as mean values ± SD. p-values are determined by two-tailed unpaired t-test (SUM52PE: *p = 0.0235, ****p < 0.0001; MDA-MB-134: *p = 0.0466, ****p < 0.0001; T-47D: **p = 0.0010, ***p = 0.0002, ****p < 0.0001). n = 3 biologically independent experiments. d Inhibition of cell migration as assessed by Boyden migration chamber assays 24 h after transduction. Data are normalized to the EV and presented as mean values ± SD. p-values are determined by two-tailed unpaired t-test (SUM52PE: **p = 0.0036, ***p = 0.0004, ****p < 0.0001; T-47D: ***p = 0.0002, ****p < 0.0001). n = 3 biologically independent experiments. e Effect of the AAMDC knockdown (KD) on F-actin organization assessed by phalloidin fluorescence staining (Alexa Fluor 488, green), nuclei (Hoechst 33258, blue). In (be), representative images of SUM52PE cells transduced with EV or AAMDC shRNAs #1–#3 (sh1–3) are shown (left). In (ad), quantification for each cell line transduced with empty vector (EV, blue), shRNA #1 (orange), shRNA #2 (red), shRNA #3 (lilac), and untransduced (WT, gray). f Tumor growth inhibition in vivo by AAMDC KD in the T-47D xenograft model in nude mice. Representative sizes of the tumors extracted from the animals at day 10 post-injection of the cells are shown (left). Scatter dot plot outlining the decrease in tumor volume at day 3 and day 10 post-implantation of the cells (right). EV, blue; sh2, red. Data are normalized to the EV and presented as mean values ± SEM. p-values are determined by two-tailed unpaired t-test (***p = 0.0003, ****p < 0.0001), n = 8 mice per group.
Fig. 3
Fig. 3. AAMDC regulates targets involved in cell proliferation and metabolism.
a Gene ontology (GO) analyses of the top 10 biological processes (sorted by Modified Fisher Exact p-value, EASE score by DAVID) identified by analysis of differentially regulated genes as assessed by RNA-seq of SUM52PE cells transduced with AAMDC shRNA #2 (sh2) compared with empty vector (EV) (Supplementary Data 2). b Network analysis (STRING, v11) outlining interactions between differentially regulated targets. MTHFD1L is outlined in red. c Schematic representation of 1C metabolism (folate and methionine cycles) and amino acid biosynthesis (serine and asparagine) pathways. Genes regulated by AAMDC (as per RNA-seq) are depicted in dark blue. 3PHP 3-phosphohydroxypyruvate, 3PS 3-phosphoserine, 3PG 3-phosphoglycerate, THF tetrahydrofolate, TCA tricarboxylic acid cycle. d Representative immunoblots (IB) showing the reduction of MTHFD1L protein expression by the AAMDC knockdowns (KDs) shown in Fig. 2a. Source data are provided as a Source Data file. e Knockdown of MTHFD1L by shRNA decreased cell proliferation in SUM52PE cells. Protein levels are assessed by IB (top) and cell proliferation by α-Ki-67 staining (green); Hoechst 33258-stained nuclei (blue). WT wild-type (untransduced cells), EV empty vector, MTHFD1L shRNAs #1–#2 (sh1–2). Representative images are shown (middle). Quantification is shown in bottom panel: WT (gray), EV (blue), shRNA #1 (orange), shRNA #2 (red). The relative quantification of Ki-67+ cells is normalized to EV and presented as mean values ± SD. p-values are determined by two-tailed unpaired t-test (**p = 0.0039, ****p < 0.0001). Fields of view examined: n = 7 for EV, n = 9 for WT and sh1, and n = 10 for sh2 over 2 independent experiments (right panel). f The top 25 significantly differentially regulated metabolites (WT vs. AAMDC sh2; p < 0.05, two-tailed unpaired t-test) identified by liquid chromatography-mass spectrometry (LC-MS) in SUM52PE cells stably transduced with either AAMDC sh2 or EV. n = 3 biologically independent experiments.
Fig. 4
Fig. 4. AAMDC knockdowns downregulate the PI3K-AKT-mTOR axis through translational suppression of MYC and ATF4 leading to transcriptional downregulation of AAMDC-dependent targets.
a Regulation of the PI3K-AKT-mTOR pathway in SUM52PE cells transduced with AAMDC shRNAs assessed by immunoblotting. WT wild-type (untransduced cells), EV empty vector. Source data are provided as a Source Data file. b Modulation of the PI3K-AKT-mTOR pathway by pharmacological inhibition. SUM52PE cells were treated for 24 h with the indicated PI3K-AKT-mTOR inhibitors. Source data are provided as a Source Data file. c Transcriptional regulation of selected AAMDC-dependent transcripts involved in cell cycle and epigenetic regulation (left) and metabolic control (right). The results are normalized to vehicle-treated cells. Statistical significance is determined by multiple t-test using the Holm-Sidak method with alpha = 0.001 (left) and alpha = 0.05 (right), and presented as mean values ± SD, *p < 0.0001. n = 3 biologically independent experiments. d, Decreased promoter occupancy of ATF4 and MYC transcription factors at predicted promoter sites in two AAMDC targets: ASNS and MTHFD1L determined by promoter-specific chromatin immunoprecipitation (ChIP). SUM52PE cells are transduced with either empty vector (EV) or with AAMDC shRNA #2 (sh2), or treated with either vehicle control or 100 nM dactolisib (24 h). The position of ATF4 and MYC and the primers used for quantification are shown (top). Enrichment is determined by qRT-PCR and normalized to control cells and presented as mean values ± SEM. p-values are determined by two-tailed unpaired t-test. For ASNS promoter: *p = 0.0102 and *p = 0.0447 for dactolisib and sh2, respectively; **p = 0.0019, ***p = 0.0003. For MTHFD1L promoter: *p = 0.0201. n = 3 biologically independent experiments. TSS transcription start site, F forward, R reverse.
Fig. 5
Fig. 5. AAMDC knockdown and PI3K-AKT-mTOR inhibitors regulate the transcription of genes involved in common biological processes.
a Volcano plots showing differentially expressed gene (DEG) transcripts in AAMDC shRNA #2 (sh2) vs. empty vector (EV) and dactolisib, everolimus, AZD8055, and buparlisib vs. dimethyl sulfoxide (DMSO) vehicle controls (left to right panels). Significantly upregulated DEGs, log2fold-change (log2FC) > 1, Padj. < 0.05, are depicted in red and significantly downregulated DEGs (log2FC < −1, Padj. < 0.05) in green. b Scatter plots outlining the distribution of all significant DEGs (Padj. < 0.01) in EV vs. WT (wild-type) control (y-axis) against AAMDC sh2 vs. EV (x-axis) and dactolisib, everolimus, AZD8055, and buparlisib vs. DMSO controls (y-axis) against AAMDC sh2 vs. EV (x-axis) (left to right panels). A linear model is shown (green line) (R2 indicating model fit) and the Spearman correlation (rS) between the outlined conditions. Color represents gene density within that region of the plot: low density (black) to high density (yellow). c Gene ontology (GO) analysis of 186 downregulated and 123 upregulated genes (Padj. <  0.01) that are common in the AAMDC sh2 sample for at least three of the drug treatments. The top 10 biological processes are ranked by the p-values. d Gene set enrichment analysis (GSEA) plot of mTORC1 signaling targets shown in Supplementary Data 4 in AAMDC sh2 compared with EV, as well as dactolisib, everolimus, AZD8055, and buparlisib compared with DMSO control (Ctrl) (left to right panels). The y-axis and the green line show the enrichment score for each gene, illustrated as a vertical line plotted in rank order of the most gene abundance (red, left) to the least gene abundance (blue, right) within the indicated samples (as log2FC/comparison); the black vertical lines correspond to member genes from the set. NES normalized enrichment score, FDR false discovery rate. e As in (d) for the MYC target genes shown in Supplementary Data 4. f As in (d) for the estrogen-responsive genes shown in Supplementary Data 4.
Fig. 6
Fig. 6. AAMDC activates PI3K-AKT-mTOR signaling and promotes E2-independent tumor growth in vivo.
a Activation of PI3K-AKT-mTOR signaling by various ligands increases MTHFD1L expression, as determined by immunoblot (IB). Panels 1 and 2 (from left to right): Serum-starved SUM52PE subjected to growth factor stimulation for 24 h with insulin (Ins, 300 μg/mL), fetal bovine serum (FBS, 20%), tumor necrosis factor α (TNFα, 50 ng/mL), and amino acids (4 h). Panel 3: The estrogen receptor positive (ER+) cell line SUM44PE was estrogen-starved for 72 h and then stimulated with estrogen (E2, 1 nM) for 24 h. Panel 4: Time-course of E2-mediated activation of the PI3K-AKT-mTOR-MTHFD1L axis in SUM44PE cells. Panel 5: Activation of PI3K-AKT-mTOR upon lentiviral transduction of AAMDC cDNA in MCF-7 cells compared to empty vector (EV) and untransduced wild-type (WT) cells grown either under starvation conditions (in the absence of serum, estrogen, or non-essential amino acids) or in complete medium for 24 h prior to immunoblotting with the indicated antibodies (α). Source data are provided as a Source Data file. b Left: mRNA (top) and protein expression (bottom) levels in MCF-7 cells lentivirally transduced either with AAMDC cDNA or EV grown under starvation conditions prior to their injection into nude mice. mRNA levels for the same cells grown in complete medium are shown. Middle: mRNA expression of AAMDC in the extracted tumors (top) with representative images of the tumors indicated (bottom), harvested at day 55. Right: Mean tumor volumes in nude mice injected with low growth factor (LGF) Matrigel® and with MCF-7 cells transduced with either the EV or AAMDC cDNA. Mice were injected with 1 μg of estradiol valerate (+E2, top) or with vehicle control in the absence of estrogen (-E2, bottom). The mean tumor volume of n = 8 mice is normalized to day 7 (left). Volume measurements of individual mice are plotted for the selected time-points shown (right). Statistical significance is determined using a two-tailed unpaired t-test and presented as mean values ±  SEM. For MCF-7 cells and tumors: ***p = 0.0005, ****p < 0.0001. Multiple unpaired t-test for tumor volume +E2 + LGF: *p = 0.0214, left; *p = 0.0111, right. For tumor volume −E2 + LGF (left plot): day 16 **p = 0.0086, day 20 *p = 0.0277, day 24 **p = 0.0052, day 27 *p = 0.0339, day 34 **p = 0.0026, day 38 *p = 0.0132, day 41 **p = 0.0042, day 45 ***p = 0.0009, day 48 ***p = 0.0002, day 52 ***p = 0.0004, day 55 ***p = 0.0003; (right plot): day 24 *p = 0.0175, day 55 **p = 0.0011). Source data are provided as a Source Data file. c Immunohistochemistry (IHC) analysis of two representative tumors collected at day 55 for each condition. Tumor sections were stained with hematoxylin and eosin (H&E) or the antibodies indicated and the images quantified. The error bars indicate the mean ± SEM. Statistical significance between empty vector (EV) and AAMDC cDNA conditions is determined by a two-tailed unpaired t-test (***p = 0.0002, and ****p < 0.0001). n = 3 biologically independent animals.
Fig. 7
Fig. 7. Sensitization of luminal IntClust2 cell lines expressing AAMDC by co-treatment with PI3K-AKT-mTORC1 blockers in combination with tamoxifen.
a Pharmacological blockade of PI3K-AKT-mTOR leads to downregulation of MTHFD1L expression in estrogen receptor positive (ER+) intercluster 2 (IntClust2) breast cancer cell lines (SUM44PE and MDA-MB-134) treated with tamoxifen (Tam, 5 μM) in combination with dactolisib or everolimus (24 h, at the concentrations indicated in the blots). Source data are provided as a Source Data file. bd Dose-dependent changes in cell viability in the ER+ breast cancer cell lines MDA-MB-134 (b), SUM44PE (c), and T-47D (d) treated with dactolisib (Dacto., top, blue) or everolimus (Evero., bottom, blue), with tamoxifen (Tam., red) and as combinations (green). Data are presented as mean values ± SD. n = 3 biologically independent experiments. Viability is determined using a luminescence assay (CellTiter-Glo®) after 72 h post-treatment. e Tamoxifen and selected inhibitors of the PI3K-AKT-mTOR pathway exhibit synergistic pharmacological interactions in inhibiting tumor cell viability. Plots indicating the combination index (CI) for tamoxifen with dactolisib (purple) and tamoxifen with everolimus (cyan) in MDA-MB-134 (left), SUM44PE (middle), and T-47D (right) cells. CI < 1 synergistic, CI = 1 additive, and CI > 1 antagonistic. The CI is calculated from the average of three independent cell viability assays by the CI index method. Fraction affected is the fraction of non-viable cells. f Dose-dependent changes in cell viability in the MCF-7 cell line stably overexpressing AAMDC cDNA compared to empty vector (EV) treated with dactolisib, everolimus, and docetaxel. Statistical significance is determined for biological triplicates and presented as mean values ± SD and p-values are determined by multiple unpaired t-tests. For dactolisib, from left to right: **p = 0.0007, **p = 0.0013, **p = 0.0016, ***p < 0.0001, ***p < 0.0001; for everolimus, from left to right: *p = 0.0062, *p = 0.0053, *p = 0.0066. Bottom right: Relative AAMDC mRNA expression in a panel of ER+ breast cancer cell lines normalized to the non-tumorigenic epithelial line MCF-12A, as assessed by qRT-PCR. Data presented as mean values ± SD and p-values are determined by two-tailed unpaired t-test with Welch’s correction (*p = 0.0308, **p = 0.0012, ***p = 0.0001).
Fig. 8
Fig. 8. AAMDC interacts with the GTPase activating protein RabGAP1L.
a Colocalization of endogenous AAMDC and RabGAP1L proteins in luminal breast cancer cells assessed by immunofluorescence (IF). Hoechst 33258-stained nuclei (blue), α-AAMDC antibody (green), and α-RabGAP1L antibody (red). Arrows indicate regions of strong signal overlap. b Localization of AAMDC and RabGAP1L in adjacent representative sections of normal breast, and in selected estrogen receptor negative (ER) or invasive ductal carcinoma (IDC) breast cancer specimens assessed by immunohistochemistry (IHC). c Superposition of the crystal structure of bacterial (1IHN, cyan, 10.2210/pdb1IHN/pdb), and human (2AB1, orange, 10.2210/pdb2AB1/pdb), AAMDC proteins (left) and the Phyre2 (v2.0) homology model of human RabGAP1L. The phosphotyrosine-binding (PTB) domain is shown in red and the C-terminal Tre-2/Bub2/CdC16 (TBC) Rab-binding domain in violet (right). df Interaction between AAMDC, RabGAP1L, and Rab7a by immunoprecipitation (IP) in HEK293T cells transiently transfected with full-length (d) or deletion mutants (ef) of the tagged cDNAs: HA-RabGAP1L, FLAG-AAMDC, and Myc-Rab7a. The IPs were immunoblotted with an α-HA antibody to detect HA-RabGAP1L (98 kDa) or α-FLAG to detect FLAG-AAMDC (17 kDa). Deletion of the PTB domain is indicated by HA-RabGAP1LΔPTB(471) (48 kDa) (e), and deletion of the Rab-binding TBC domain by HA-RabGAP1LΔTBC(585) (64 kDa) (f); α-IgG-conjugated beads and beads only are used as a control. g Bioluminescence resonance energy transfer (BRET) assays in HEK293FT cells transiently overexpressing Venus-HA-Rab7a or Venus-Rab22a, RLuc8-AAMDC, full-length RabGAP1L, RabGAP1LΔPTB, or RabGAP1LΔTBC. Control cells (Ctrl) are transfected with Venus-Rab and RLuc8-AAMDC only. The BRET ratio values are normalized to the respective controls. The individual values for n = 4 biological replicates (Rab7a) and for n = 3 biological replicates (Rab22a) are shown as mean values ± SEM, and statistical significance is determined using Brown-Forsythe and Welch ANOVA tests with Dunnett’s T3 multiple comparison test (Rab7a: **p = 0.0096 for Ctrl vs. RabGAP1L WT, **p = 0.0069 for RabGAP1L WT vs. RabGAP1LΔPTB, and not significant (ns) for RabGAP1L WT vs. RabGAP1LΔTBC and for RabGAP1LΔPTB vs. RabGAP1LΔTBC; Rab22a: **p = 0.0024 for Ctrl vs. RabGAP1L WT, **p = 0.0045 for RabGAP1L WT vs. RabGAP1LΔPTB, **p = 0.0020 for RabGAP1L WT vs. RabGAP1LΔTBC, and ns for RabGAP1LΔPTB vs. RabGAP1LΔTBC).

References

    1. Perou CM, et al. Molecular portraits of human breast tumours. Nature. 2000;406:747–752. doi: 10.1038/35021093. - DOI - PubMed
    1. Sorlie T, et al. Gene expression patterns of breast carcinomas distinguish tumor subclasses with clinical implications. Proc. Natl Acad. Sci. USA. 2001;98:10869–10874. doi: 10.1073/pnas.191367098. - DOI - PMC - PubMed
    1. Parker JS, et al. Supervised risk predictor of breast cancer based on intrinsic subtypes. J. Clin. Oncol. 2009;27:1160–1167. doi: 10.1200/JCO.2008.18.1370. - DOI - PMC - PubMed
    1. Sparano JA, et al. Adjuvant chemotherapy guided by a 21-gene expression assay in breast cancer. N. Engl. J. Med. 2018;379:111–121. doi: 10.1056/NEJMoa1804710. - DOI - PMC - PubMed
    1. Curtis C, et al. The genomic and transcriptomic architecture of 2,000 breast tumours reveals novel subgroups. Nature. 2012;486:346–352. doi: 10.1038/nature10983. - DOI - PMC - PubMed

Publication types

MeSH terms