. 2021 Mar 26;12(1):1908.
doi: 10.1038/s41467-021-22216-x.

DNA replication origins retain mobile licensing proteins

Affiliations

DNA replication origins retain mobile licensing proteins

Humberto Sánchez et al. Nat Commun. .

Abstract

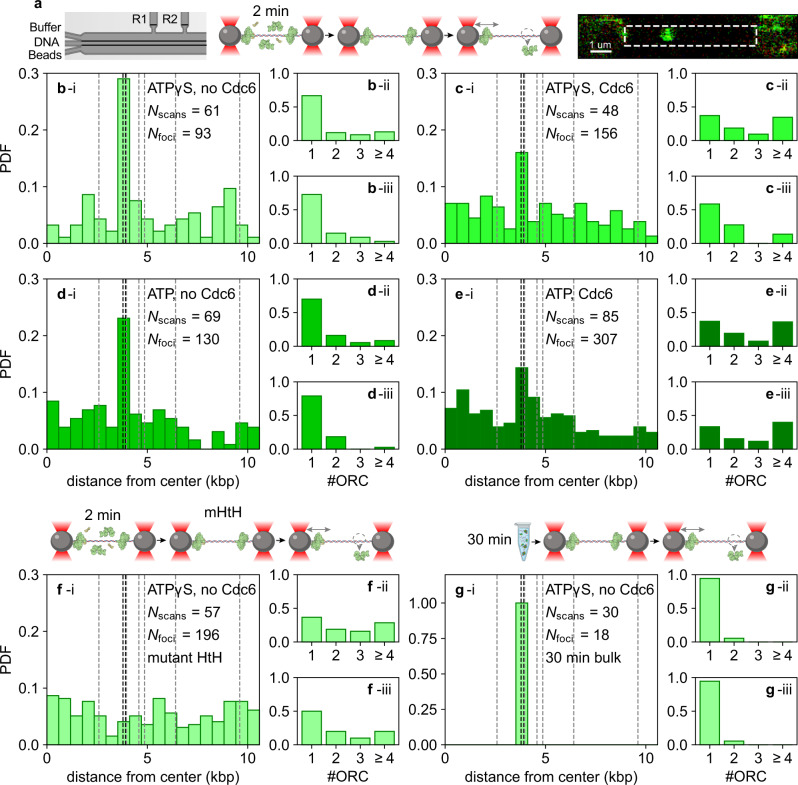
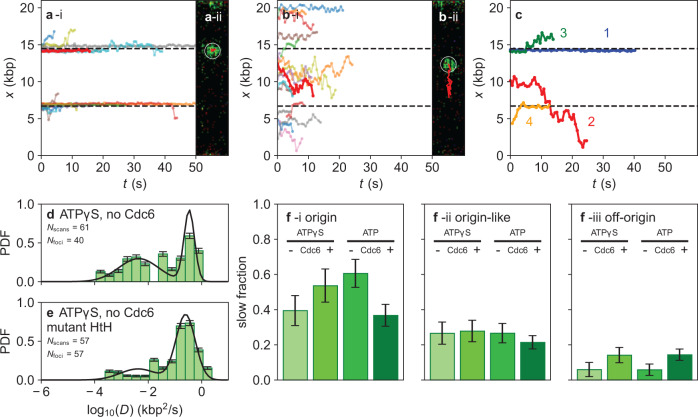
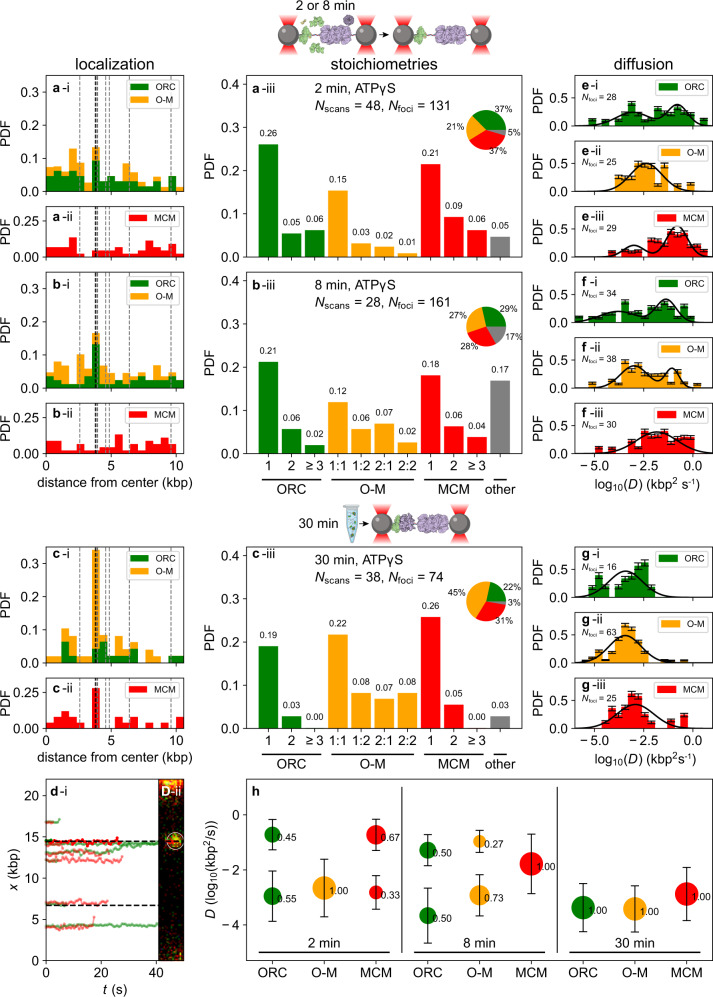
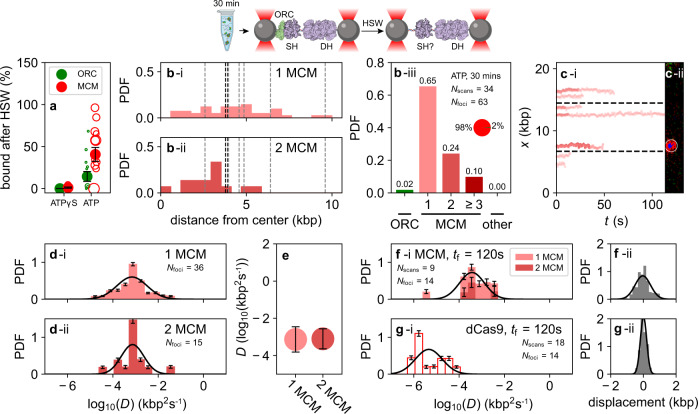
DNA replication in eukaryotes initiates at many origins distributed across each chromosome. Origins are bound by the origin recognition complex (ORC), which, with Cdc6 and Cdt1, recruits and loads the Mcm2-7 (MCM) helicase as an inactive double hexamer during G1 phase. The replisome assembles at the activated helicase in S phase. Although the outline of replisome assembly is understood, little is known about the dynamics of individual proteins on DNA and how these contribute to proper complex formation. Here we show, using single-molecule optical trapping and confocal microscopy, that yeast ORC is a mobile protein that diffuses rapidly along DNA. Origin recognition halts this search process. Recruitment of MCM molecules in an ORC- and Cdc6-dependent fashion results in slow-moving ORC-MCM intermediates and MCMs that rapidly scan the DNA. Following ATP hydrolysis, salt-stable loading of MCM single and double hexamers was seen, both of which exhibit salt-dependent mobility. Our results demonstrate that effective helicase loading relies on an interplay between protein diffusion and origin recognition, and suggest that MCM is stably loaded onto DNA in multiple forms.


Conflict of interest statement

The authors declare no competing interests.

Figures

Fig. 1
Fig. 1. The spatial distribution of ORC is dominated by the origin.
a From left to right: scheme of the flow cell, experimental workflow, and a representative image of labeled ORC bound to a single DNA molecule. The dashed square highlights the region used for data analysis. A DNA molecule is tethered to beads that are trapped in a dual-beam optical trap, allowing the DNA to be held under tension. When labeled ORC is introduced and binds to the DNA, it is excited by an integrated confocal laser scanning system (for further details, see Methods). be (i) Histograms of the spatial distribution of DNA-bound JF549-ORC following a 2 min-long incubation. (ii) Distribution of the stoichiometry of ORC foci everywhere on the DNA, and (iii) within 0.2 µm of the HtH origin (iii). Specific conditions are: b incubation of ORC in ATPγS; c ORC and Cdc6 in ATPγS; d ORC in ATP; e ORC and Cdc6 in ATP. f As in b, except that DNA contains the mHtH origin as described in Supplementary Fig. 7. g As in b, except that JF549-ORC is incubated with the 21.2 kbp DNA in bulk for 30 min before being introduced into the flow cell and imaged as in be. Bold dashed lines in the seventh bin from the left indicate the head-to-head (HtH) high-affinity ORC-binding sites. Faint dashed lines indicate near-cognate binding sites elsewhere on the DNA.
Fig. 2
Fig. 2. ORC molecules exhibit diffusive motion that is halted at origins.
a, b (i) Sample time traces and (ii) scan images that illustrate the observed motion of JF549-ORC initially localized a within 0.2 µm of the HtH origin or b in any other location. Traces shown represent 3% (randomly selected) of traces from all four biochemical conditions described in Fig. 1. c (i) Sample time traces and (ii) scan images that illustrate the four main types of motion observed for JF549-ORC: (1) static; (2) diffusive; (3) static and then diffusive; (4) diffusive and then static. d Histogram of the diffusion constants of ORC incubated in the presence of ATPγS. Only foci containing 1 or 2 ORC were considered. The two populations of diffusion constants fit to log-normal distributions (solid black lines), taking into account the error bars derived from bootstrapping the data set 100 times. This yields populations with mean ± SEM of 0.06 ± 0.04 kbp2 s−1 (59% of the distribution) and 0.97 ± 0.09 kbp2 s−1 (p < 0.0001 by one-way ANOVA). e As in d, except that the DNA contains the mHtH origin described in Supplementary Fig. 7. Here, fitting yields populations with mean ± SEM 0.05 ± 0.03 kbp2 s−1 (26%) and 0.88 ± 0.09 kbp2 s−1 (p < 0.0001 by one-way ANOVA). f Quantification of the percent of ORC molecules initially bound in a given location, which go on to display slow diffusion: (i) ORC molecules initially bound within 0.2 µm of the HtH origin; (ii) ORC molecules initially bound within 0.2 µm of origin-like sequences; (iii) ORC molecules initially bound elsewhere. Error bars represent the error of sample proportion, sqrt(p(1−p)/n), where p is the proportion of a sample in a given population, and n is the sample size.
Fig. 3
Fig. 3. Spatial distribution, stoichiometry, and diffusive behavior of loading intermediates observed in ATPγS.
a Histograms of the spatial distribution of fluorescent foci after a 2-min incubation in the flow cell. (i) Stacked bins representing foci containing 1 or 2 ORC (green) or colocalized ORC and MCM (orange), and (ii) foci containing 1 or 2 MCM (red) molecules. The overall stoichiometry distributions of these foci are shown in panel (iii). The gray bin labeled “other” accounts for all colocalized foci where either the ORC or MCM stoichiometry is 3 or higher. b As in a, but following an incubation time of 8 min. c As in a and b, but following a 30-min incubation in bulk, ×1000 dilution, and introduction into the flow cell. d Sample time traces and corresponding image to illustrate the motion of colocalized JF549-ORC (green) and JF646-MCM (red) acquired at a frame rate of 0.6 s. eg Histograms of the diffusion constants of the loading intermediates shown in ac. The populations of diffusion constants fit log-normal distributions (solid black lines), taking into account the error bars derived from bootstrapping the data set 100 times. e After a 2-min incubation in the flow cell, the fitted diffusion coefficients are (mean ± SEM, in units of kbp2 s−1): ORC: 0.02 ± 0.04 and 1.0 ± 0.4 (p = 0.008 by one-way ANOVA); O-M: 0.07 ± 0.06; MCM: 0.009 ± 0.005 and 1.0 ± 0.3 (p = 0.04 by one-way ANOVA). f After an 8 min incubation, the diffusion coefficients are (mean ± SEM, in kbp2 s−1): ORC: 0.01 ± 0.02 and 0.28 ± 0.09 (p = 0.007 by one-way ANOVA); O-M: 0.012 ± 0.007 and 0.39 ± 0.09 (p < 0.0001 by one-way ANOVA); MCM: 0.9 ± 2.3. g After the bulk 30-min incubation and introduction into the flow cell, the diffusion coefficients are (mean ± SEM, in kbp2 s−1): ORC: 0.008 ± 0.009; O-M: 0.006 ± 0.003; MCM: 0.04 ± 0.06. h Summary of the fitted diffusion constants in eg for different incubation times and conditions (e.g., in-flow-cell or bulk).
Fig. 4
Fig. 4. Spatial distribution, stoichiometry, and diffusive behavior of MCM in ATP after HSW.
a The fraction of ORC and MCM complexes that survive an in-situ HSW following incubation in ATPγS (left) or ATP (right). Percentages are the ratio of the total fluorescence of ORC (green) or MCM (red) before and after the HSW. Open circles are individual measurements, while the filled dots and error bars are the sample mean and S.D., respectively. In ATPγS (green), N = 6, whereas in ATP, N = 11. b (i–ii) The spatial distributions of the fluorescent foci, and (iii) the overall stoichiometry distribution. The gray bin labeled “other” accounts for all foci with ORC or MCM stoichiometries higher than 3. c Images and sample time traces that illustrate the motion of foci initially containing one (light red) or two (red) MCM. d Histograms of the diffusion constants of foci containing a single MCM (i) or two MCM (ii). Log-normal fits to the distributions of single (double) MCMs yield mean ± SEM of 0.006 ± 0.002 kbp2 s−1 (0.004 ± 0.001 kbp2 s−1), taking into account the error bars derived from bootstrapping the data set 100 times. e Summary plot of the diffusion constants derived from the data in d. f (i) Histogram of the diffusion constants of foci containing a single MCM (light red) or two MCM (red) imaged in high-salt buffer at an acquisition frequency of one frame every 120 s. The fitted diffusion coefficient was 0.0023 ± 0.0009 kbp2 s−1 (mean ± SEM). (ii) Histogram of the net displacements observed for the same MCM molecules as in (i). g (i) Histogram of the diffusion constants for foci containing dCas9-JF646 imaged in high-salt buffer at the same reduced acquisition frequency, with diffusion coefficient (3 ± 1) × 10−5 kbp2 s−1 (mean ± SEM). By one-way ANOVA, the distributions in f (i) and g (i) are statistically distinct (p < 0.0001). (ii) Histogram of the net displacements observed for the same dCas9 molecules as in (i).

Similar articles

Cited by

References

    1. Bell SP, Labib K. Chromosome duplication in Saccharomyces cerevisiae. Genetics. 2016;203:1027–1067. doi: 10.1534/genetics.115.186452. - DOI - PMC - PubMed
    1. Bell SP, Stillman B. ATP-dependent recognition of eukaryotic origins of DNA replication by a multiprotein complex. Nature. 1992;357:128–134. doi: 10.1038/357128a0. - DOI - PubMed
    1. Liachko I, Youngblood RA, Keich U, Dunham MJ. High-resolution mapping, characterization, and optimization of autonomously replicating sequences in yeast. Genome Res. 2013;23:698–704. doi: 10.1101/gr.144659.112. - DOI - PMC - PubMed
    1. Hoggard T, Shor E, Müller CA, Nieduszynski CA, Fox CA. A link between ORC-origin binding mechanisms and origin activation time revealed in budding yeast. PLoS Genet. 2013;9:1003798. doi: 10.1371/journal.pgen.1003798. - DOI - PMC - PubMed
    1. Remus D, et al. Concerted loading of Mcm2-7 double hexamers around DNA during DNA replication origin licensing. Cell. 2009;139:719–730. doi: 10.1016/j.cell.2009.10.015. - DOI - PMC - PubMed

Publication types

MeSH terms

LinkOut - more resources