. 2021 Mar 26;12(1):1901.
doi: 10.1038/s41467-021-22267-0.

Cargo sorting zones in the trans-Golgi network visualized by super-resolution confocal live imaging microscopy in plants

Affiliations

Cargo sorting zones in the trans-Golgi network visualized by super-resolution confocal live imaging microscopy in plants

Yutaro Shimizu et al. Nat Commun. .

Abstract

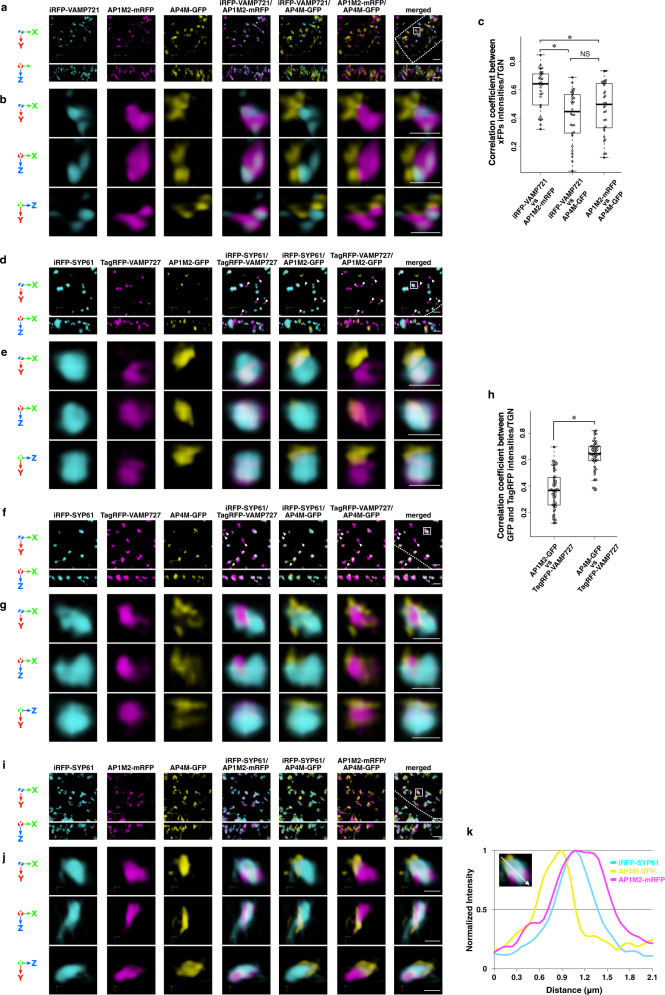
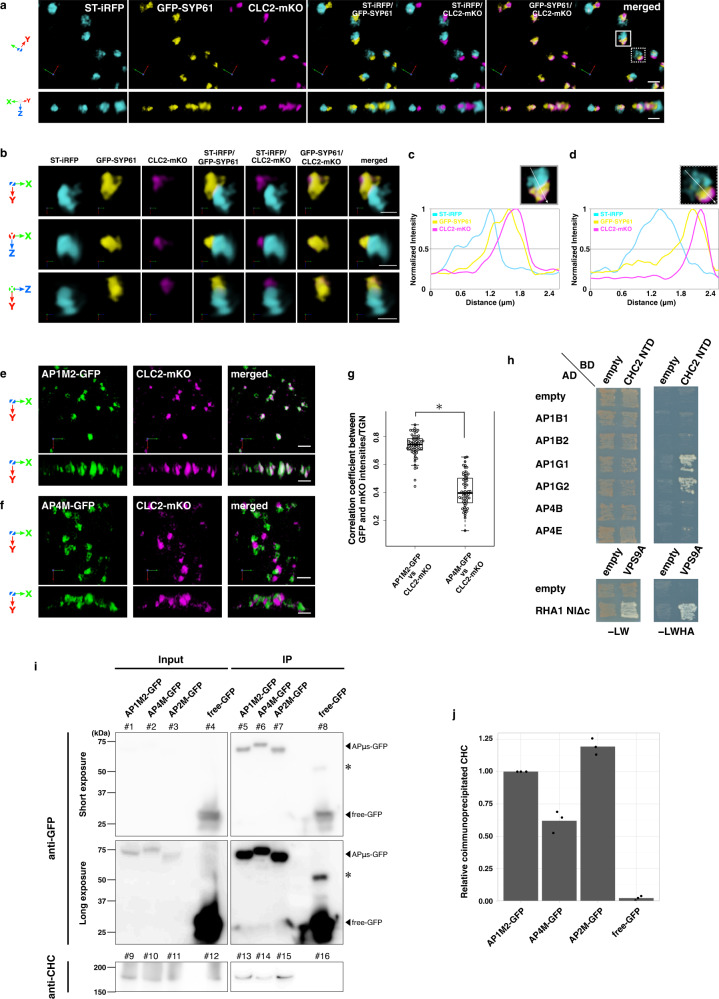
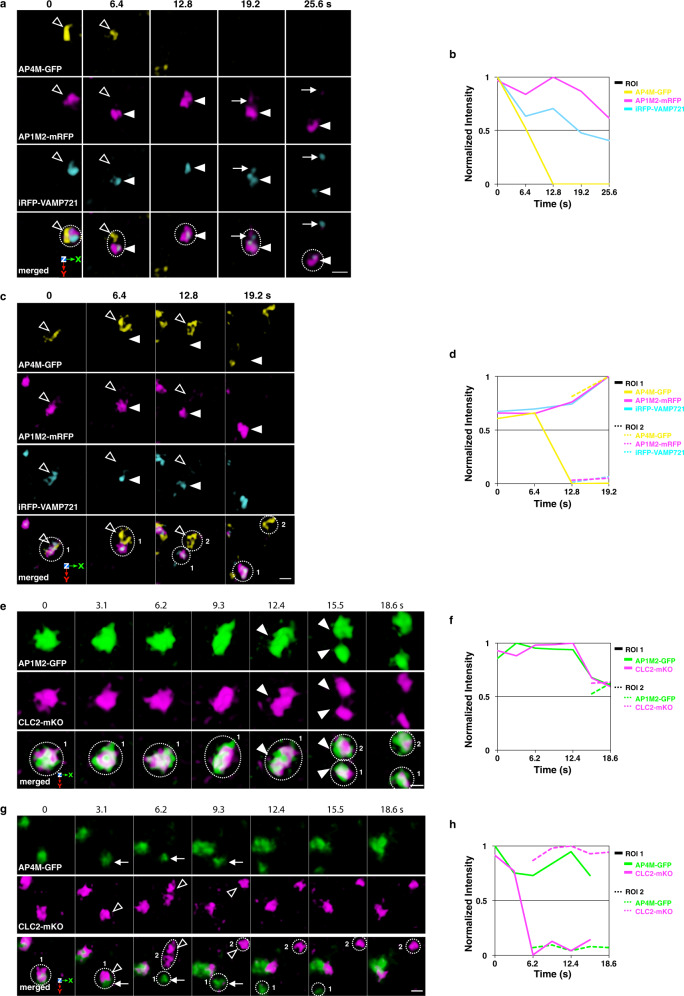
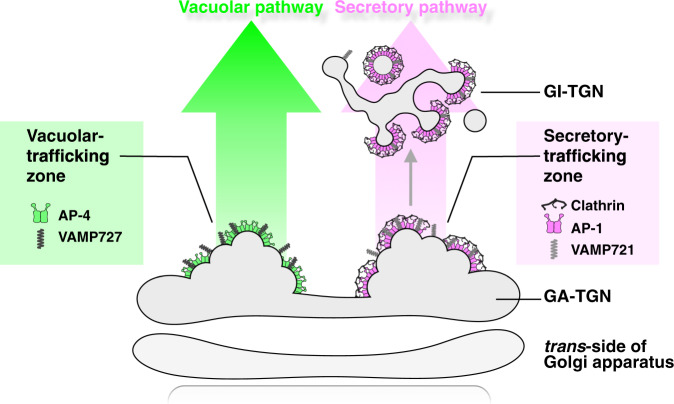
The trans-Golgi network (TGN) has been known as a key platform to sort and transport proteins to their final destinations in post-Golgi membrane trafficking. However, how the TGN sorts proteins with different destinies still remains elusive. Here, we examined 3D localization and 4D dynamics of TGN-localized proteins of Arabidopsis thaliana that are involved in either secretory or vacuolar trafficking from the TGN, by a multicolor high-speed and high-resolution spinning-disk confocal microscopy approach that we developed. We demonstrate that TGN-localized proteins exhibit spatially and temporally distinct distribution. VAMP721 (R-SNARE), AP (adaptor protein complex)-1, and clathrin which are involved in secretory trafficking compose an exclusive subregion, whereas VAMP727 (R-SNARE) and AP-4 involved in vacuolar trafficking compose another subregion on the same TGN. Based on these findings, we propose that the single TGN has at least two subregions, or "zones", responsible for distinct cargo sorting: the secretory-trafficking zone and the vacuolar-trafficking zone.


Conflict of interest statement

The authors declare no competing interests.

Figures

Fig. 1
Fig. 1. Differential distribution of TGN-localized proteins.
af Confocal images under conventional CLSM (ac) or 3D images under SCLIM (df) of GFP-SYP61 and mRFP-SYP61 (a, d), GFP-SYP43 and mRFP-SYP61 (b, e), or GFP-SYP43 and VHAa1-mRFP (c, f) in the epidermal cells of the root elongation zone. g 3D colocalization analysis of the TGN markers: n = 64, 50, and 118 TGNs for GFP-SYP61 vs mRFP-SYP61, GFP-SYP43 vs mRFP-SYP61, and GFP-SYP43 vs VHAa1-mRFP, respectively, from five or more biological replicates. Two-sided Steel-Dwass test; P = 0.86 (Left: GFP-SYP61 × mRFP-SYP61 vs GFP-SYP43 × mRFP-SYP61), P = 3.0 × 10−14 (Top: GFP-SYP61 × mRFP-YP61 vs GFP-SYP43 × VHAa1-mRFP), and P = 2.2 × 10−7 (Right: GFP-SYP43 × mRFP-SYP61 vs GFP-SYP43 × VHAa1-mRFP); *P < 0.01, NS = nonsignificant. Boxes represent 25% and 75% quartiles, lines within the box represent the median, and whiskers represent the minimum and maximum values within 1.5× the interquartile range. h 3D images of GFP-SYP61, TagRFP-VAMP727, and iRFP-VAMP721 in the epidermal cell of the root elongation zone under SCLIM. i Multi-angle magnified 3D images of GFP-SYP61, TagRFP-VAMP727, and iRFP-VAMP721 of the boxed area in h. Upper panels: top view; middle and lower panels: side view (h, i). The experiments were repeated at least five times independently with similar results, and micrographs from representative experiments are presented. Scale bars = 5 μm (ac); 1 μm (h, i). Grid width = 0.234 μm (df). Dashed lines indicate cell edges. V, vacuole area.
Fig. 2
Fig. 2. Distinct suborganellar localization of VAMP721, VAMP727, AP-1, and AP-4.
ak Three-color SCLIM imaging of root epidermal cells in the elongation zone of Arabidopsis expressing iRFP-VAMP721 × AP1M2-mRFP × AP4M-GFP (ac), iRFP-SYP61 × TagRFP-VAMP727 × AP1M2-GFP (d, e, h), iRFP-SYP61 × TagRFP-VAMP727 × AP4M-GFP (fh), or iRFP-SYP61 × AP1M2-mRFP × AP4M-GFP (ik). a, d, f, i 3D images. b, e, g, j Multi-angle magnified 3D images of the boxed area in a, d, f, and i, respectively. Upper panels: top view; middle and lower panels: side view. Scale bars = 2 μm (a, d, f, i); 1 μm (b, e, g, j). Arrowheads indicate TagRFP-VAMP727 without iRFP-SYP61 and APs-GFP signals (d, e). Dashed lines indicate cell edges. c 3D colocalization analysis between μ-subunits of APs and VAMP721 on the TGN: n = 30 TGNs for each experiment, from three biological replicates. Two-sided Steel-Dwass test; P = 1.8 × 10−4 (Left: iRFP-VAMP721 × AP1M2-mRFP vs iRFP-VAMP721 × AP4M-GFP), P = 8.3 × 10−3 (Top: iRFP-VAMP721 × AP1M2-mRFP vs AP1M2-mRFP × AP4M-GFP), and P = 0.51 (Right: iRFP-VAMP721 × AP4M-GFP vs AP1M2-mRFP × AP4M-GFP); *P < 0.01, NS = nonsignificant. Boxes represent 25% and 75% quartiles, lines within the box represent the median, and whiskers represent the minimum and maximum values within 1.5× the interquartile range. h 3D colocalization analysis between μ-subunits of APs and VAMP727 on the TGN: n = 54 TGNs for each experiment, from five biological replicates. Two-sided Wilcoxon rank-sum test; P = 1.5 × 10−14; *P < 0.01. Boxes represent 25% and 75% quartiles, lines within the box represent the median, and whiskers represent the minimum and maximum values within 1.5× the interquartile range. k A graph shows normalized fluorescence intensity profile across a TGN of boxed area in i. The experiments were repeated independently three (ac) or five (dk) times with similar results, and photographs from representative experiments are presented.
Fig. 3
Fig. 3. Clathrin localizes on the trans-side membrane of the TGN with AP-1.
a 3D images of ST-iRFP, GFP-SYP61, and CLC2-mKO in the epidermal cell of the root elongation zone under SCLIM. b Multi-angle magnified images of boxed area in a. c, d Graphs show normalized fluorescence intensity profile across a Golgi apparatus to clathrin of boxed area and dashed boxed area in a, respectively. e, f 3D images of AP1M2-GFP and CLC2-mKO (e) or AP4M-GFP and CLC2-mKO (f) in the epidermal cells of the root elongation zone under SCLIM. Upper panels: top view; middle and lower panels: side view (a, b, e, f). Scale bars = 2 μm (a, e, f); 1 μm (b). g 3D colocalization analysis between μ-subunits of APs and CLC2: n = 60 TGNs for each experiment, from five biological replicates. Two-sided Wilcoxon rank-sum test; P = 2.2 × 10−16; *P < 0.01. Boxes represent 25% and 75% quartiles, lines within the box represent the median, and whiskers represent the minimum and maximum values within 1.5× the interquartile range. h Yeast two-hybrid interaction assay between AP-1 or AP-4 vs clathrin. Large subunits of AP-1 and AP-4 were expressed as the fusion protein with an activation domain (AD) and an amino-terminal domain of CHC2 (CHC2 NTD) was expressed as the fusion protein with a DNA binding domain (BD) in the yeast strain AH109. Transformants were plated on medium lacking Leu, Trp, His, and adenine (-LWHA) to test for interactions between two proteins or on medium lacking Leu and Trp (-LW) for 4 days at 30 °C. The assay for RHA1 NIΔc vs VPS9A was performed as a control experiment. i Co-immunoprecipitation analysis of immunoprecipitates with an anti-GFP antibody from seedlings expressing either AP1M2-GFP, AP4M-GFP, AP2M-GFP (positive control), or free-GFP (negative control). The immunoprecipitates were immunoblotted using anti-GFP (lanes #1–8) or anti-CHC antibodies (lanes #9–16). Asterisks indicate non-specific bands. Input = 16% (anti-GFP; lanes #1–4); 1% (anti-CHC; lanes #9–12). j Densitometric quantification of CHC co-immunoprecipitated with GFP-tags. The experiments were repeated independently five (ah) or three (i, j) times with similar results, and micrographs from representative experiments are presented.
Fig. 4
Fig. 4. AP-1, but not AP-4, buds from the TGN.
ad 3D time-lapse (4D) images of iRFP-SYP61, AP1M2-mRFP, and AP4M-GFP in the epidermal cells of the root elongation zone under SCLIM. Arrowheads indicate the dissociation of AP1M2-mRFP and iRFP-SYP61 from a large population of TGN labeled with iRFP-SYP61. Images are lined up every 6.4 s (a) or 3.1 s (bd) from left to right. Scale bars = 1 μm. e–h Time course changes in relative fluorescence intensities of iRFP-SYP61, AP1M2-mRFP, and AP4M-GFP in ROIs of ad. The experiments were repeated independently six times with similar results, and micrographs from representative experiments are presented.
Fig. 5
Fig. 5. AP-1, but not AP-4, behaves together with VAMP721 and clathrin.
a, c 4D images of iRFP-VAMP721, AP1M2-mRFP, and AP4M-GFP in the epidermal cells of the root elongation zone under SCLIM. Arrowheads indicate AP1M2-mRFP and iRFP-VAMP721 dissociation from AP4M-GFP or the TGN (Open arrowheads). A small punctum containing AP1M2-mRFP and iRFP-VAMP721 (arrows) separated from the TGN-detached structure (arrowheads). e, g 4D images of AP1M2-GFP and CLC2-mKO (e) or AP4M-GFP and CLC2-mKO (g) in the epidermal cells of the root elongation zone under SCLIM. Arrowheads indicate coincidental AP1M2-GFP and CLC2-mKO signal fission. Open arrowheads indicate dissociation of CLC2-mKO from AP4M-GFP (arrows). Images are lined up every 6.4 s (a, c) or 3.1 s (e, g) from left to right. b, d, f, h Time course changes in relative fluorescence intensities in ROIs of a, c, e, and g, respectively. The experiments were repeated independently four times with similar results, and micrographs from representative experiments are presented.
Fig. 6
Fig. 6. Temporal relation between and ultrastructure of the Golgi apparatus, TGN, and secretory trafficking zone component clathrin.
a 4D images of ST-iRFP, GFP-SYP61, and CLC2-mKO in the epidermal cell of the root elongation zone under SCLIM. White arrowheads indicate dissociation of CLC2 and SYP61 subpopulation from the major population of the TGN (GA-TGN) labeled with GFP-SYP61. b Magnified images of boxed area in a. Images are lined up every 6.4 s from left to right. c Time course changes in relative fluorescence intensities of ST-iRFP, GFP-SYP61, and CLC2-mKO in the Golgi/GA-TGN or GI-TGN area in a. d, e Transmission electron microscopic images of Arabidopsis root epidermal cells. Arrowheads indicate clathrin-coated vesicles/buds. Boxed area shows the CCV cluster. The experiments were repeated independently at least three times with similar results, and micrographs from representative experiments are presented. Scale bars = 1 μm (a); 500 nm (b); 200 nm (d, e).
Fig. 7
Fig. 7. A schematic model of two distinct trafficking zones of the TGN.
The Golgi-associated TGN (GA-TGN) has at least two zones, the secretory-trafficking zone and the vacuolar-trafficking zone, which we propose are responsible for distinct cargo sorting in Arabidopsis root epidermal cells. The secretory-trafficking zone consists of R-SNARE VAMP721 (pale gray), adaptor protein AP-1 (magenta), coat protein clathrin (black). The vacuolar-trafficking zone consists of R-SNARE VAMP727 (dark gray) and adaptor protein AP-4 (green). From the secretory-trafficking zone, some of the TGN detaches as the Golgi-released independent TGN (GI-TGN) in a form of a vesicle/bud cluster including clathrin-coated vesicles/buds.

Similar articles

Cited by

References

    1. Griffiths G, Simons K. The trans Golgi network: sorting at the exit site of the Golgi complex. Science. 1986;234:438–443. doi: 10.1126/science.2945253. - DOI - PubMed
    1. Staehelin LA, Moore I. The plant Golgi apparatus: structure, functional organization and trafficking mechanisms. Annu. Rev. Plant Physiol. Plant Mol. Biol. 1995;46:261–288. doi: 10.1146/annurev.pp.46.060195.001401. - DOI
    1. Gendre D, Jonsson K, Boutté Y, Bhalerao RP. Journey to the cell surface—the central role of the trans-Golgi network in plants. Protoplasma. 2015;252:385–398. doi: 10.1007/s00709-014-0693-1. - DOI - PubMed
    1. Staehelin LA, Kang BH. Nanoscale architecture of endoplasmic reticulum export sites and of Golgi membranes as determined by electron tomography. Plant Physiol. 2008;147:1454–1468. doi: 10.1104/pp.108.120618. - DOI - PMC - PubMed
    1. Kang BH, Nielsen E, Preuss ML, Mastronarde D, Staehelin LA. Electron tomography of RabA4b- and PI-4Kβ1-labeled trans Golgi network compartments in Arabidopsis. Traffic. 2011;12:313–329. doi: 10.1111/j.1600-0854.2010.01146.x. - DOI - PubMed

Publication types

MeSH terms